2022-03-17_FANCM-crossovers-integrative-analysis-seg-ratio
Ruqian Lyu
3/17/2022
Last updated: 2022-03-17
Checks: 5 1
Knit directory: yeln_2019_spermtyping/
This reproducible R Markdown analysis was created with workflowr (version 1.7.0). The Checks tab describes the reproducibility checks that were applied when the results were created. The Past versions tab lists the development history.
Great job! The global environment was empty. Objects defined in the global environment can affect the analysis in your R Markdown file in unknown ways. For reproduciblity it’s best to always run the code in an empty environment.
The command set.seed(20190102) was run prior to running the code in the R Markdown file. Setting a seed ensures that any results that rely on randomness, e.g. subsampling or permutations, are reproducible.
Great job! Recording the operating system, R version, and package versions is critical for reproducibility.
Nice! There were no cached chunks for this analysis, so you can be confident that you successfully produced the results during this run.
Great job! Using relative paths to the files within your workflowr project makes it easier to run your code on other machines.
Tracking code development and connecting the code version to the results is critical for reproducibility. To start using Git, open the Terminal and type git init in your project directory.
This project is not being versioned with Git. To obtain the full reproducibility benefits of using workflowr, please see ?wflow_start.
Marker segregation
Test segregation bias for gametes.
[R scripts for preparing inputs for this report at: code/impute-chr-bin-state-scCNV.R]
Previous analysis from 2021-07-21_FANCM-crossover-integrative-analysis.Rmd
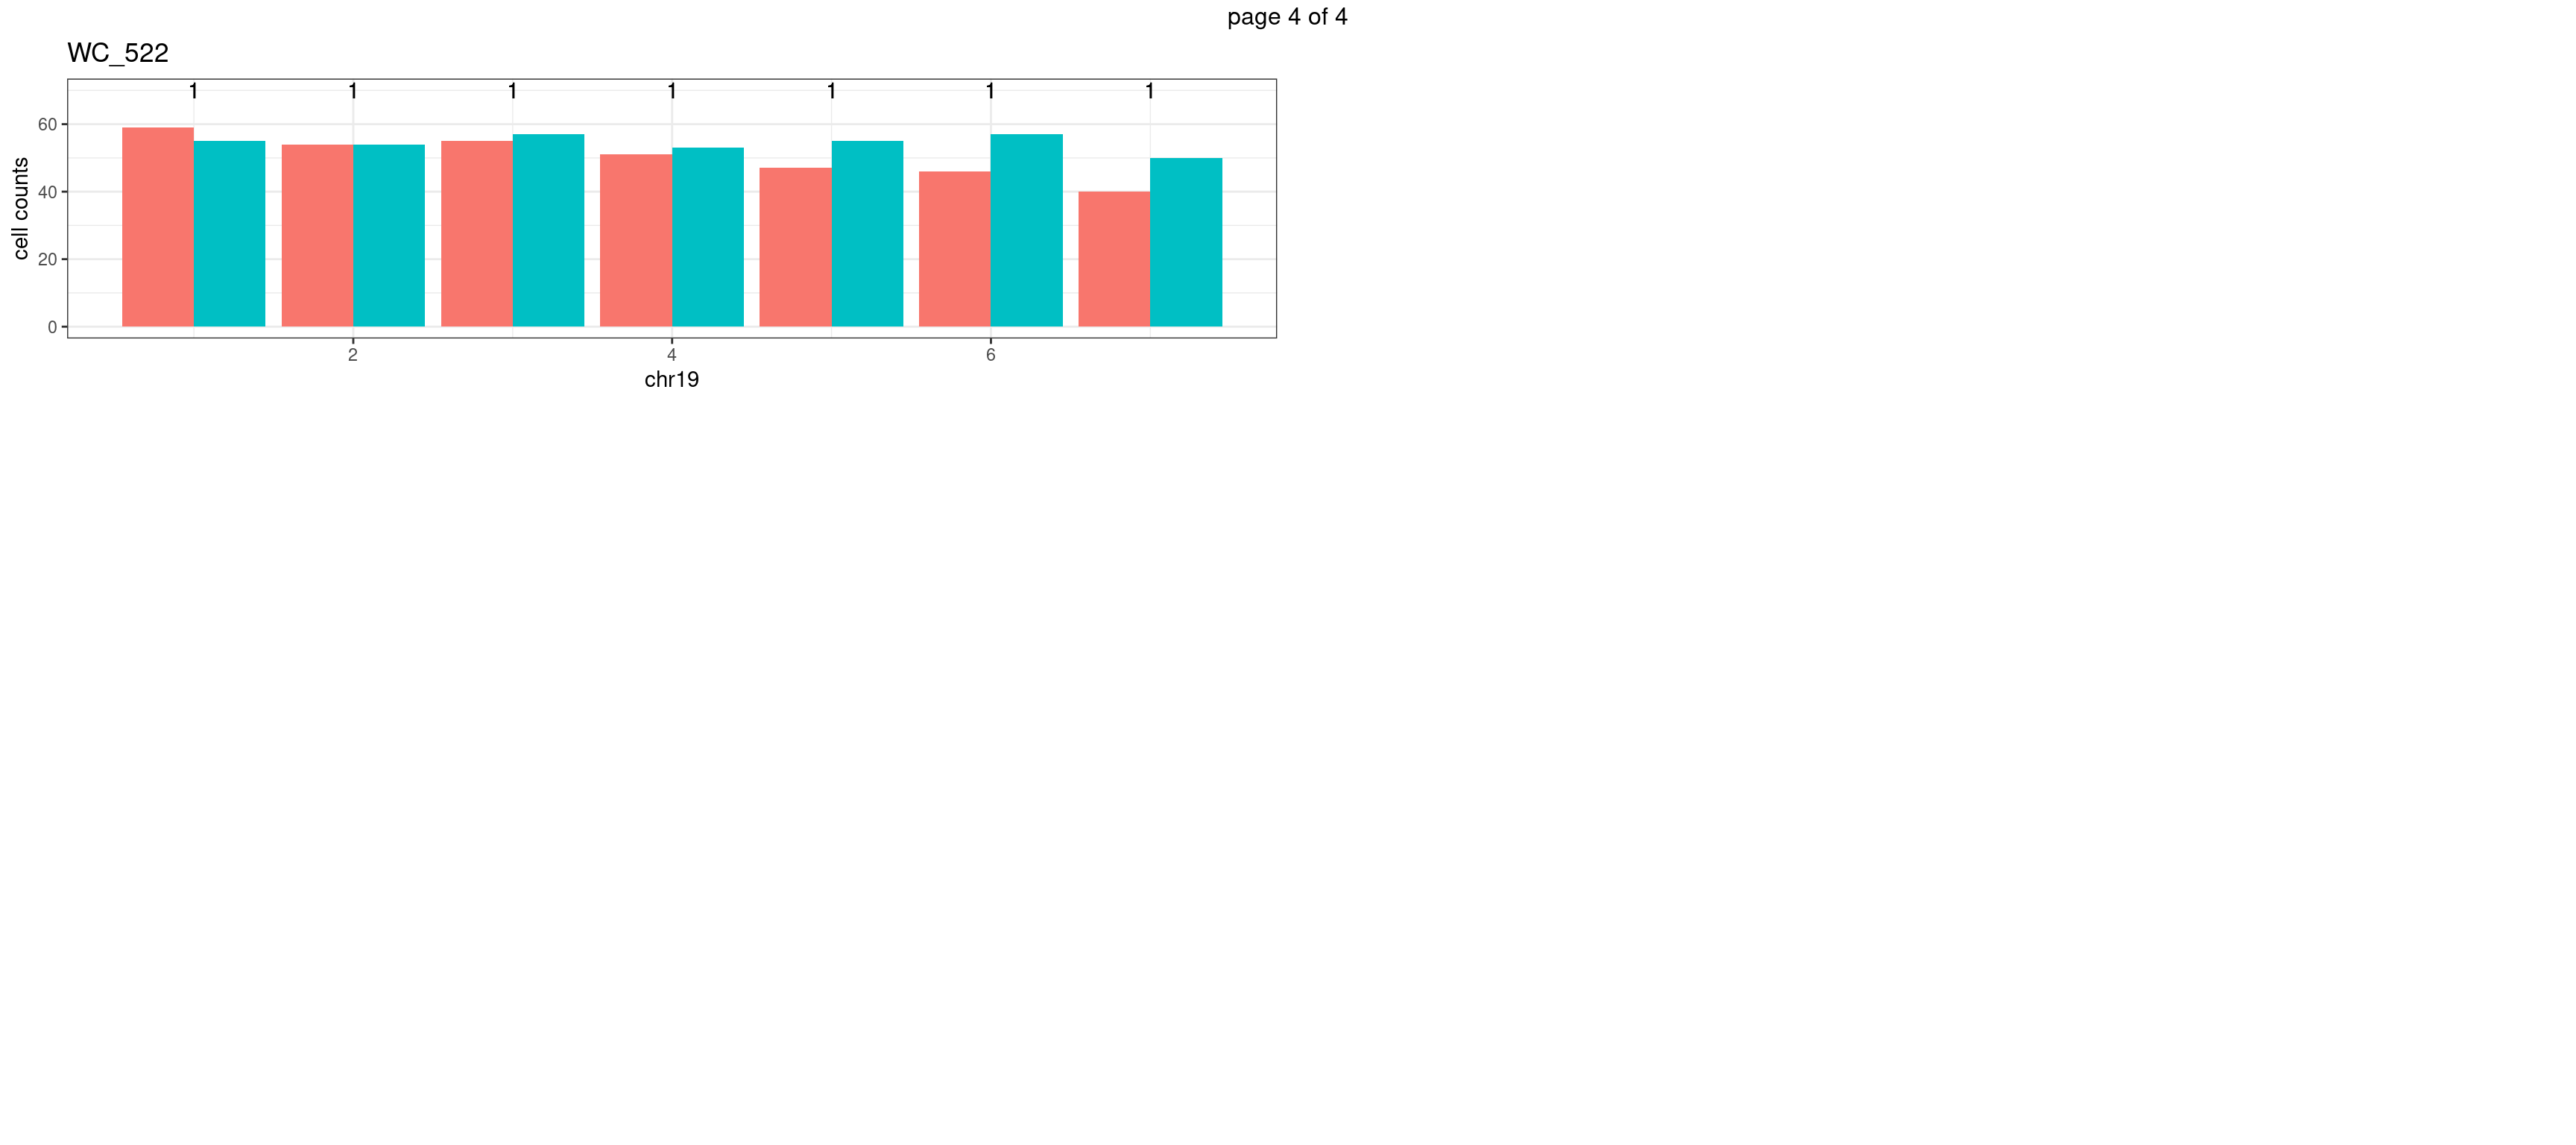
Per sample: WC_522
This is done by taking the crossover results and work backwards to find the state for chromosome bins so that missing markers’ states are imputed. This helps to reduce the unreliable results for staring and ending bins of chromosomes.
Chr1
sampleName <- "WC_522"
chrName <- "chr1"
bin_state_gr <- readRDS(paste0("./output/outputR/analysisRDS/",sampleName,"_",
                          chrName,"bin_state_gr-mar_2022.rds"))
The chromosomes have been binned using size of 1e7.
bin_state_gr[1:4,1:3]GRanges object with 4 ranges and 3 metadata columns:
seqnames ranges strand | TCATTACGTGTGACAG-1 CTAATGGTCCCACAAA-1
<Rle> <IRanges> <Rle> | <character> <character>
[1] chr1 1-9970630 * | s2 s1
[2] chr1 9970631-19941259 * | s2 s1
[3] chr1 19941260-29911888 * | s2 s1
[4] chr1 29911889-39882517 * | s2 s1
TGCGGGTGTATTGAAG-1
<character>
[1] s2
[2] s2
[3] s2
[4] s2
-------
seqinfo: 19 sequences from an unspecified genomedf <- mcols(bin_state_gr)
data.frame(df,check.names = FALSE) %>% dplyr::mutate(bin_id = seq(nrow(df))) %>%
tidyr::pivot_longer(cols = colnames(mcols(bin_state_gr))) %>%
ggplot()+geom_point(aes(y = bin_id, x = name,color = value))+theme_bw()+
theme(axis.text.x = element_blank())Test for any imbalance
Use binomial.test for testing whether proportion is 0.5
s1_counts <- rowSums(data.frame(mcols(bin_state_gr),check.names = F)=="s1",na.rm=T)
s2_counts <- rowSums(data.frame(mcols(bin_state_gr),check.names = F)=="s2",na.rm=T)
bins_pvals <- lapply(seq(s1_counts), function(i){
  btest <- binom.test(c(s1_counts[i],s2_counts[i]))
  btest$p.value
})
plot_df <- data.frame(s1_count = s1_counts,
s2_count = s2_counts,
bin_id = seq(length(bins_pvals)),
biom_pvals = unlist(bins_pvals),
fdr = p.adjust(unlist(bins_pvals),method = "fdr"))plot_df %>% tidyr::pivot_longer(c("s1_count","s2_count")) %>% ggplot() +
geom_bar(aes(x = bin_id, y = value,fill = name),position = "dodge",stat = "identity")+
geom_text(aes(x = bin_id,y=70, label = round(fdr,2)))+
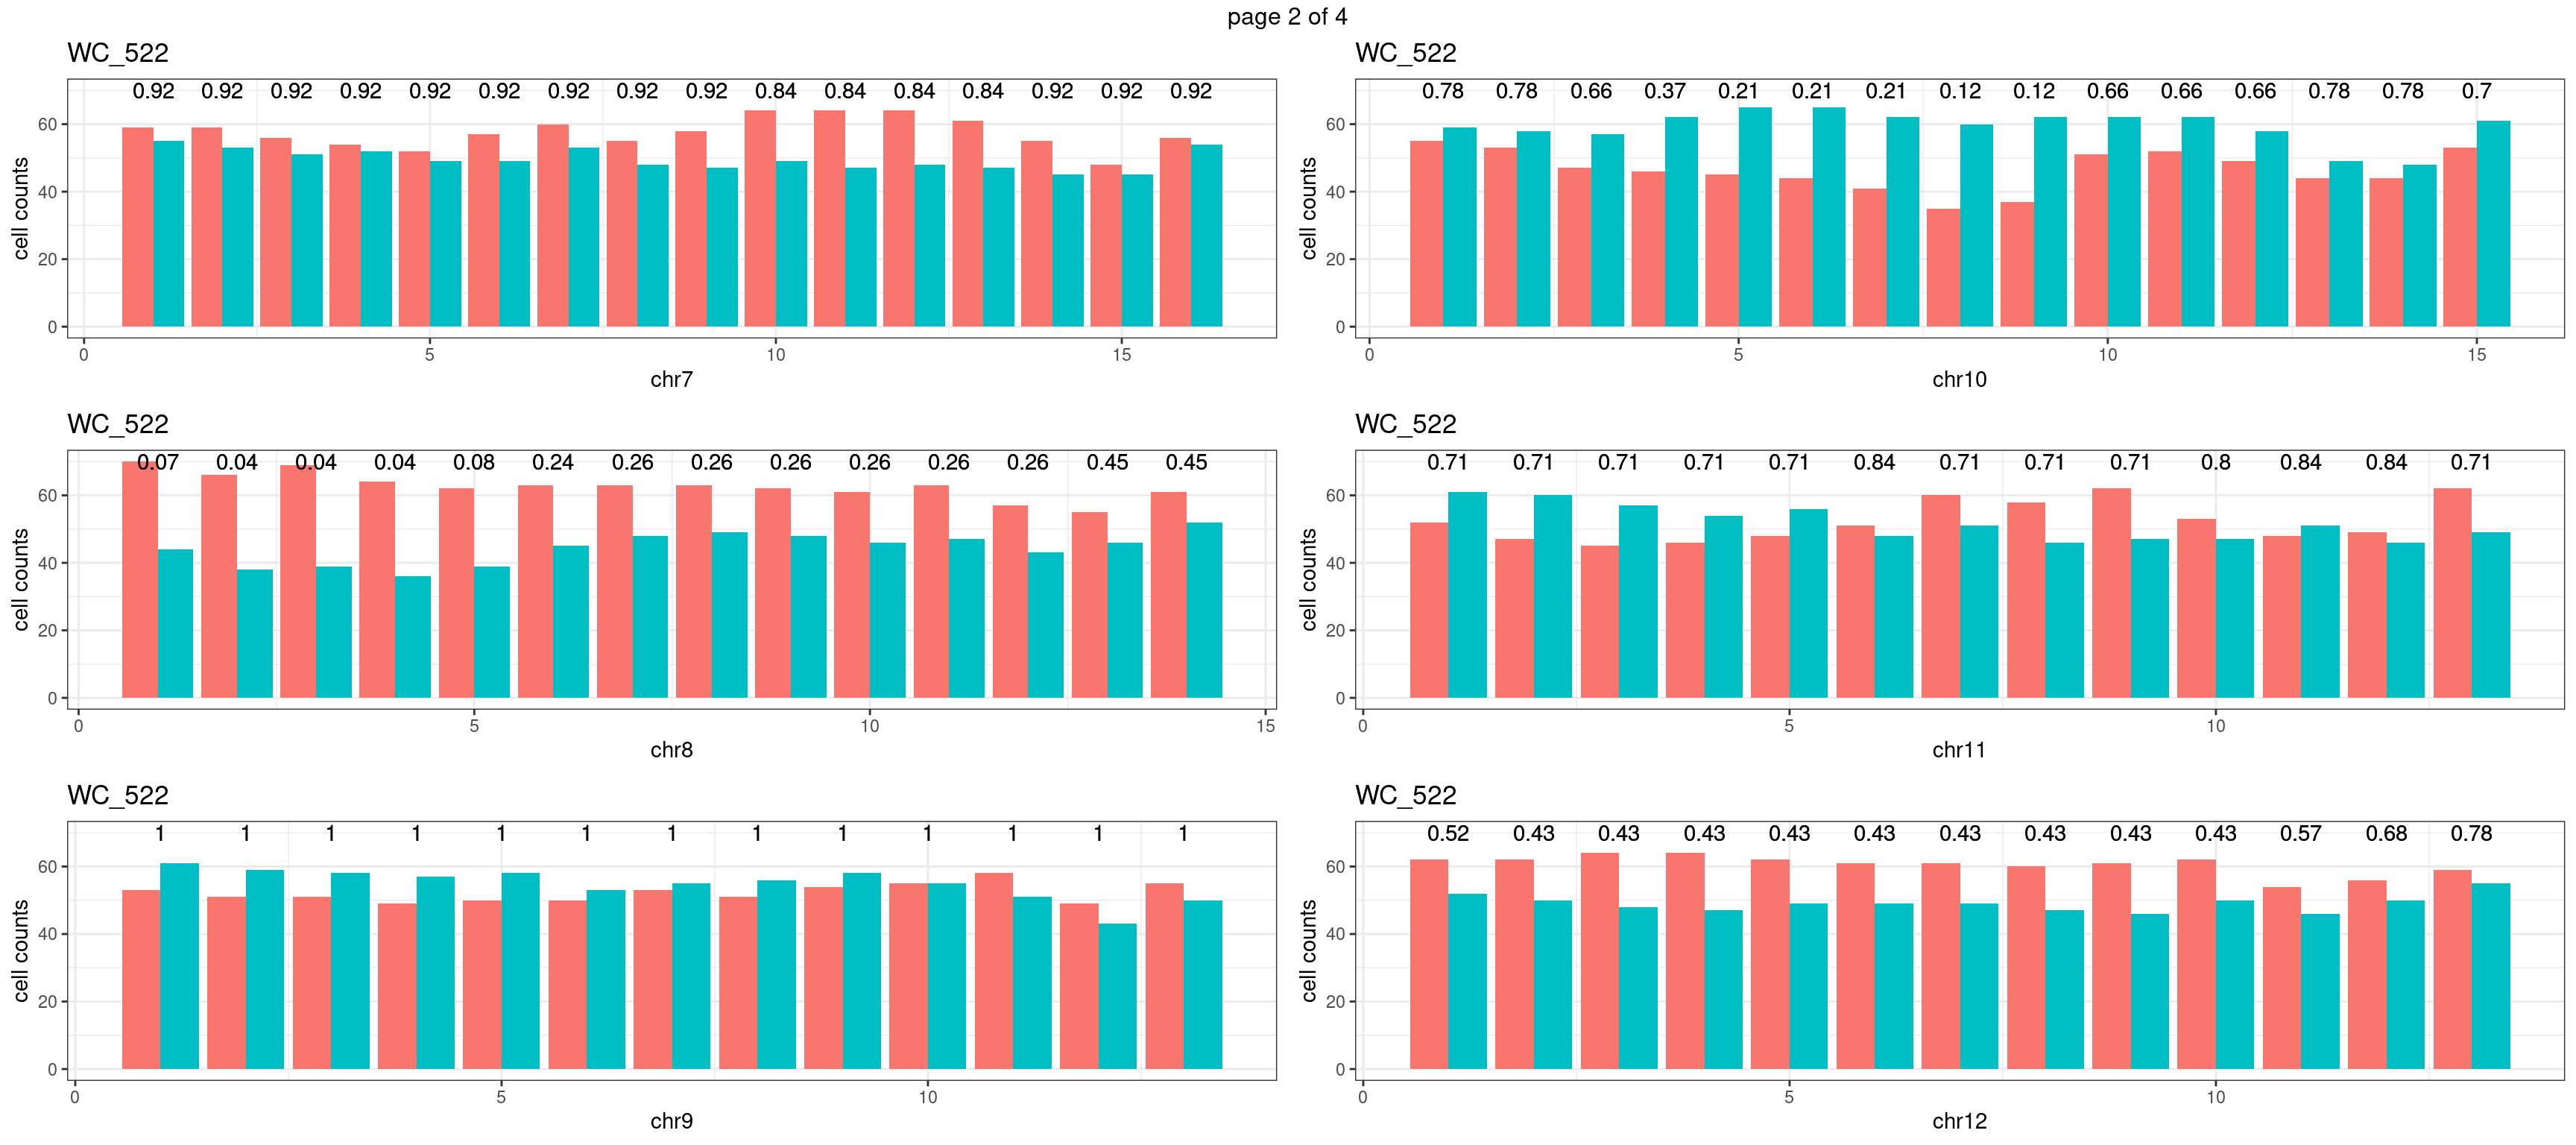
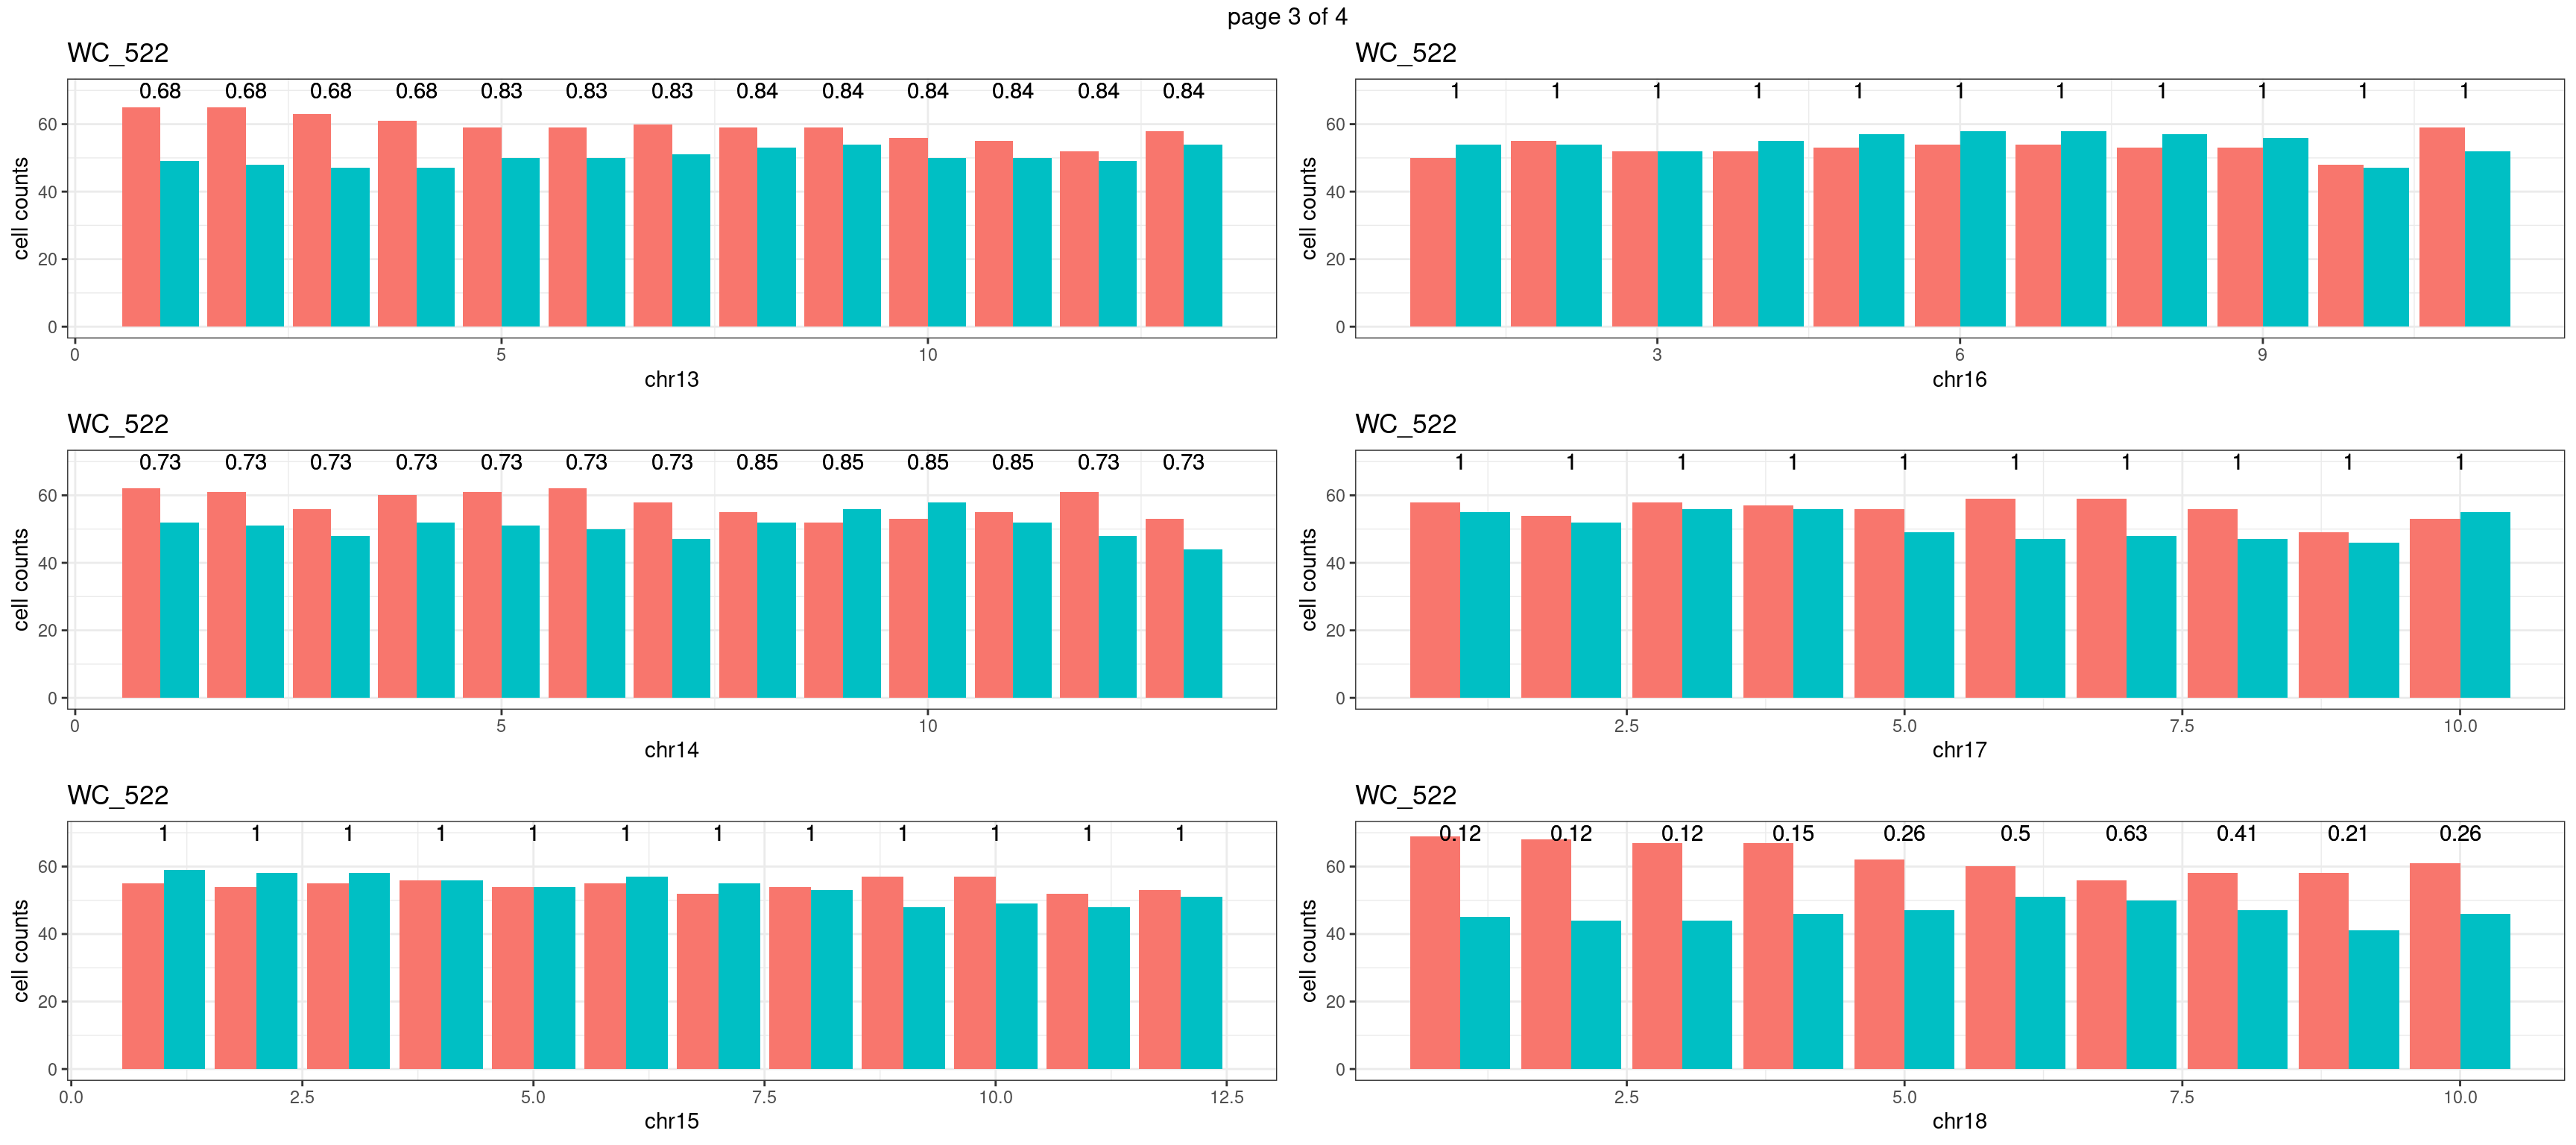
xlab(chrName)+ylab("cell counts")+theme_bw()+ggtitle(sampleName)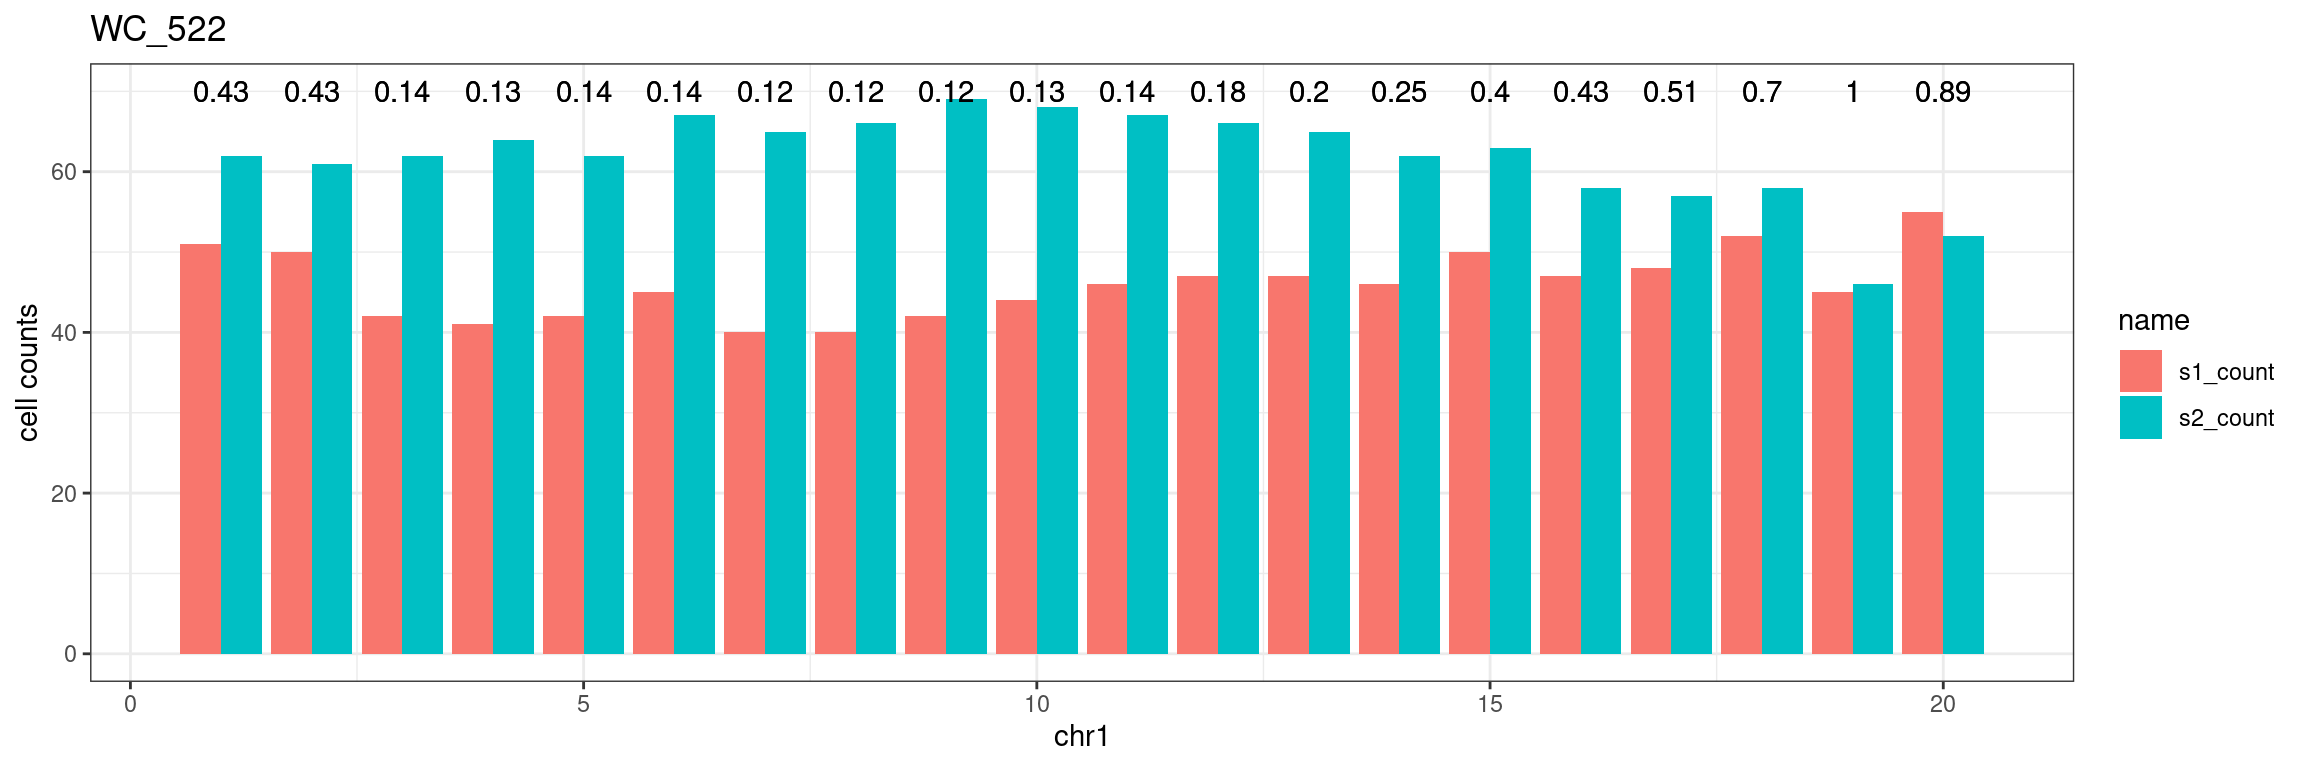 Produce the plots for all chrs
sampleName <- "WC_522"
plots_list <- list()
for(chrName in paste0("chr",1:19)){
bin_state_gr <- readRDS(paste0("./output/outputR/analysisRDS/",sampleName,"_",
chrName,"bin_state_gr-mar_2022.rds"))
s1_counts <- rowSums(data.frame(mcols(bin_state_gr),check.names = F)=="s1",na.rm=T)
s2_counts <- rowSums(data.frame(mcols(bin_state_gr),check.names = F)=="s2",na.rm=T)
bins_pvals <- lapply(seq(s1_counts), function(i){
btest <- binom.test(c(s1_counts[i],s2_counts[i]))
btest$p.value
})
plot_df <- data.frame(s1_count = s1_counts,
                      s2_count = s2_counts,
                      bin_id = seq(length(bins_pvals)),
                      biom_pvals = unlist(bins_pvals),
                      fdr = p.adjust(unlist(bins_pvals),method = "fdr"))
p <- plot_df %>% tidyr::pivot_longer(c("s1_count","s2_count")) %>% ggplot() +
geom_bar(aes(x = bin_id, y = value,fill = name),position = "dodge",
stat = "identity")+
geom_text(aes(x = bin_id,y=70, label = round(fdr,2)))+
xlab(chrName)+ylab("cell counts")+theme_bw()+ggtitle(sampleName)
plots_list[[chrName]] <- p+guides(fill = "none" )
} mChrThresPlots <- marrangeGrob(plots_list, nrow=3, ncol=2)
mChrThresPlots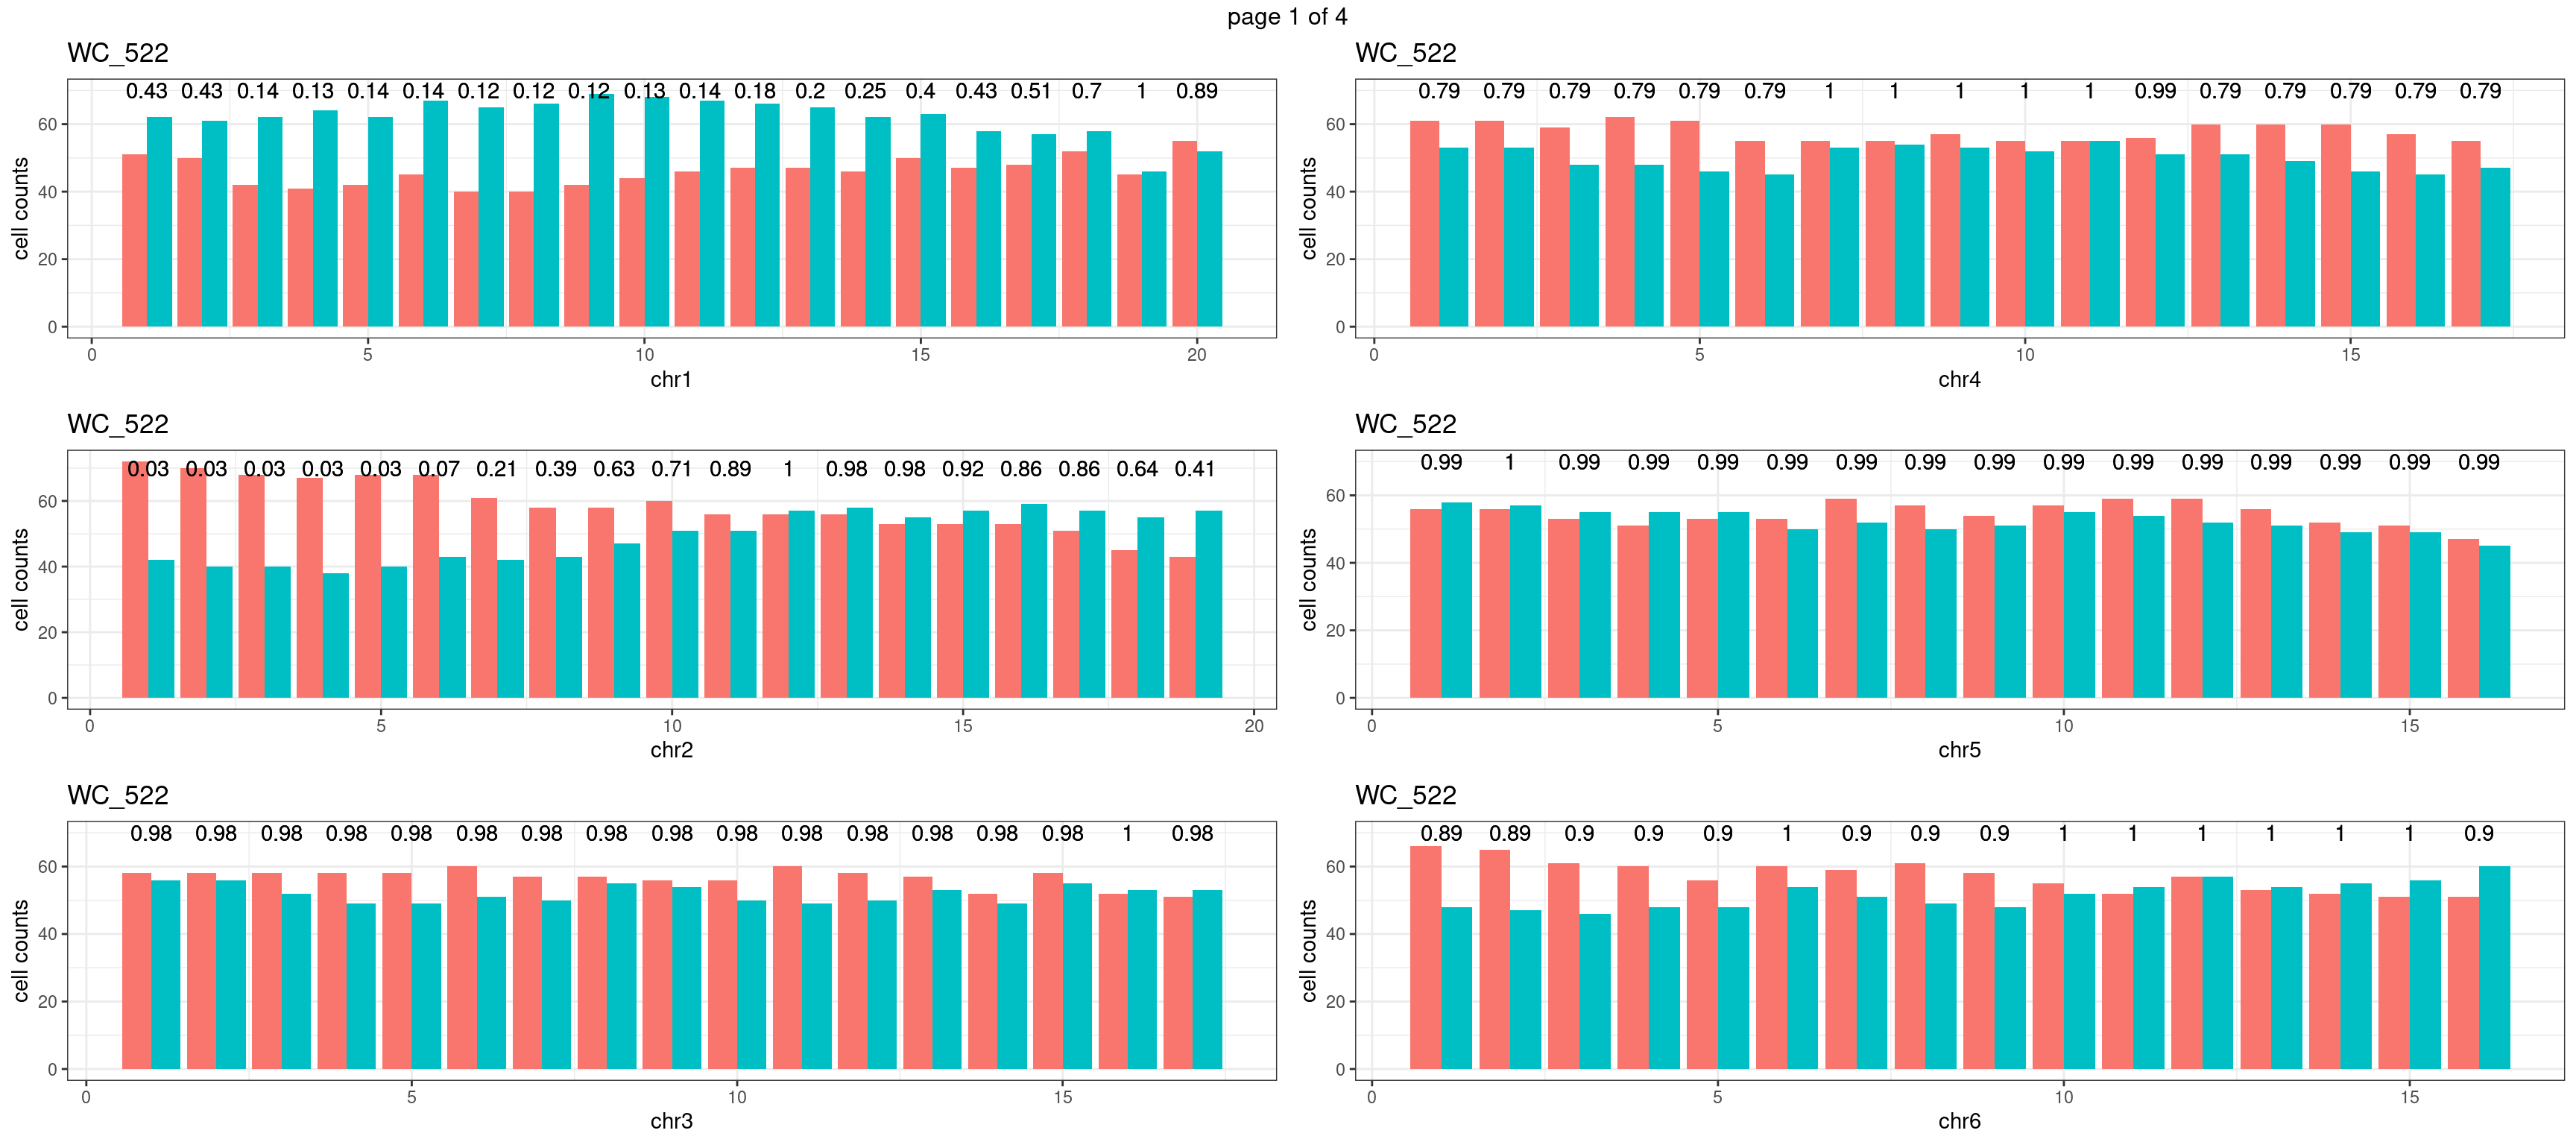
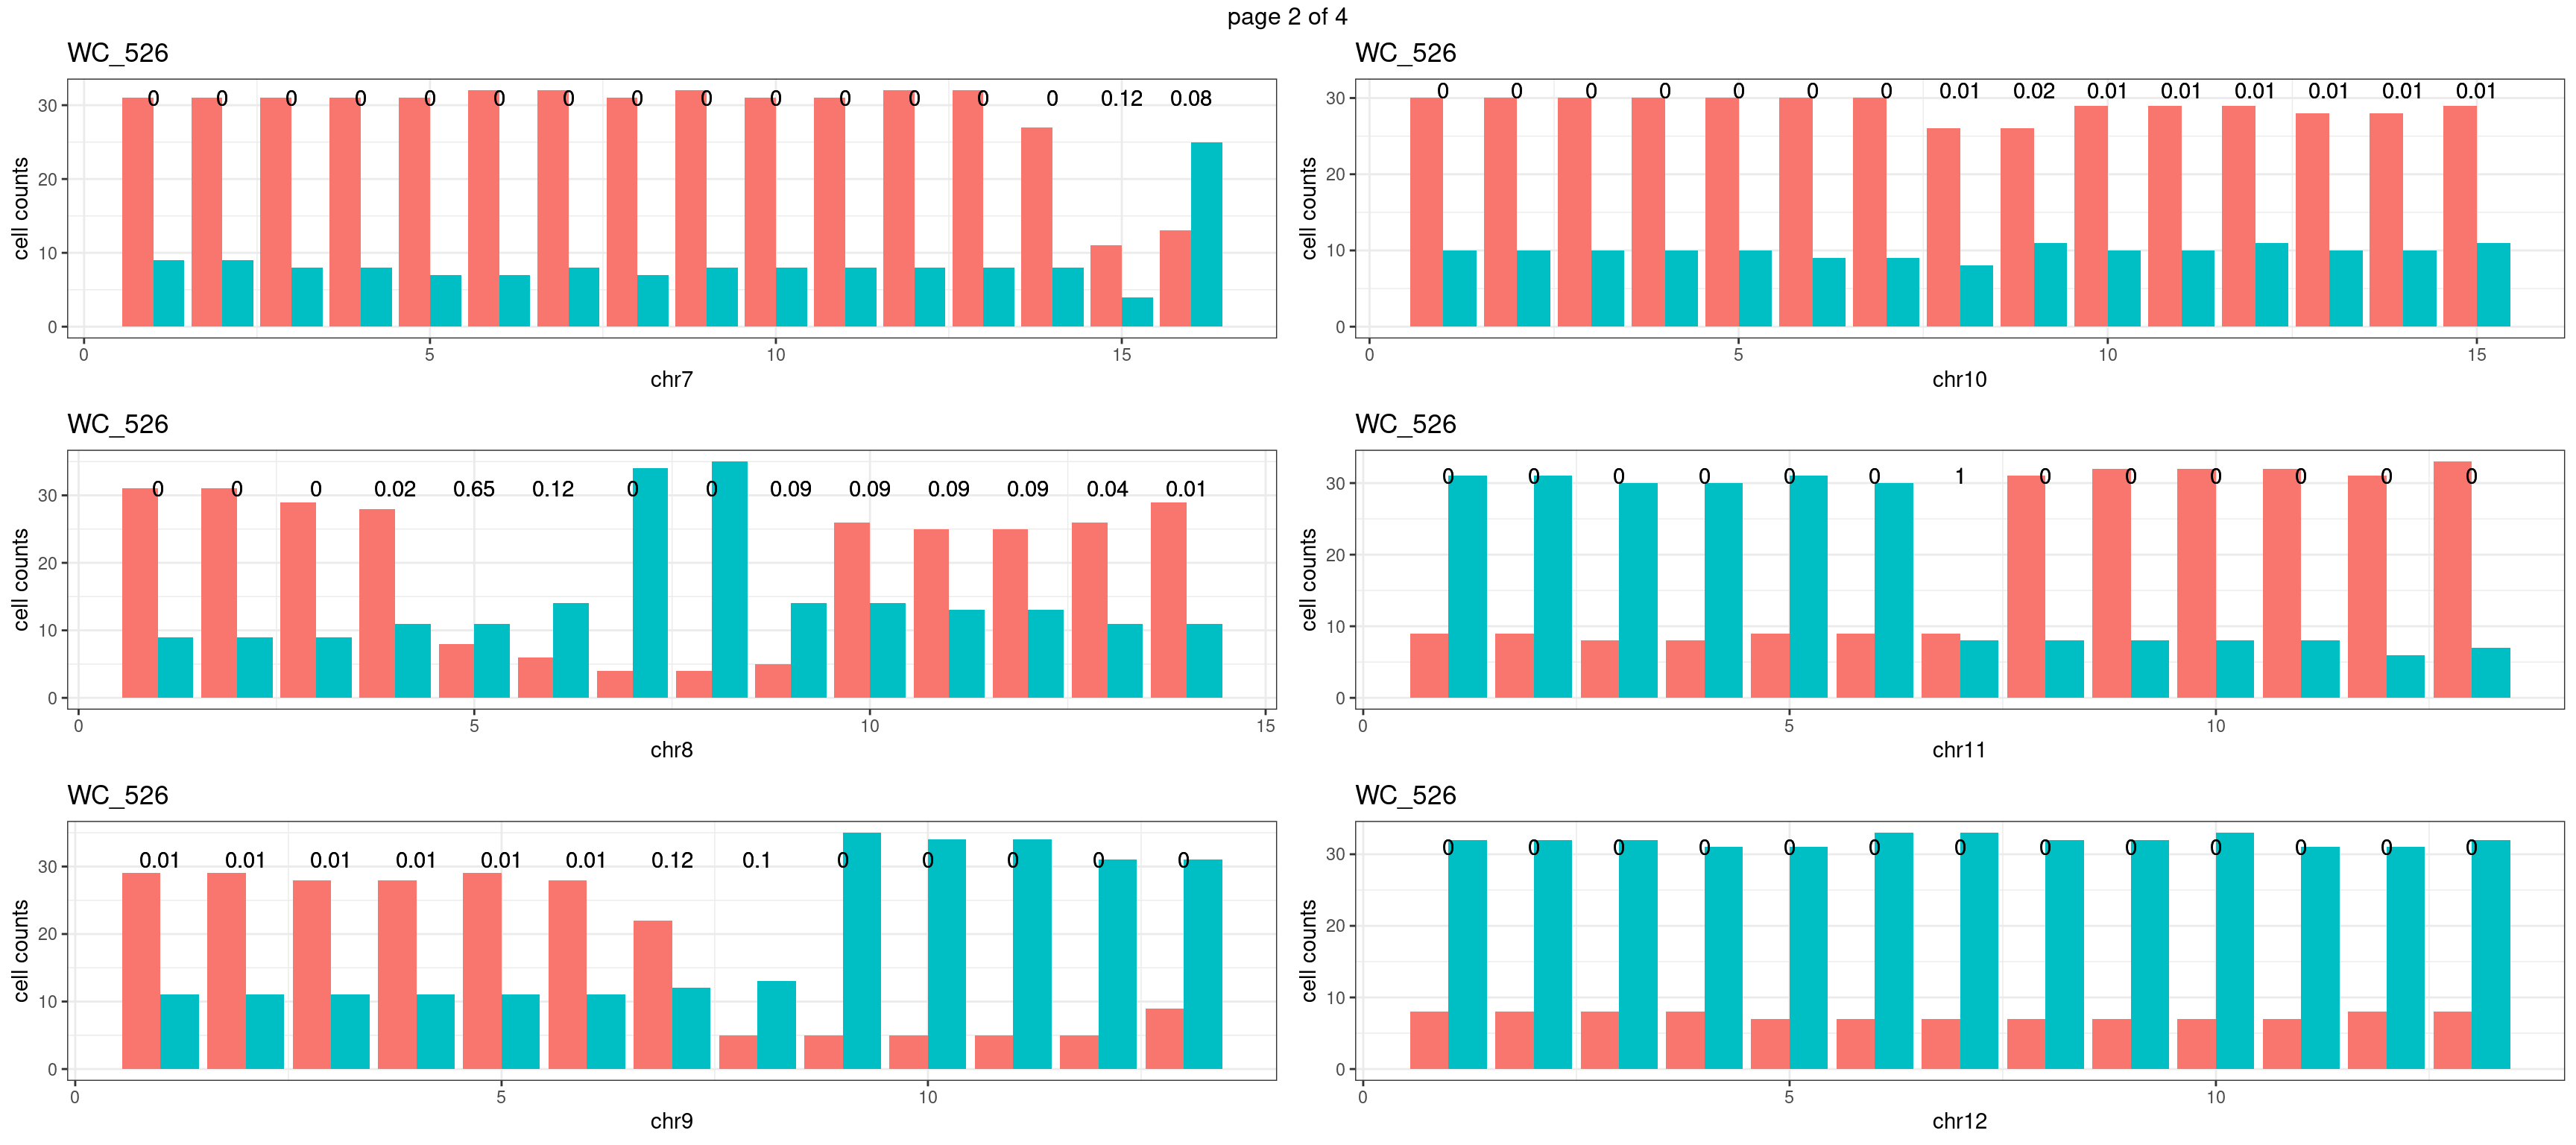
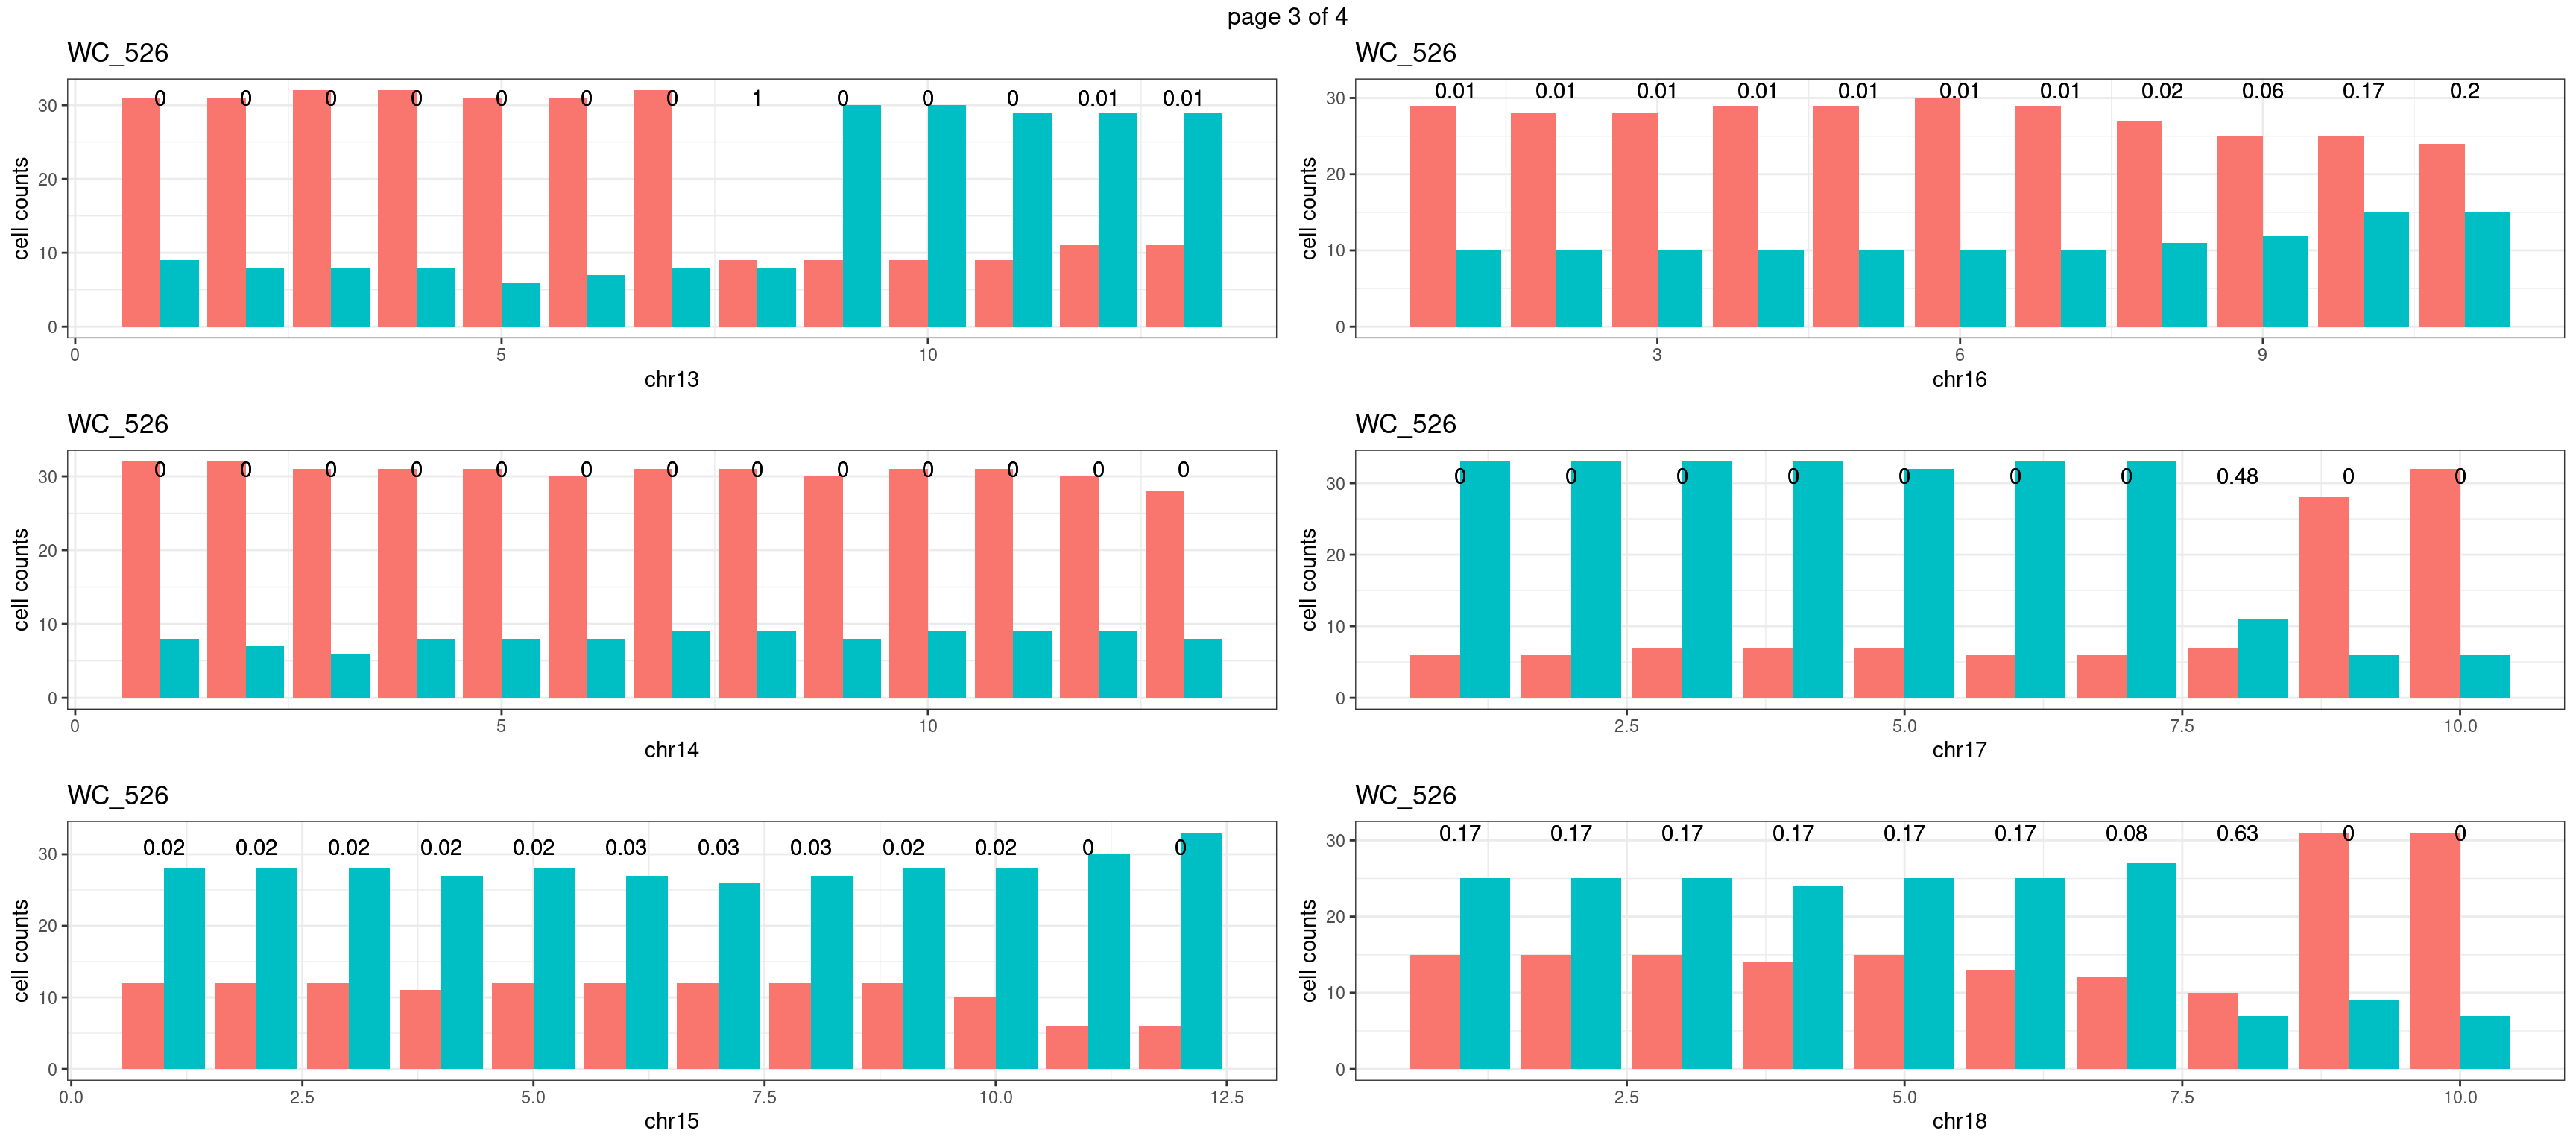
WC_526
sampleName <- "WC_526"
plots_list <- list()
for(chrName in paste0("chr",1:19)){
  bin_state_gr <- readRDS(paste0("./output/outputR/analysisRDS/",sampleName,"_",
                          chrName,"bin_state_gr-mar_2022.rds"))

s1_counts <- rowSums(data.frame(mcols(bin_state_gr),check.names = F)=="s1",na.rm=T)
s2_counts <- rowSums(data.frame(mcols(bin_state_gr),check.names = F)=="s2",na.rm=T)
bins_pvals <- lapply(seq(s1_counts), function(i){
  btest <- binom.test(c(s1_counts[i],s2_counts[i]))
  btest$p.value
})

plot_df <- data.frame(s1_count = s1_counts,
                      s2_count = s2_counts,
                      bin_id = seq(length(bins_pvals)),
                      biom_pvals = unlist(bins_pvals),
                      fdr = p.adjust(unlist(bins_pvals),method = "fdr"))

p <- plot_df %>% tidyr::pivot_longer(c("s1_count","s2_count")) %>% ggplot() +
  geom_bar(aes(x = bin_id, y = value,fill = name),position = "dodge",
           stat = "identity")+
  geom_text(aes(x = bin_id,y=max(c(s1_counts,s2_counts)), label = round(fdr,2)))+
  xlab(chrName)+ylab("cell counts")+theme_bw()+ggtitle(sampleName)
plots_list[[chrName]] <- p+guides(fill = "none" )
}
mChrThresPlots <- marrangeGrob(plots_list, nrow=3, ncol=2)
mChrThresPlots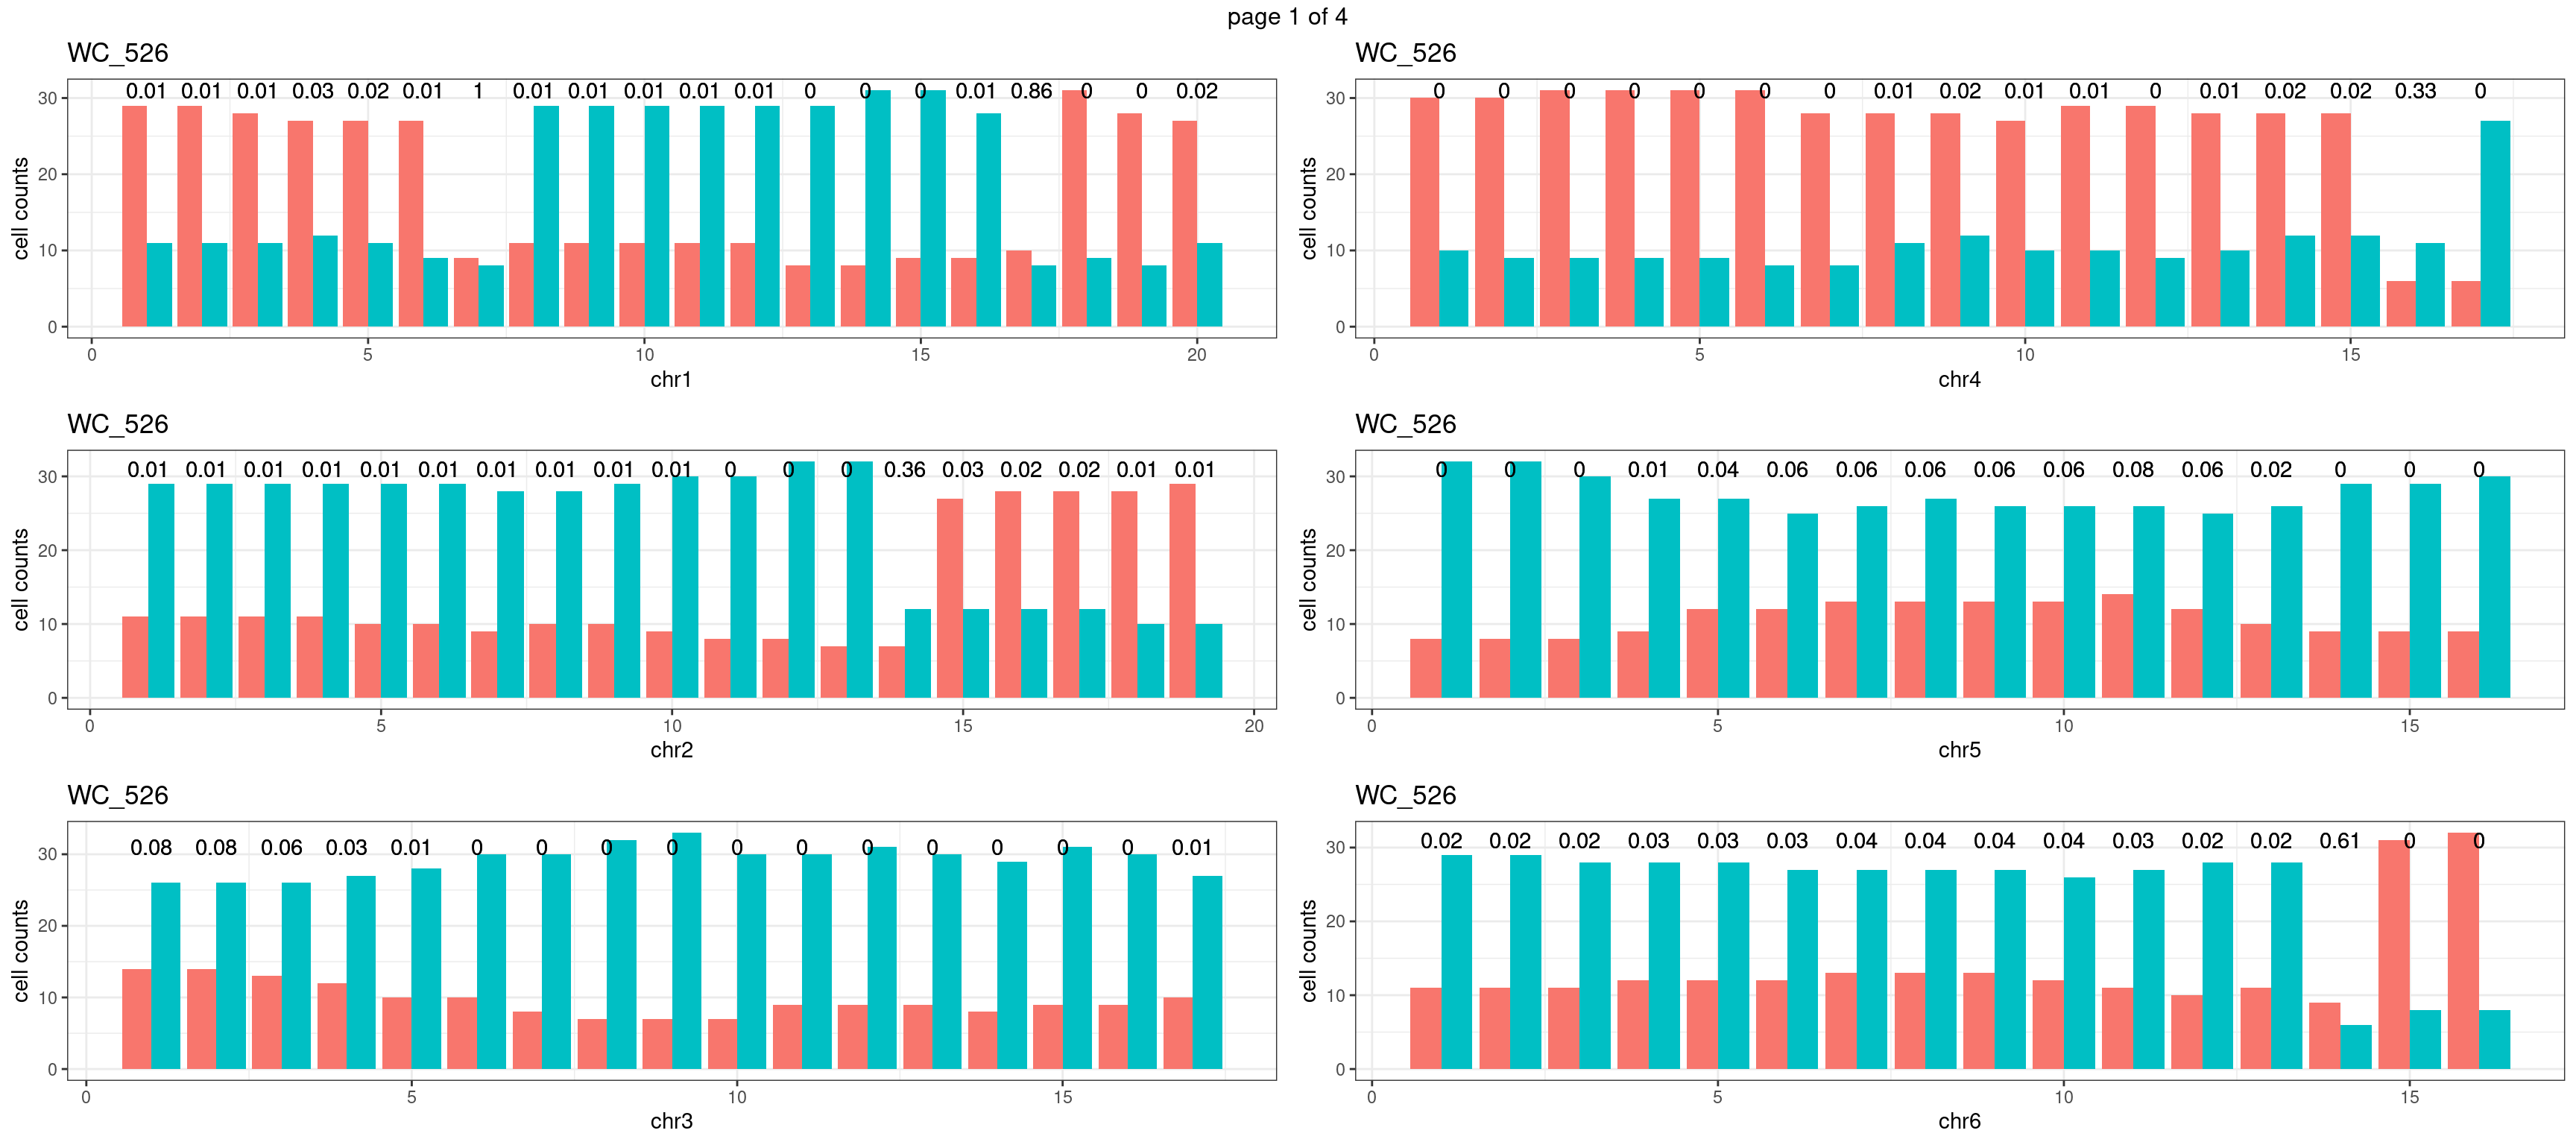
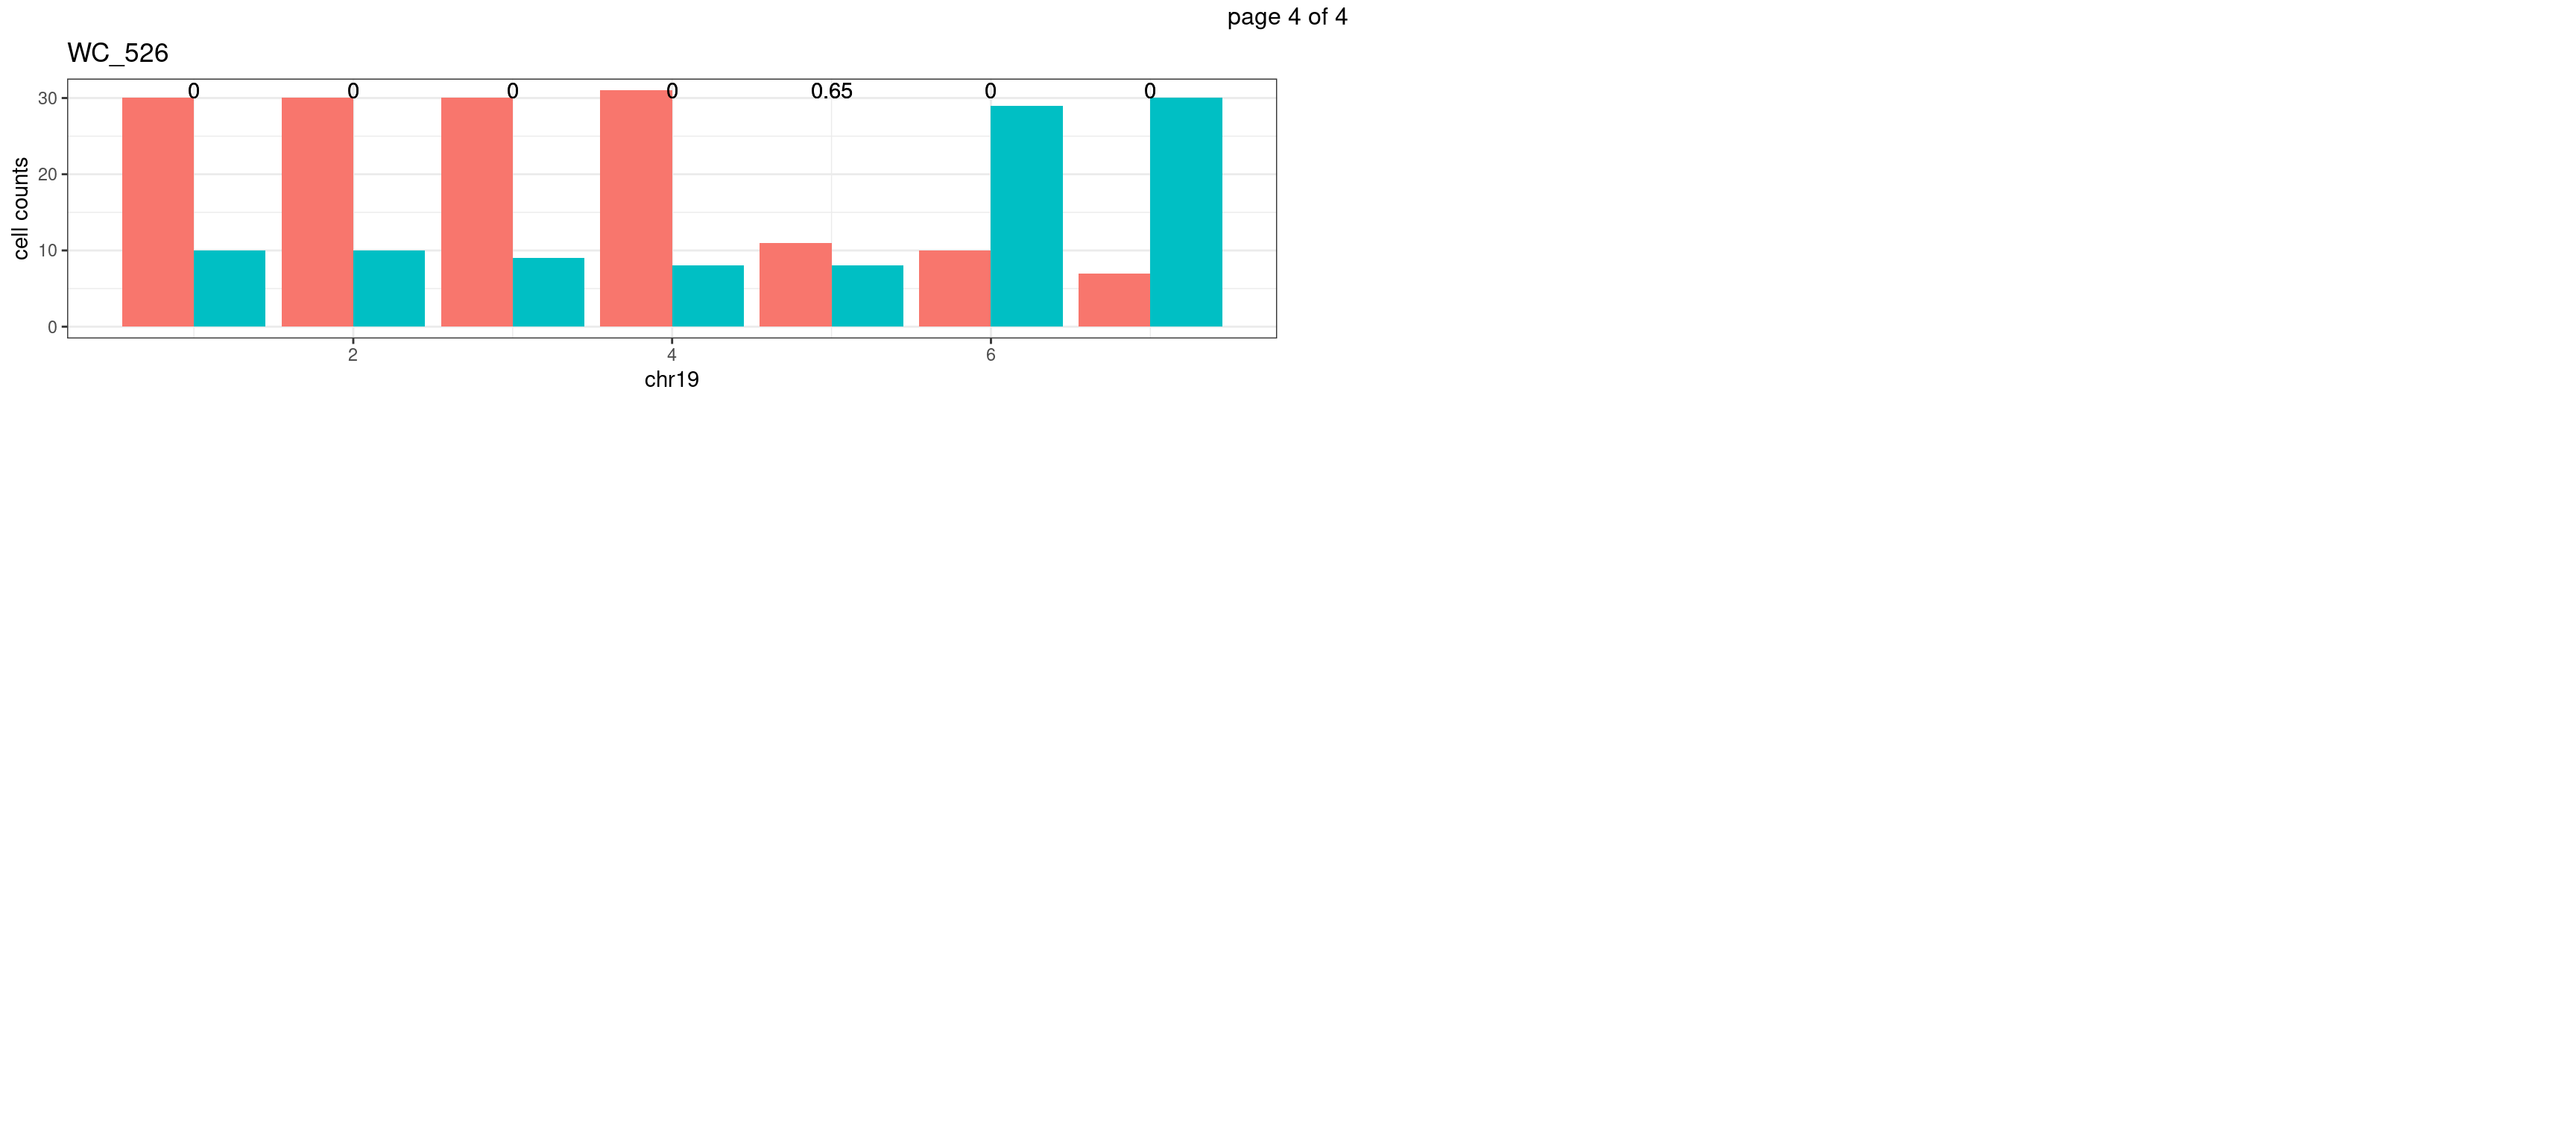
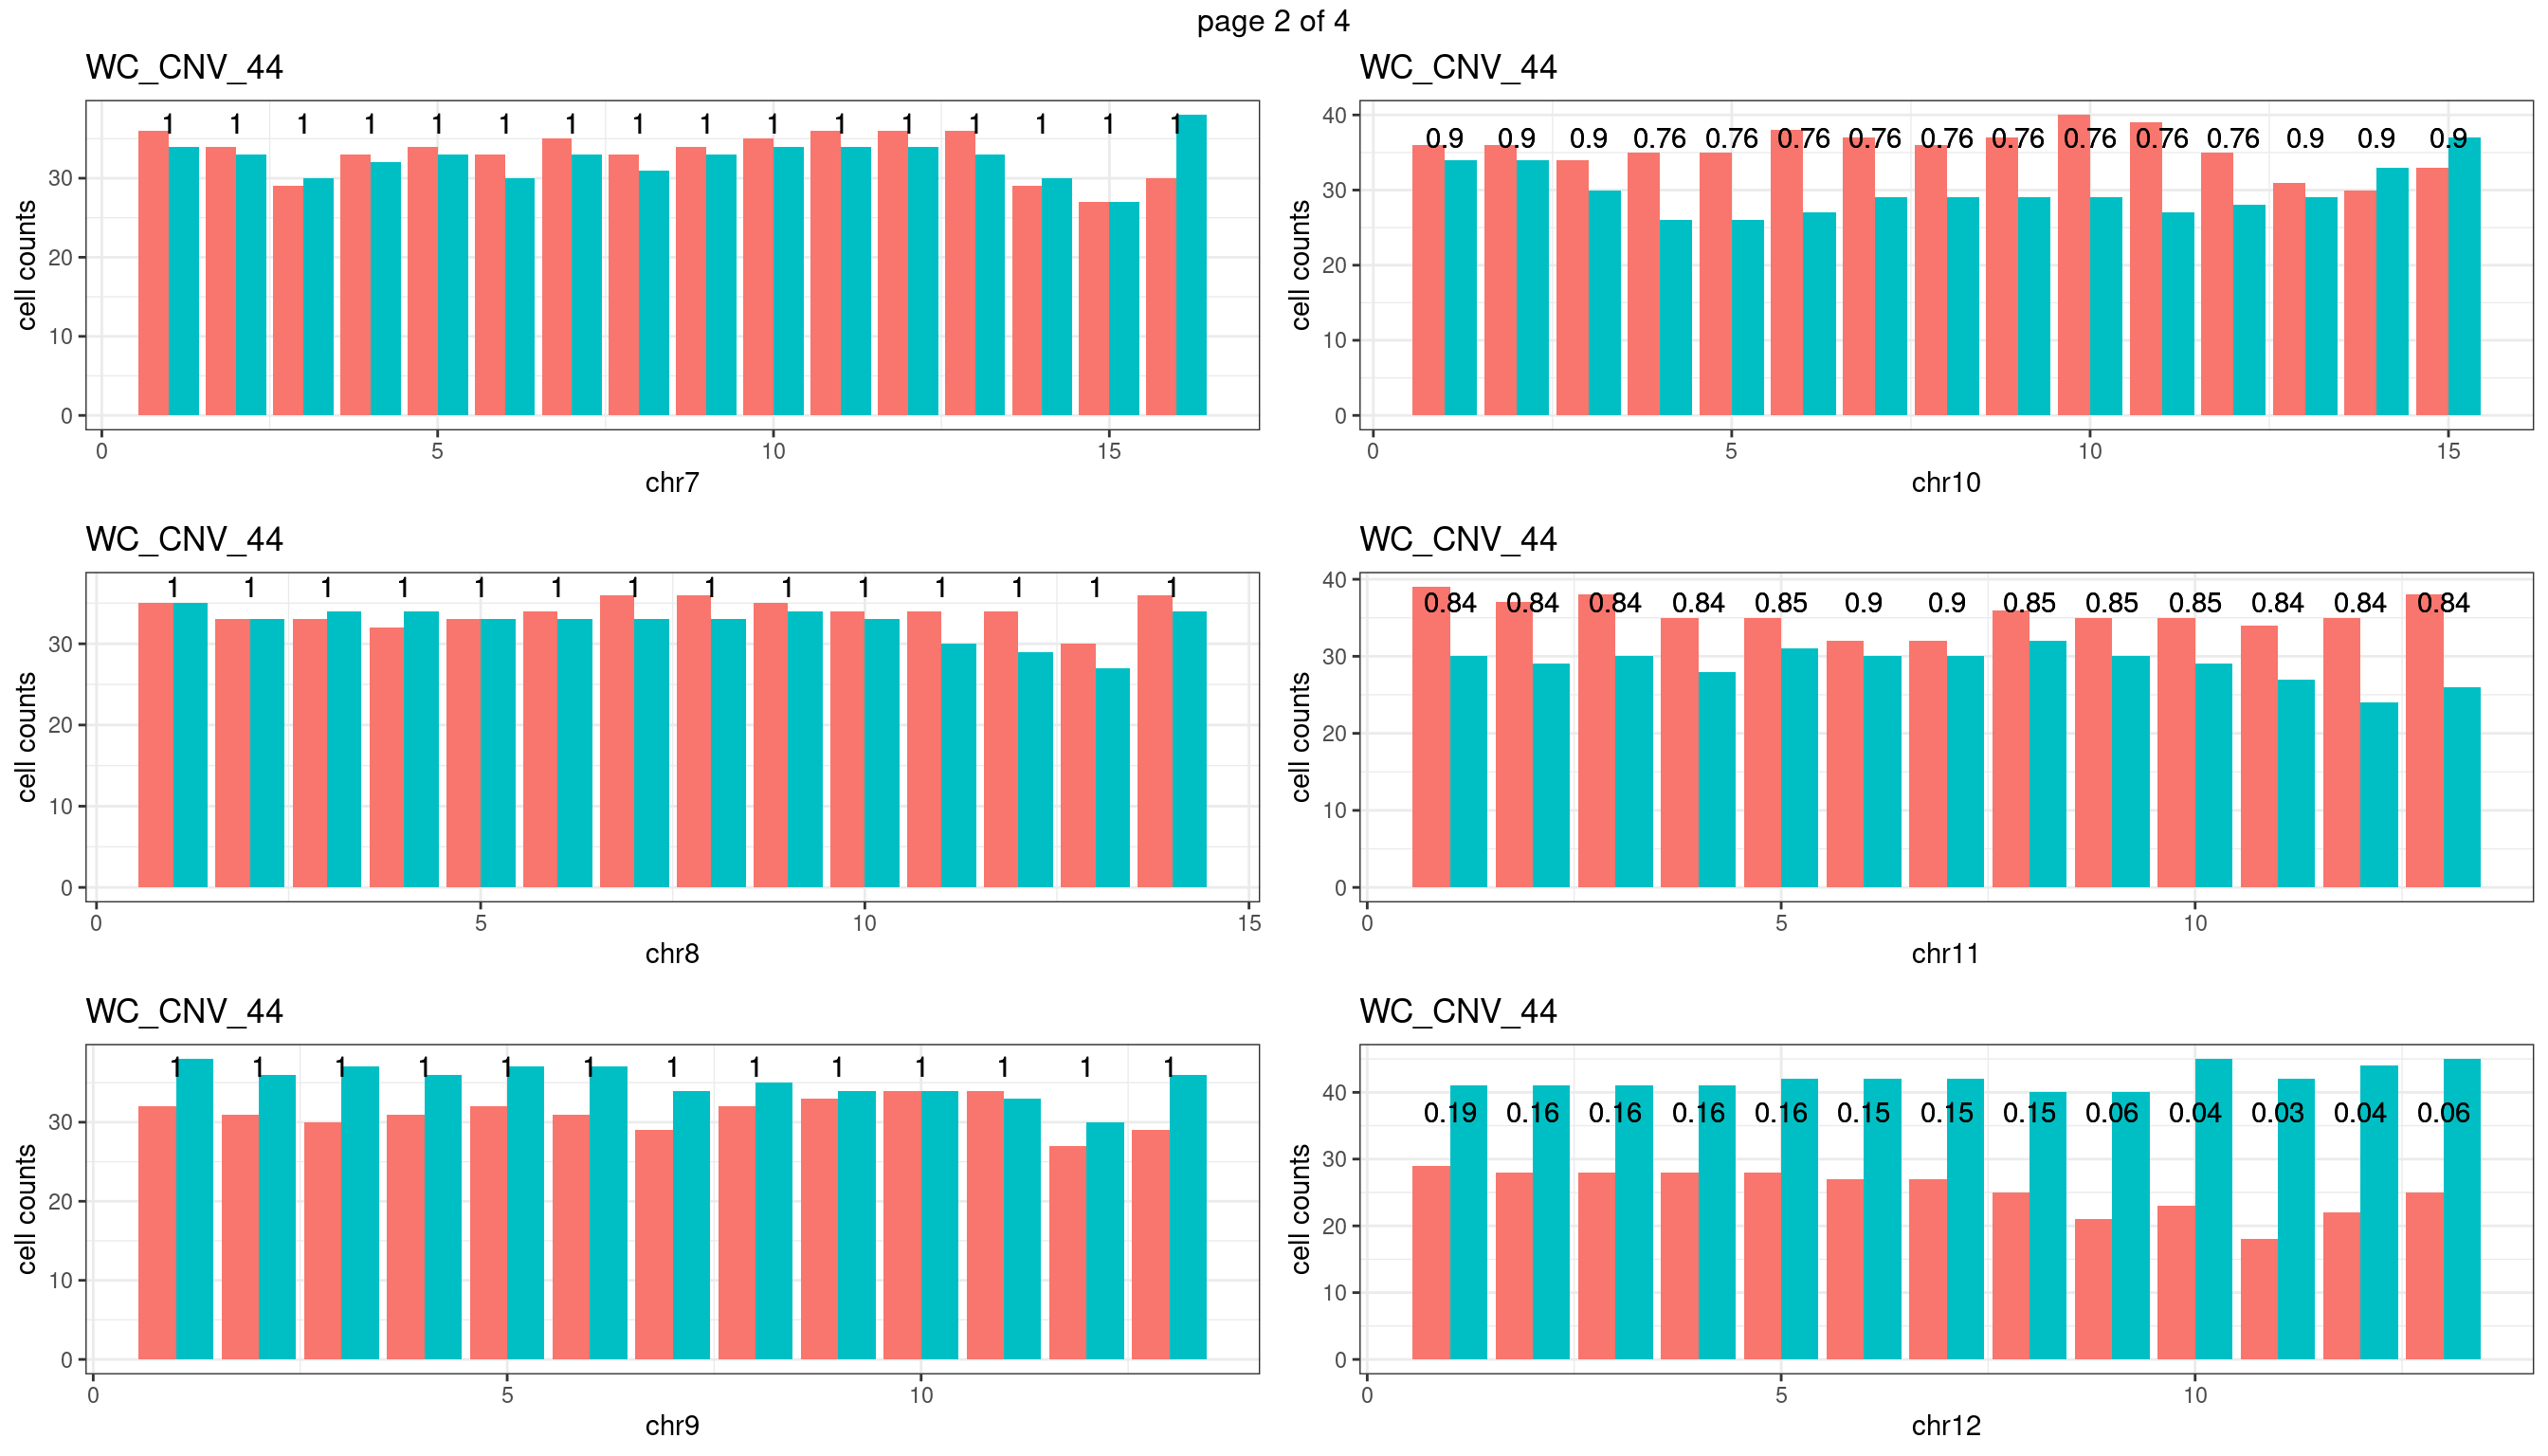
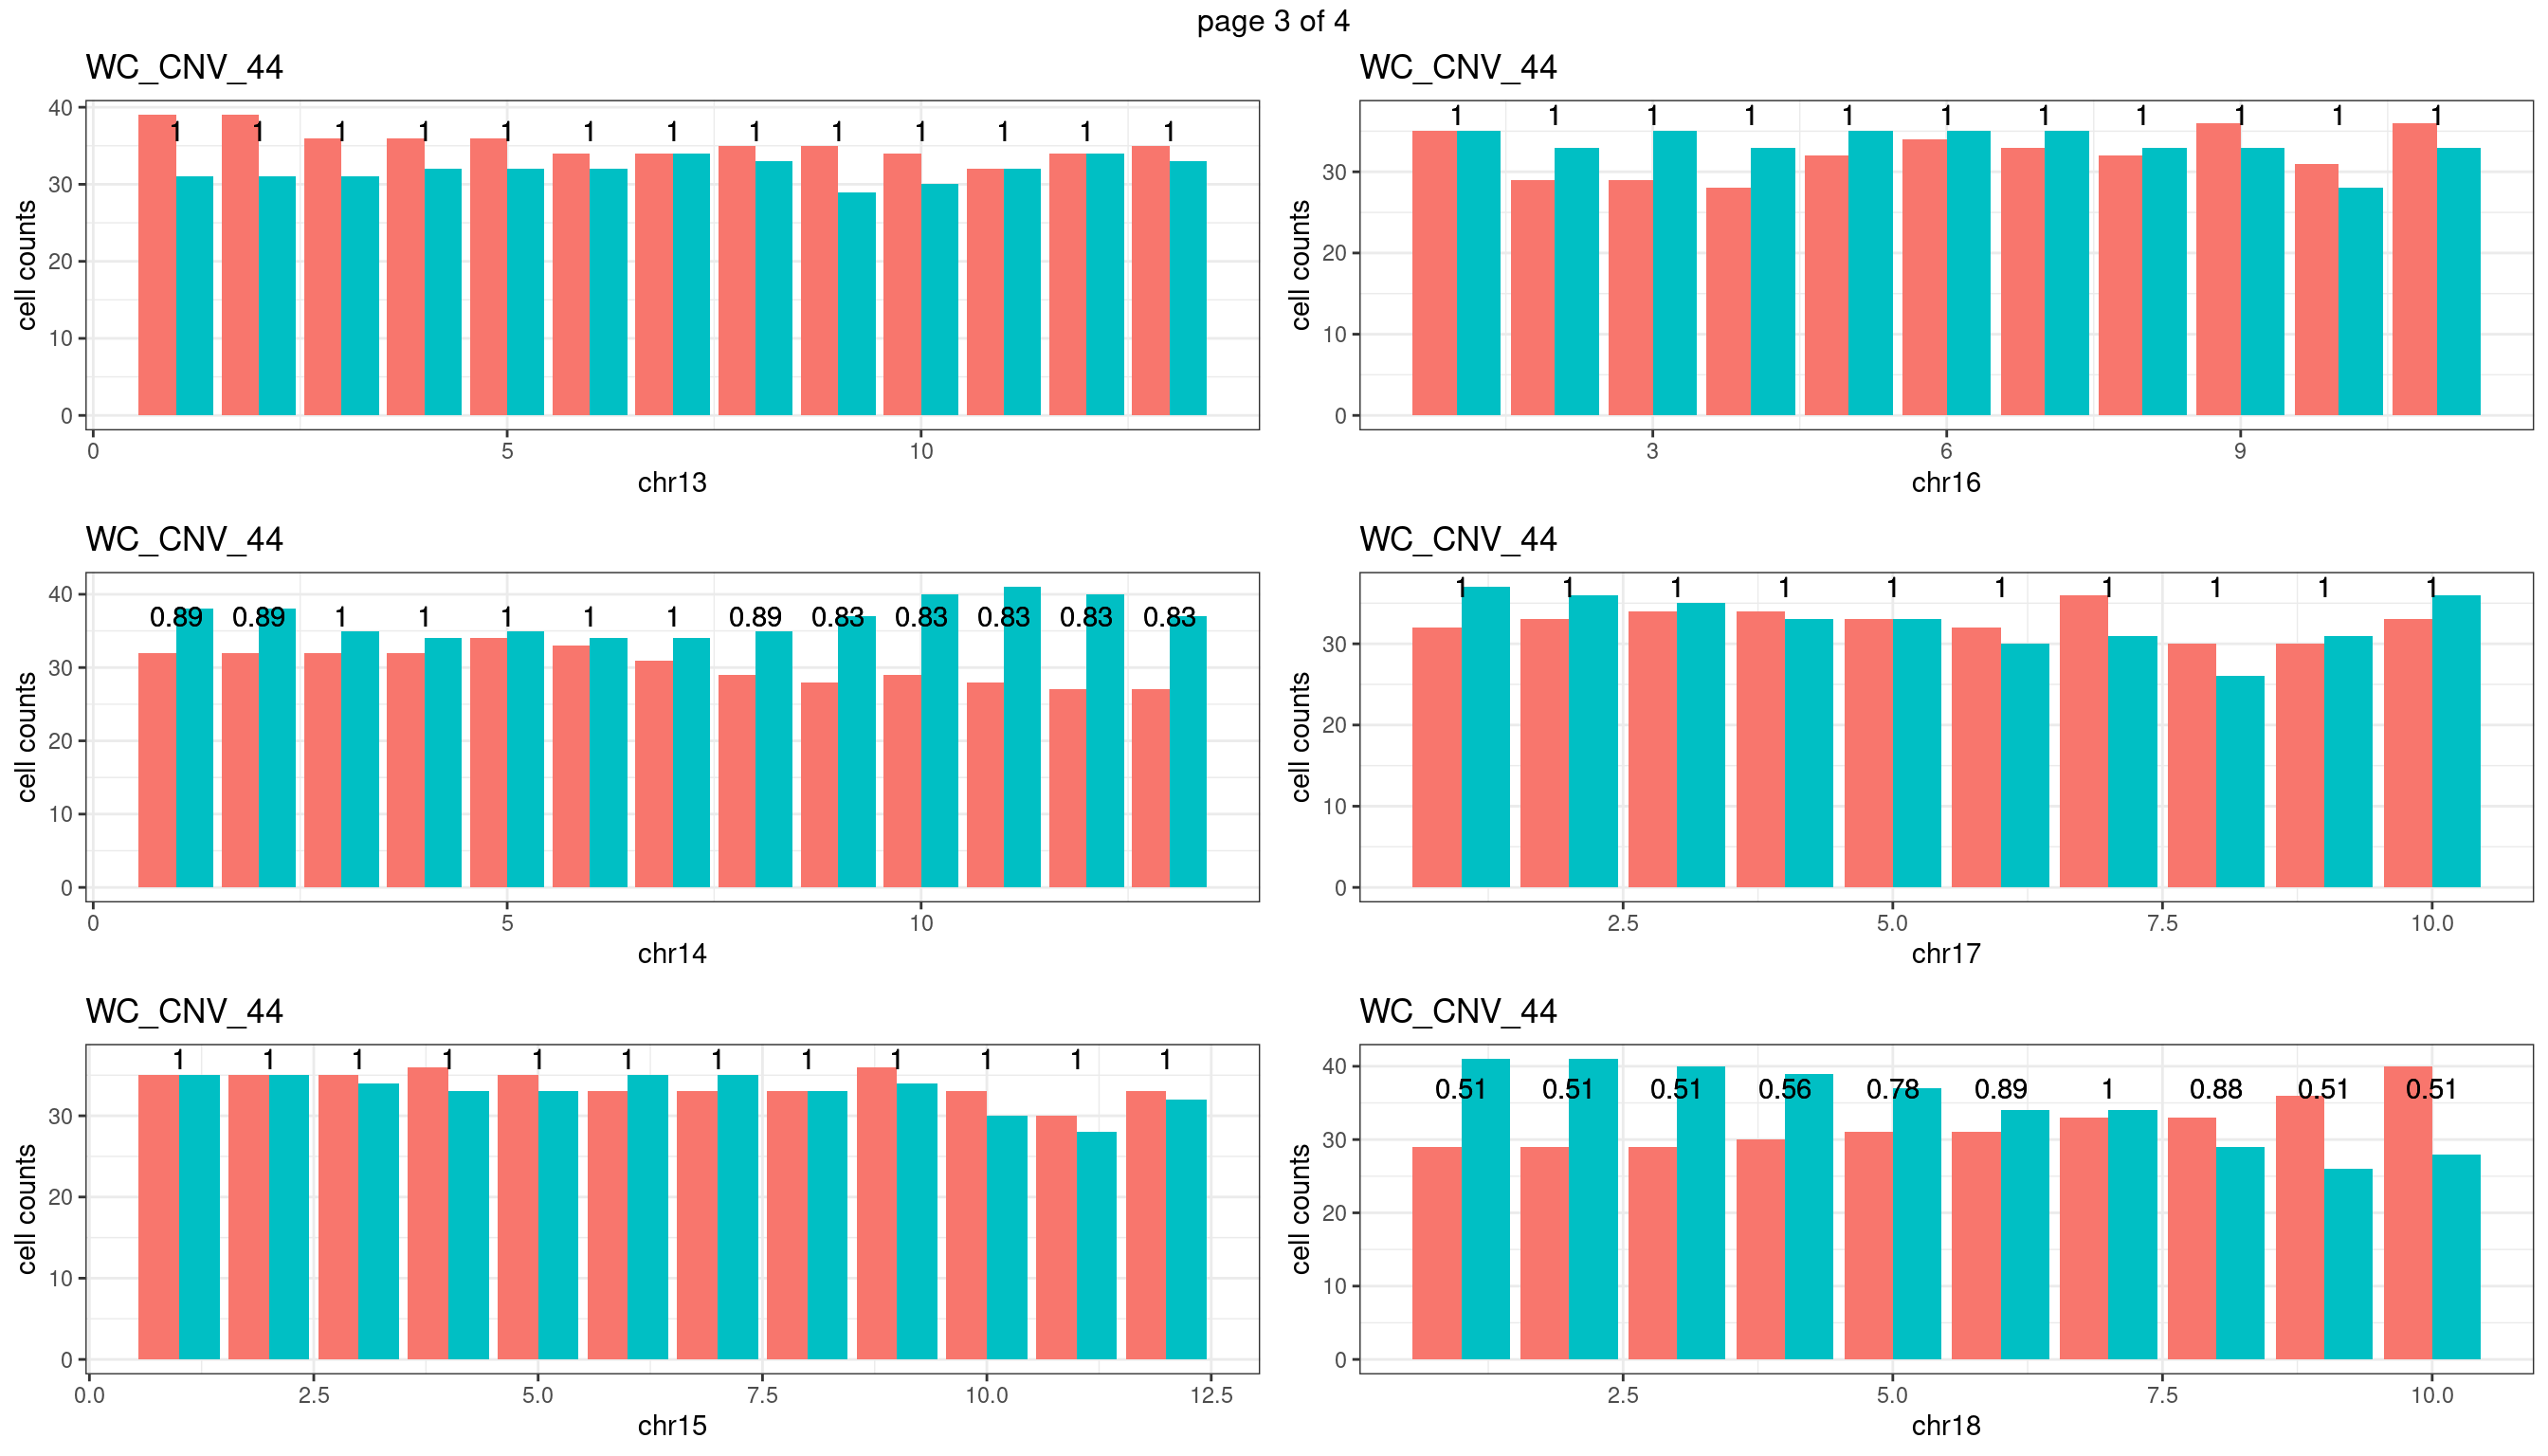
WC_CNV_44
Produce the plots for all chrs
sampleName <- "WC_CNV_44"
plots_list <- list()
for(chrName in paste0("chr",1:19)){
  bin_state_gr <- readRDS(paste0("./output/outputR/analysisRDS/",sampleName,"_",
                          chrName,"bin_state_gr-mar_2022.rds"))

s1_counts <- rowSums(data.frame(mcols(bin_state_gr),check.names = F)=="s1",na.rm=T)
s2_counts <- rowSums(data.frame(mcols(bin_state_gr),check.names = F)=="s2",na.rm=T)
bins_pvals <- lapply(seq(s1_counts), function(i){
  btest <- binom.test(c(s1_counts[i],s2_counts[i]))
  btest$p.value
})

plot_df <- data.frame(s1_count = s1_counts,
                      s2_count = s2_counts,
                      bin_id = seq(length(bins_pvals)),
                      biom_pvals = unlist(bins_pvals),
                      fdr = p.adjust(unlist(bins_pvals),method = "fdr"))

p <- plot_df %>% tidyr::pivot_longer(c("s1_count","s2_count")) %>% ggplot() +
  geom_bar(aes(x = bin_id, y = value,fill = name),position = "dodge",
           stat = "identity")+
  geom_text(aes(x = bin_id,y=max(c(s1_counts,s2_counts)), label = round(fdr,2)))+
  xlab(chrName)+ylab("cell counts")+theme_bw()+ggtitle(sampleName)
plots_list[[chrName]] <- p+guides(fill = "none" )
}
mChrThresPlots <- marrangeGrob(plots_list, nrow=3, ncol=2)
mChrThresPlots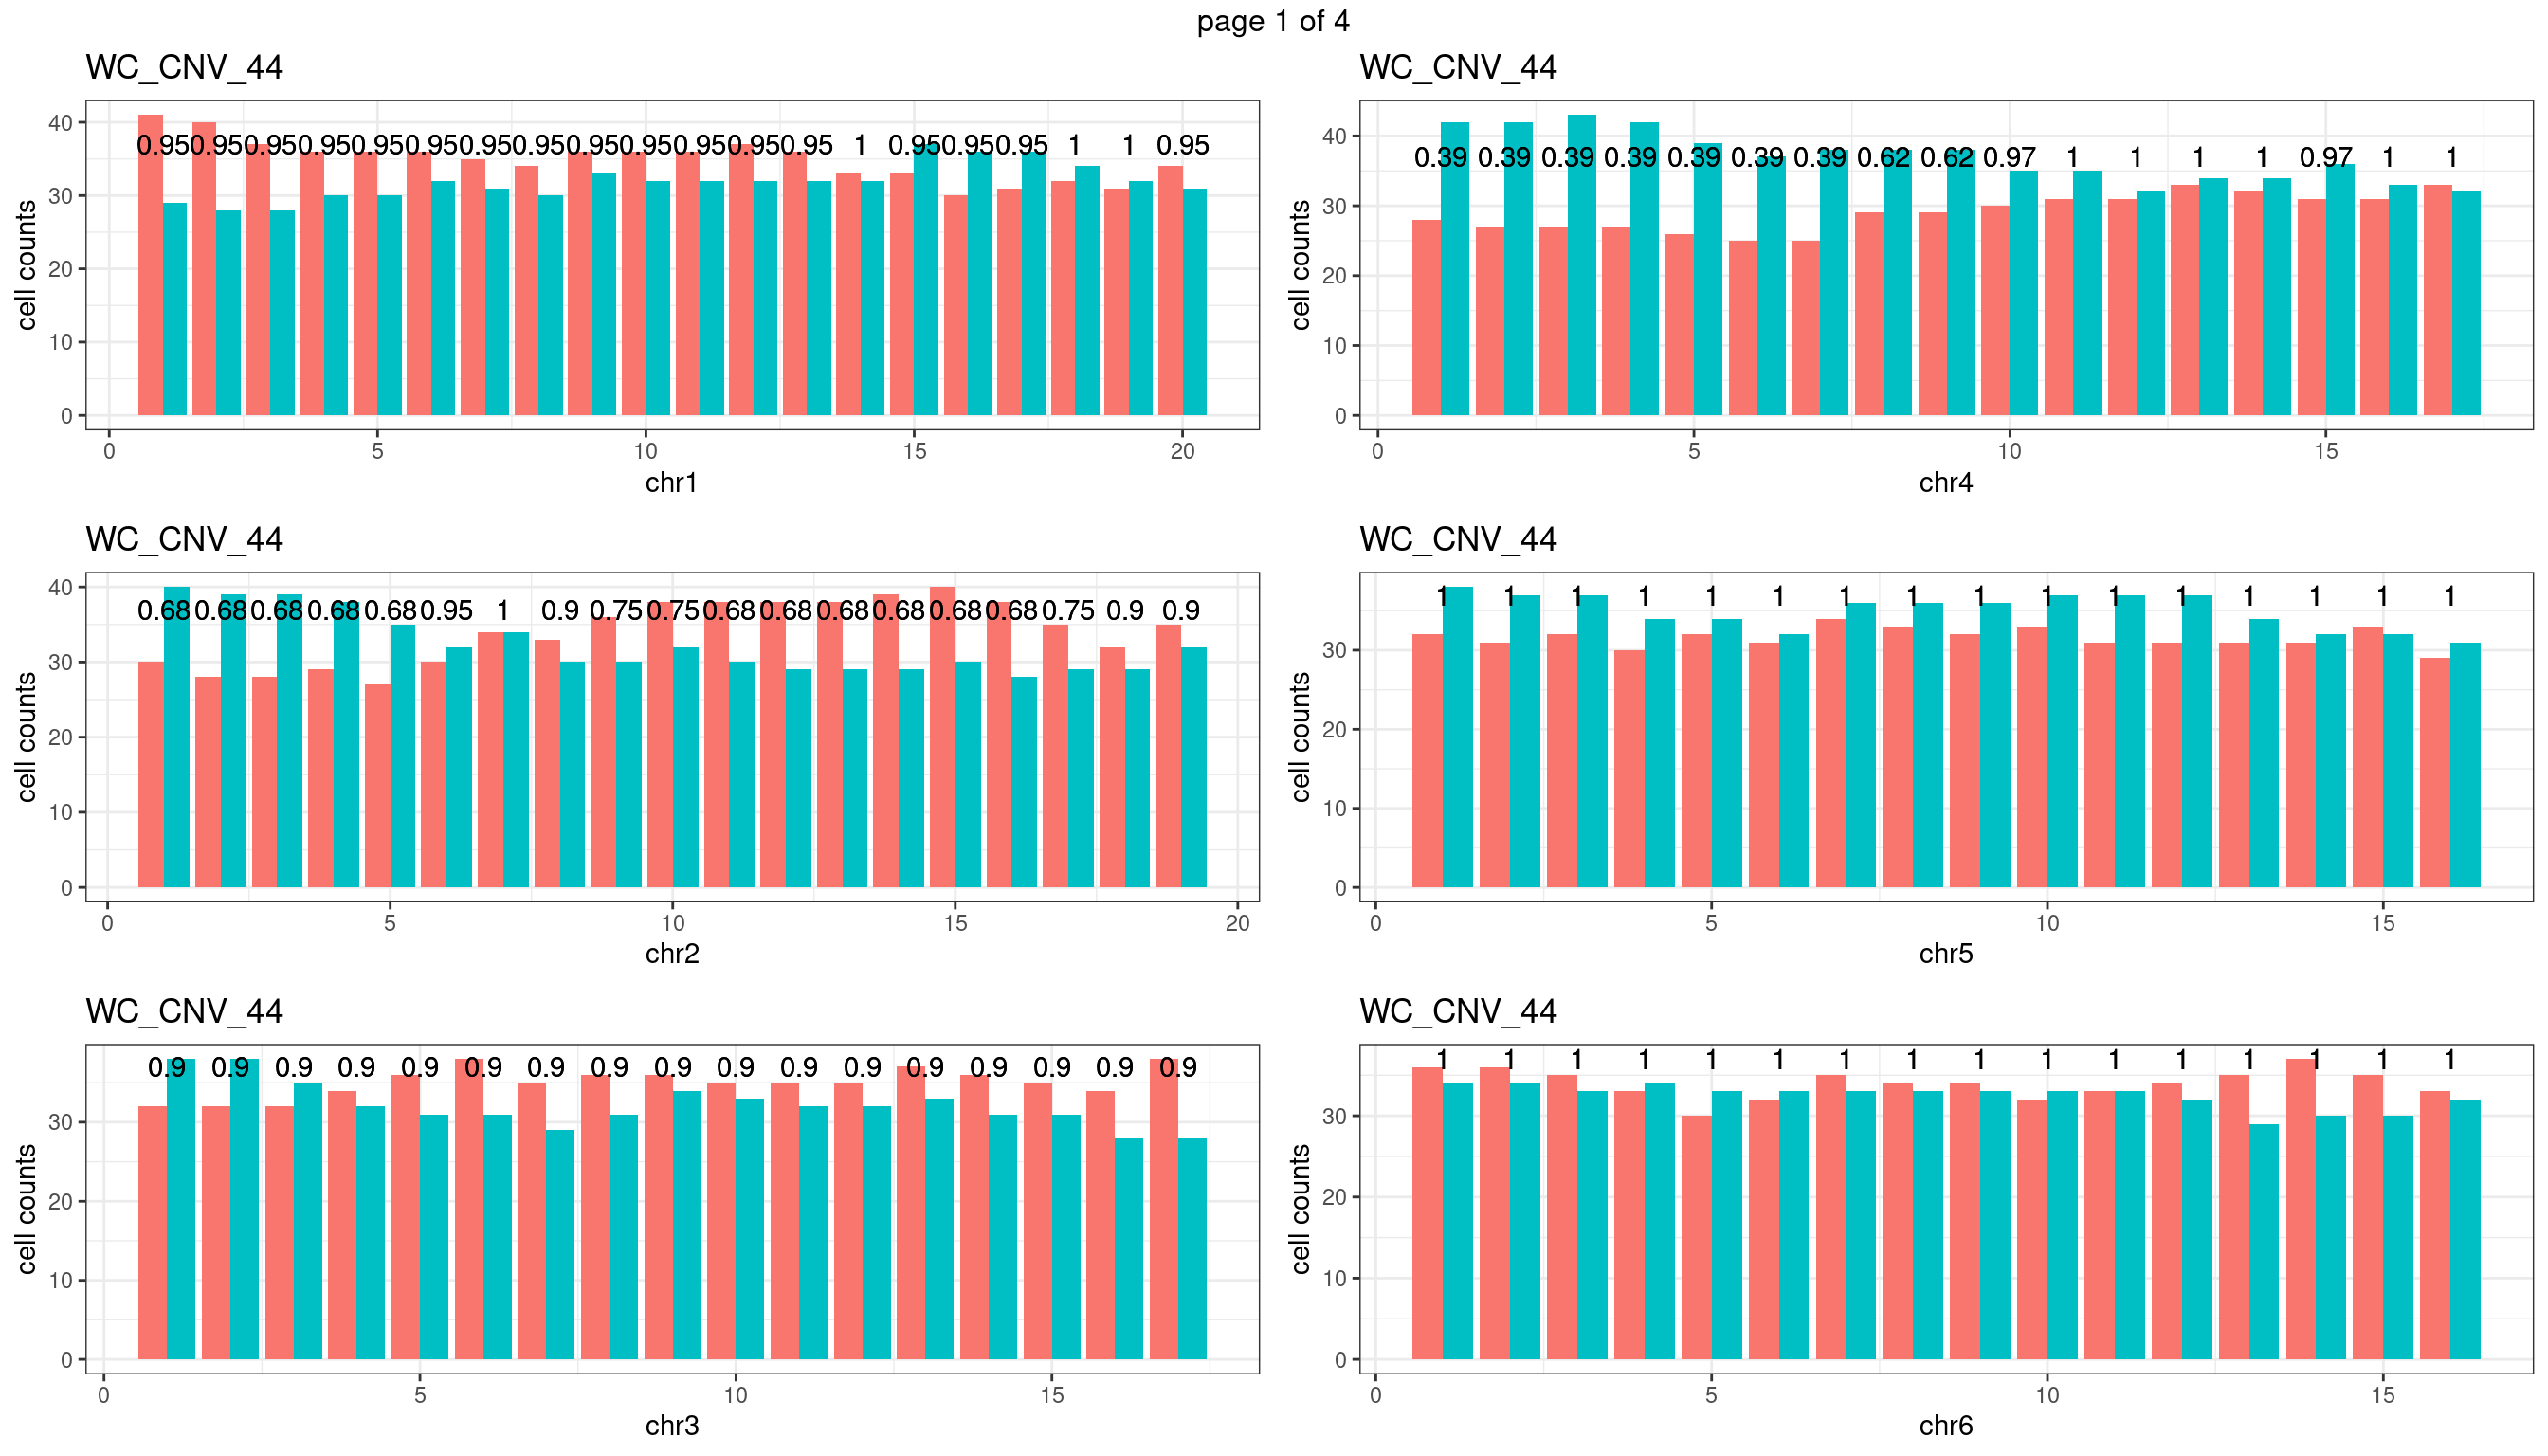
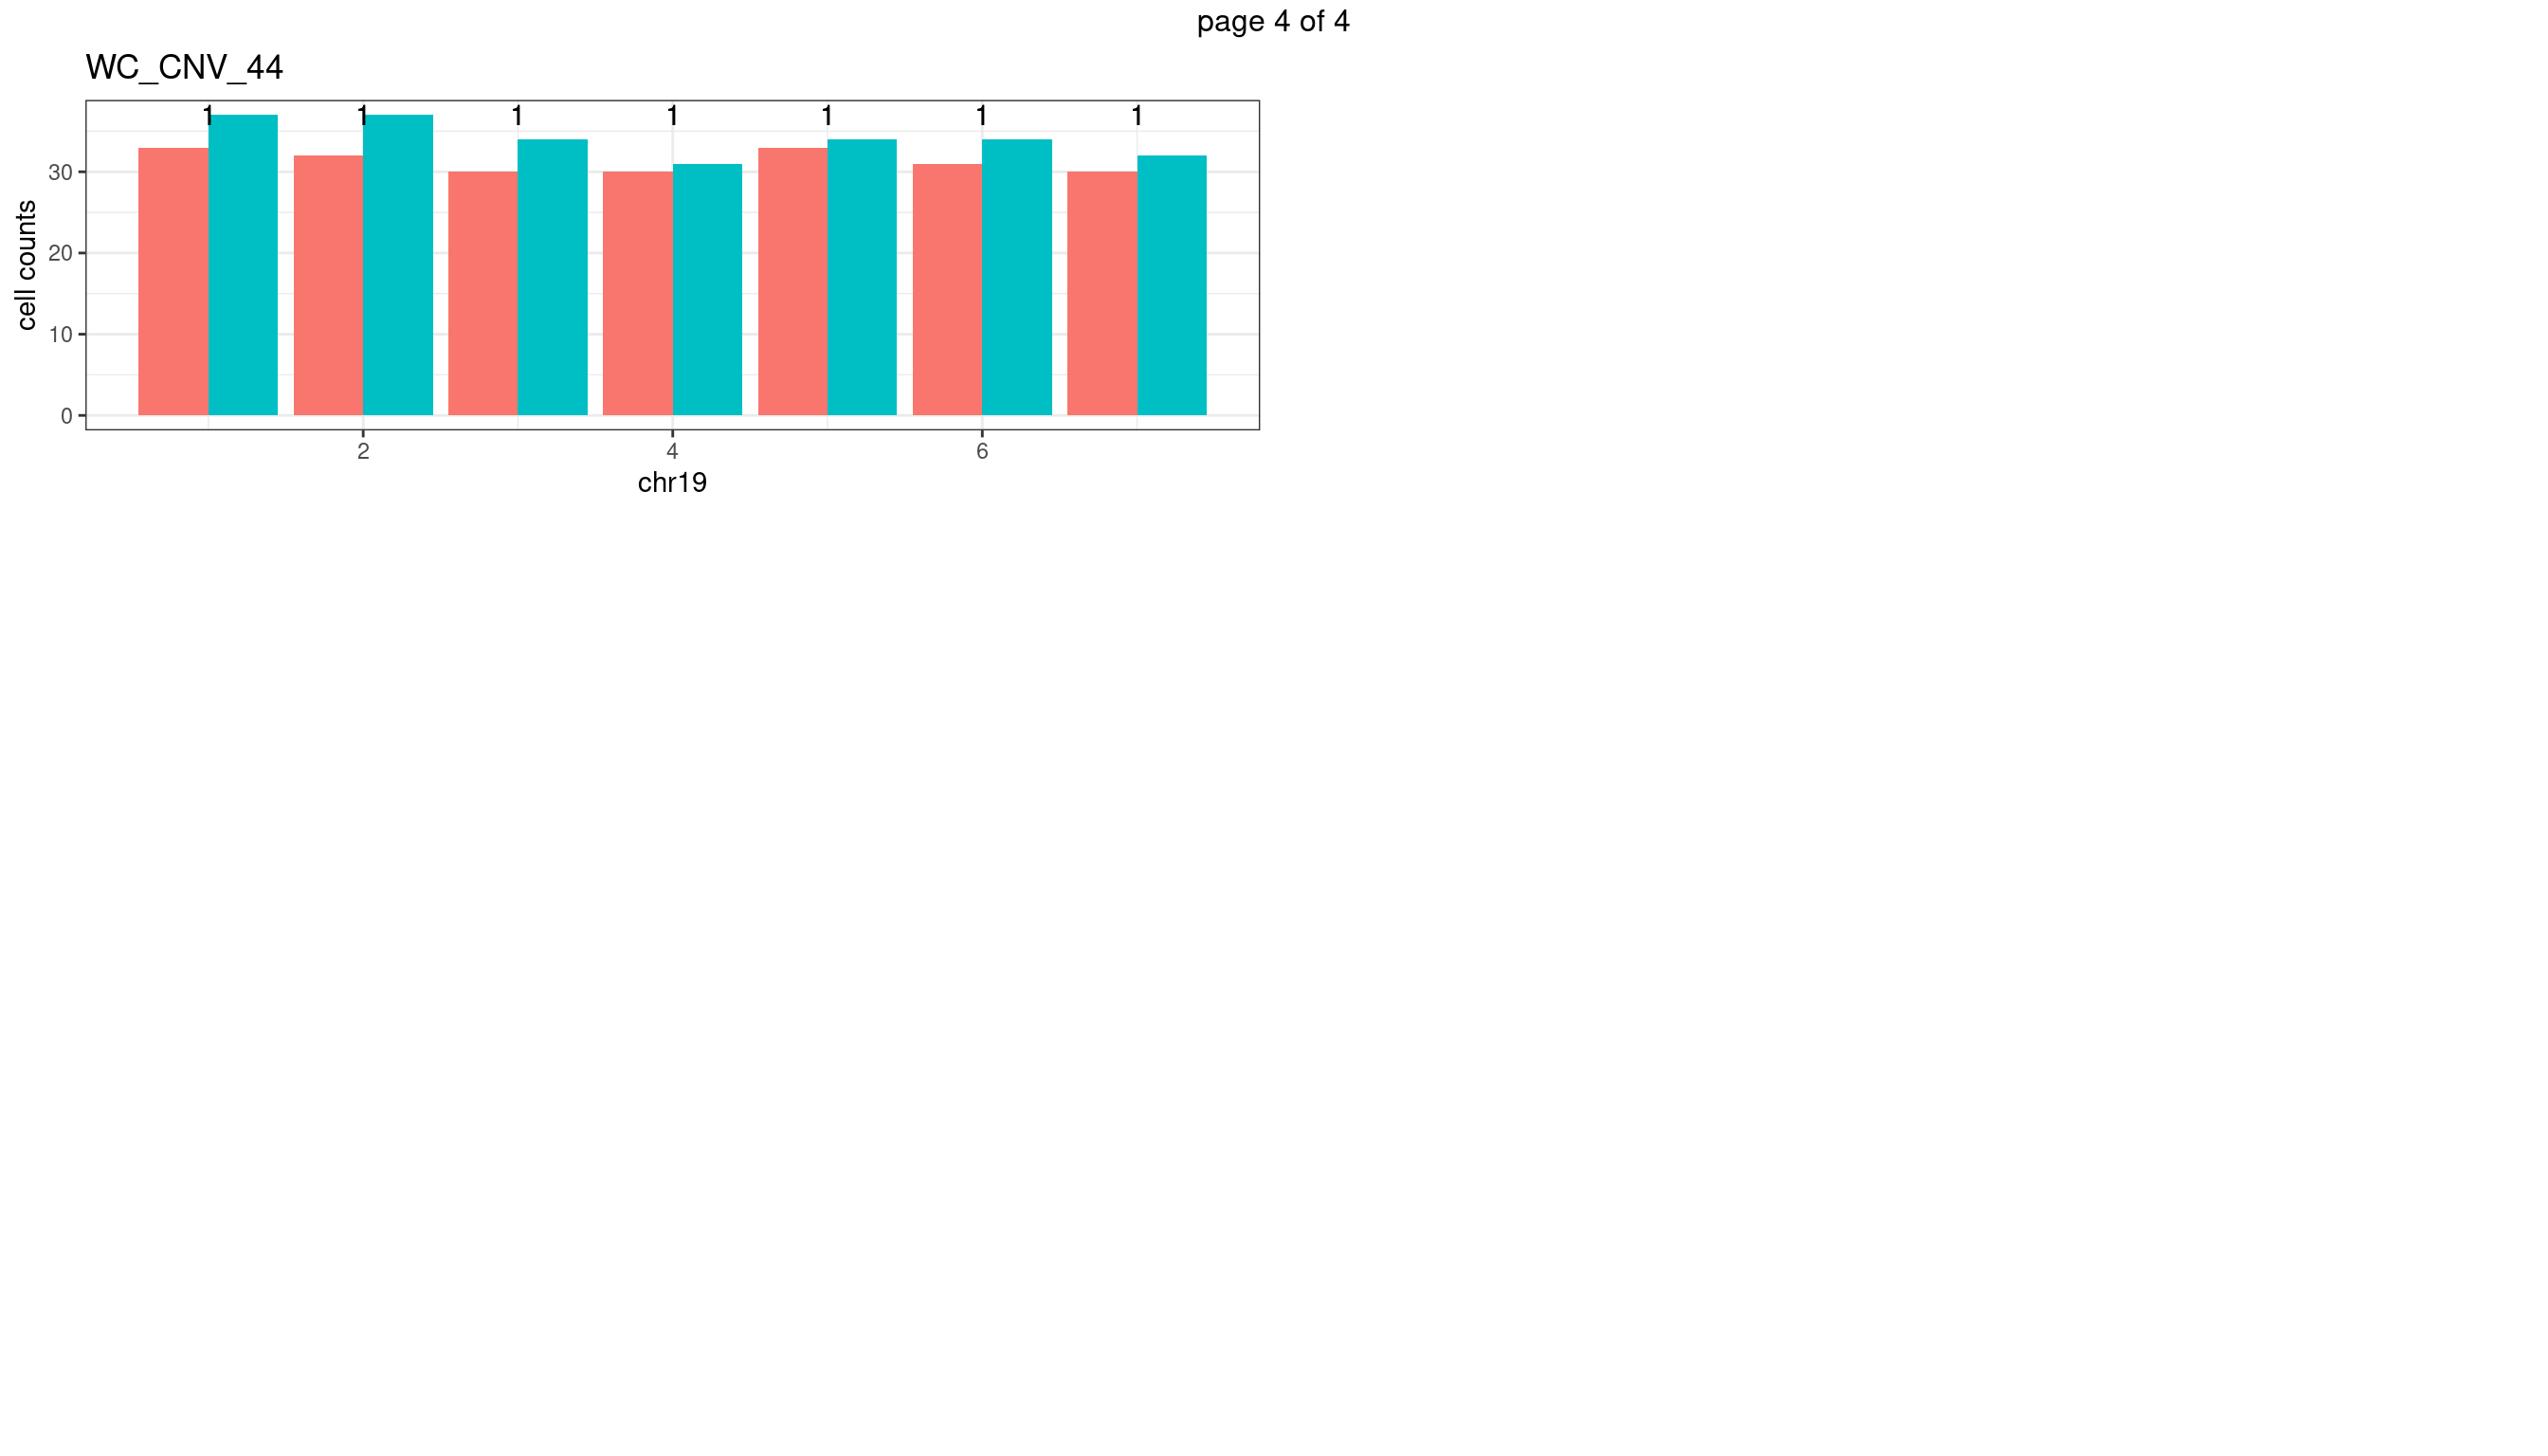
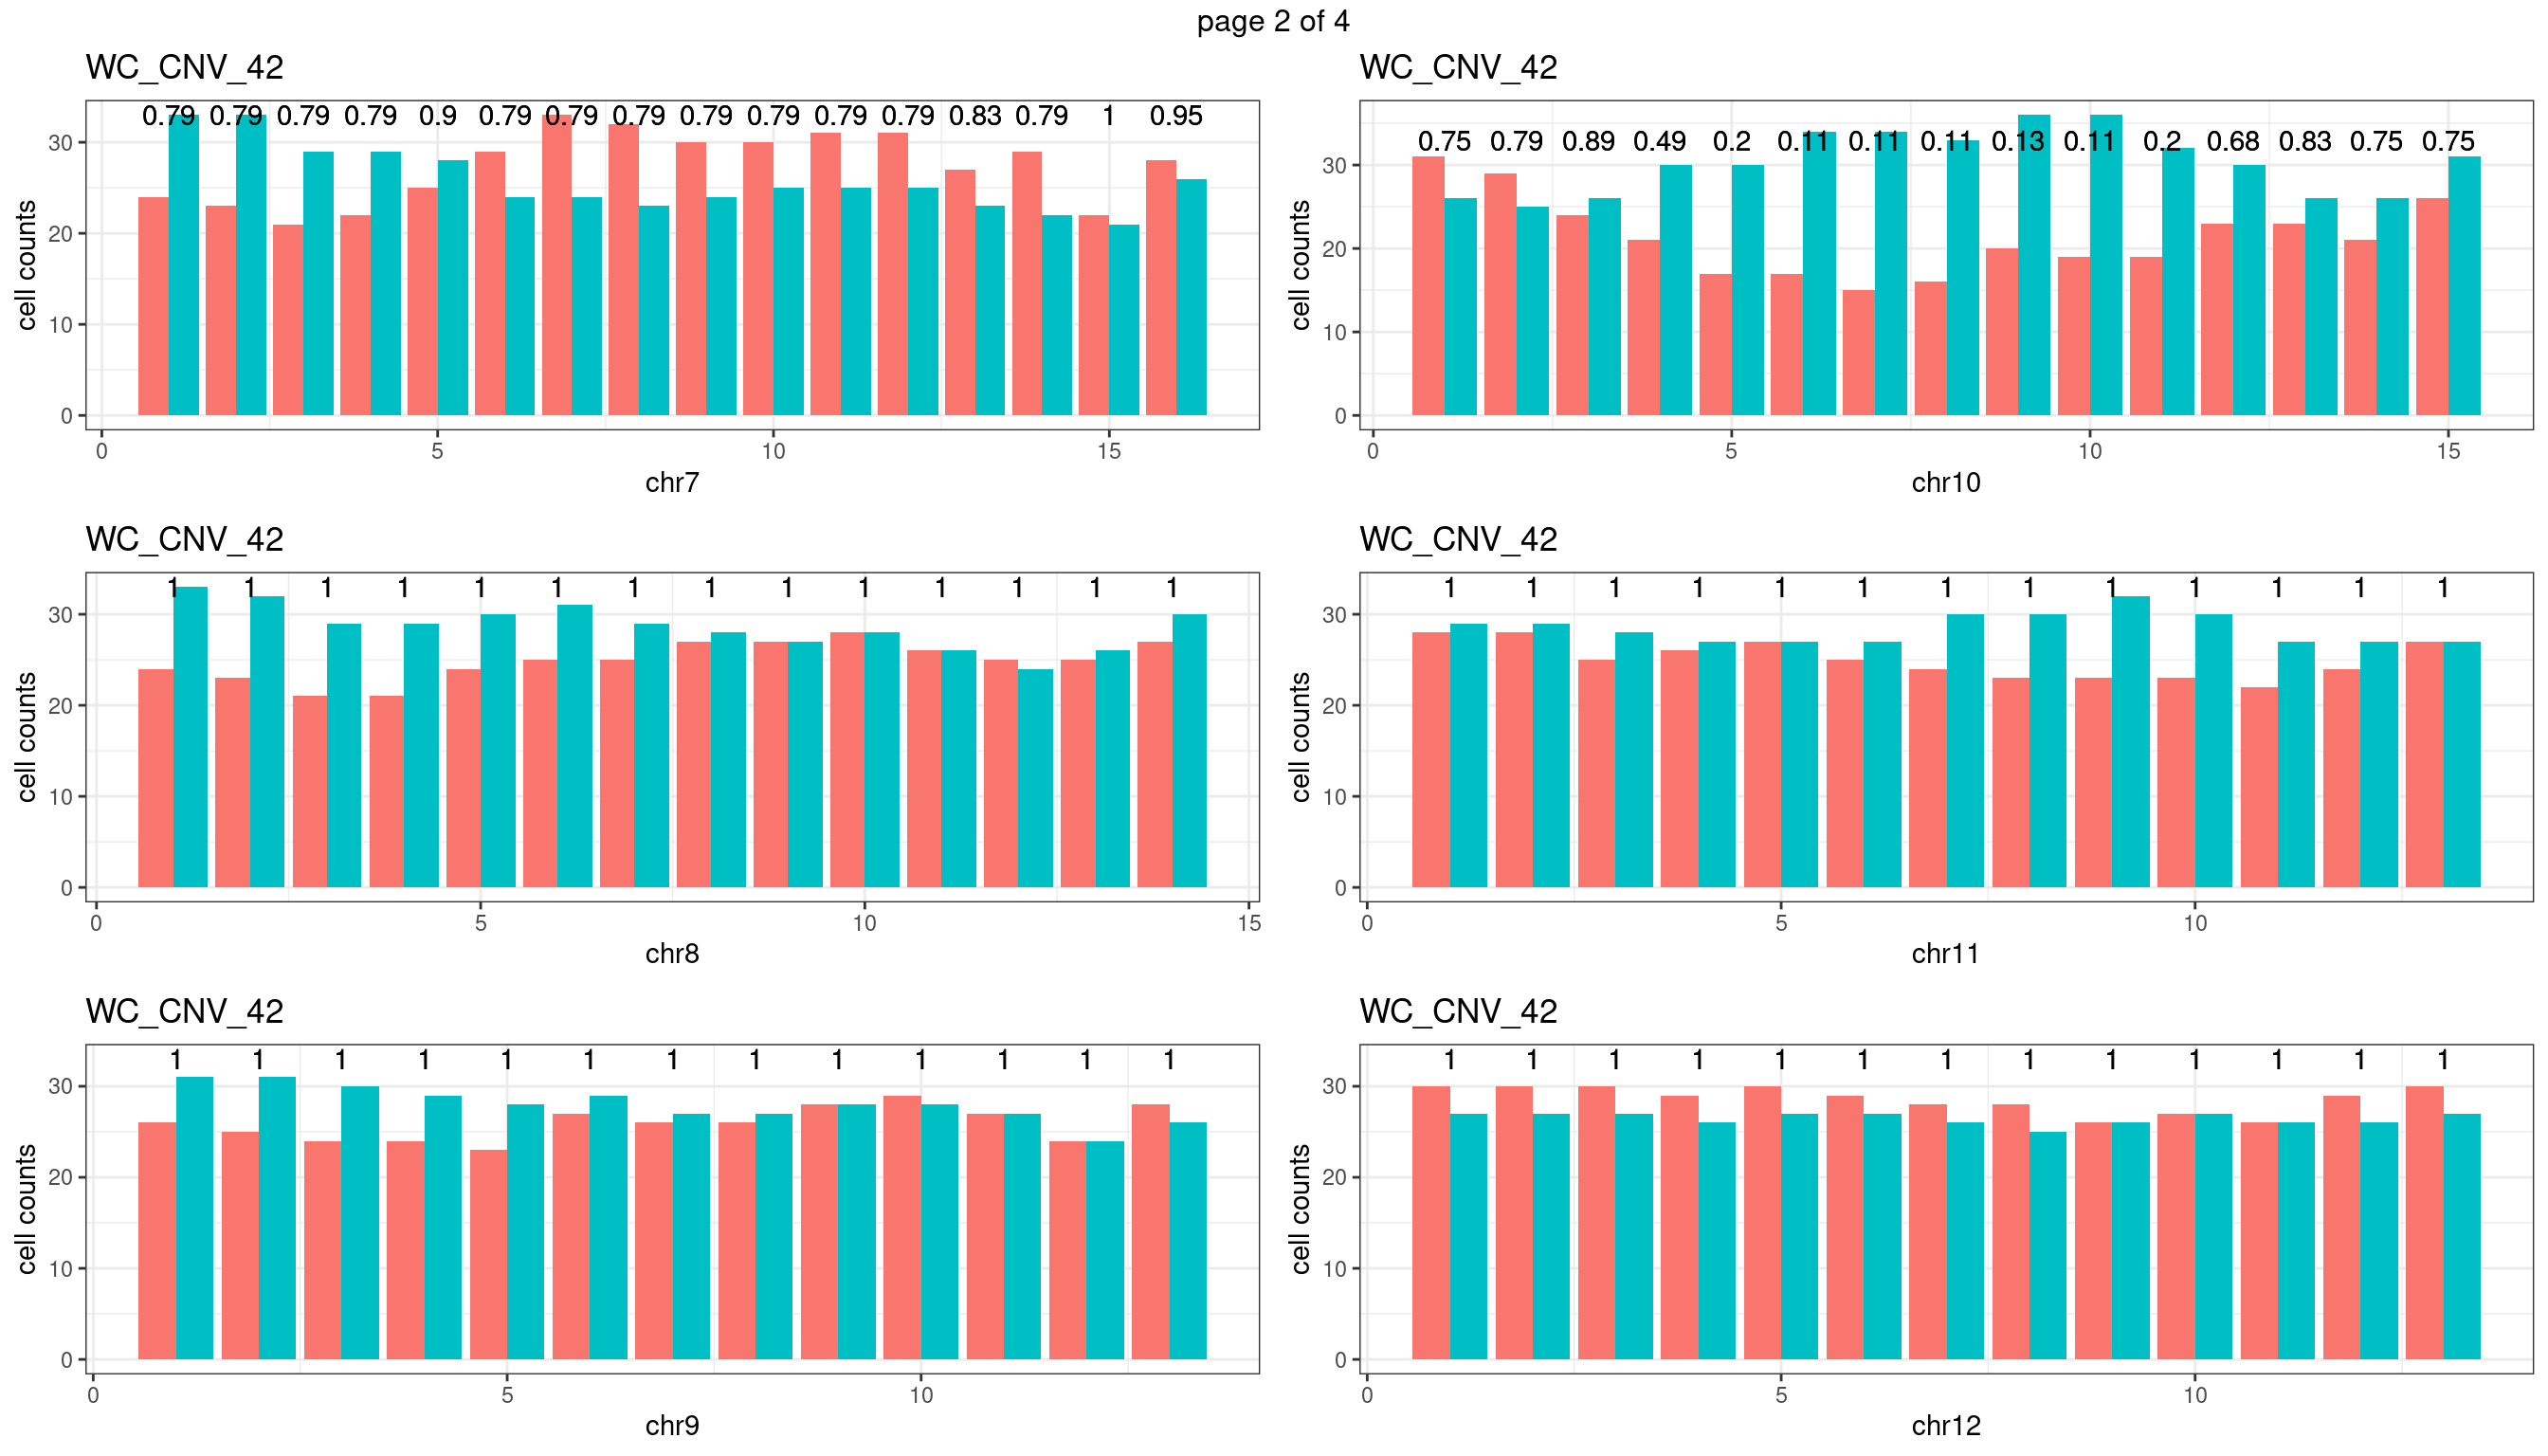
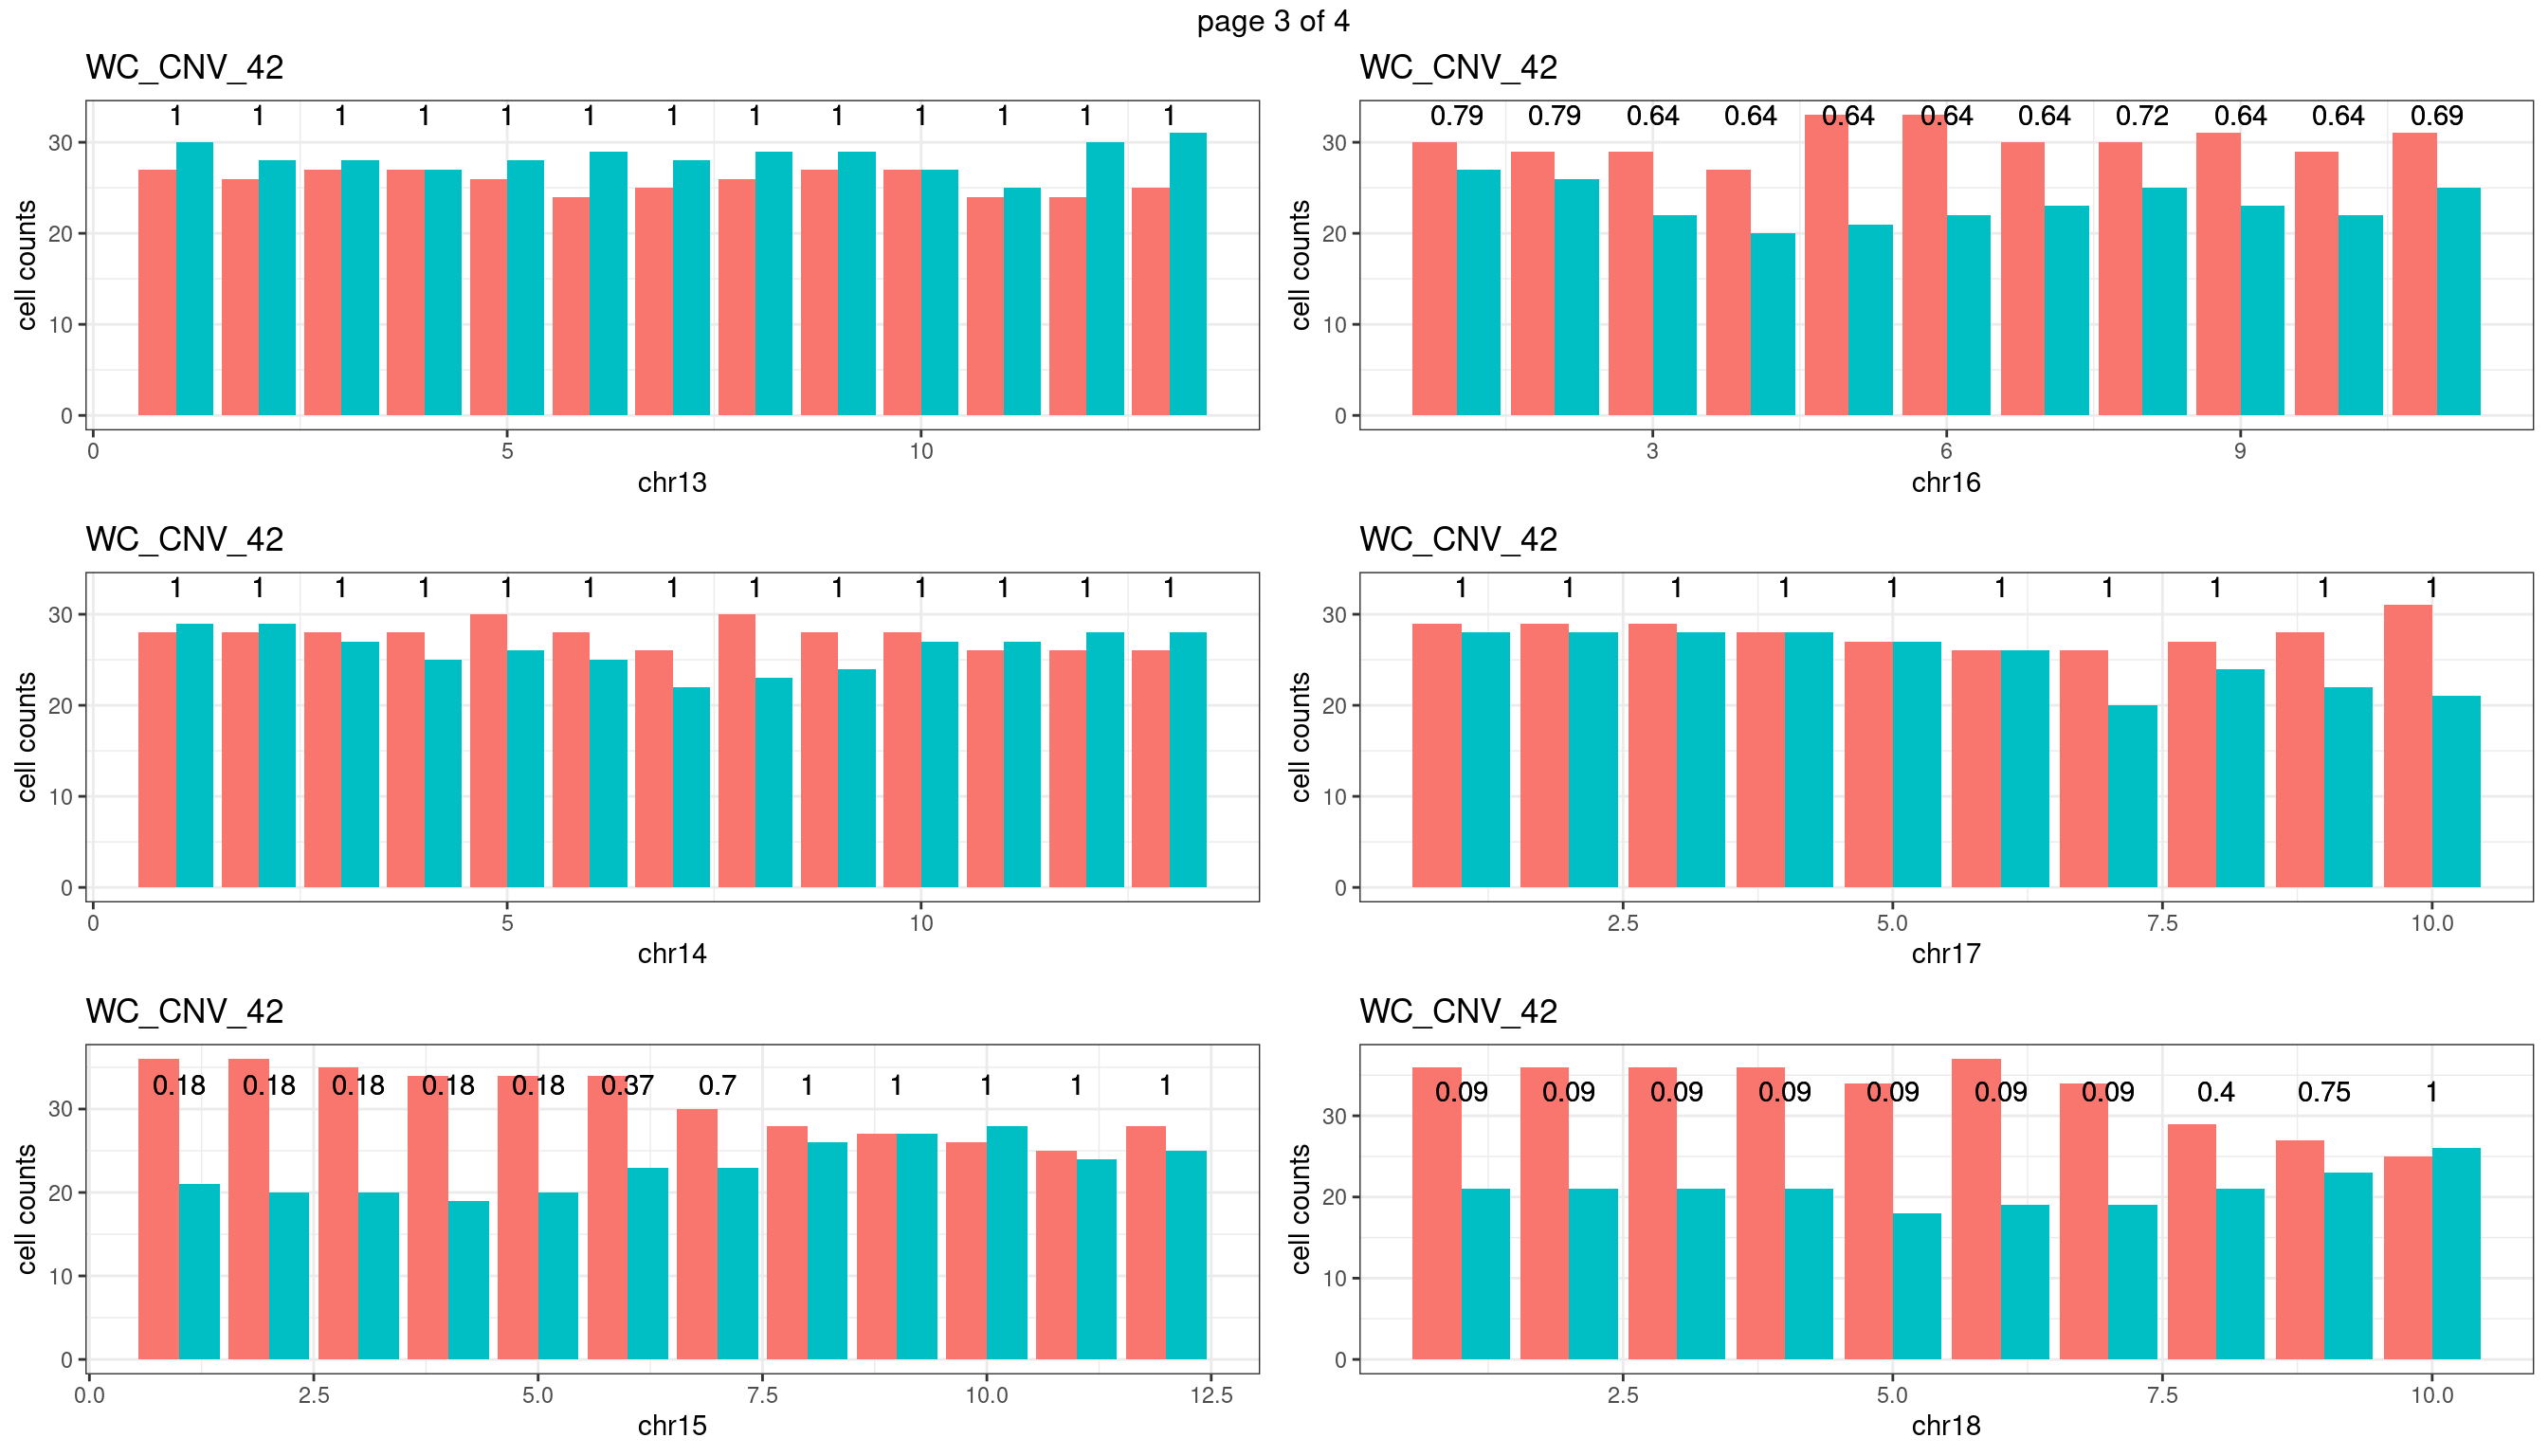
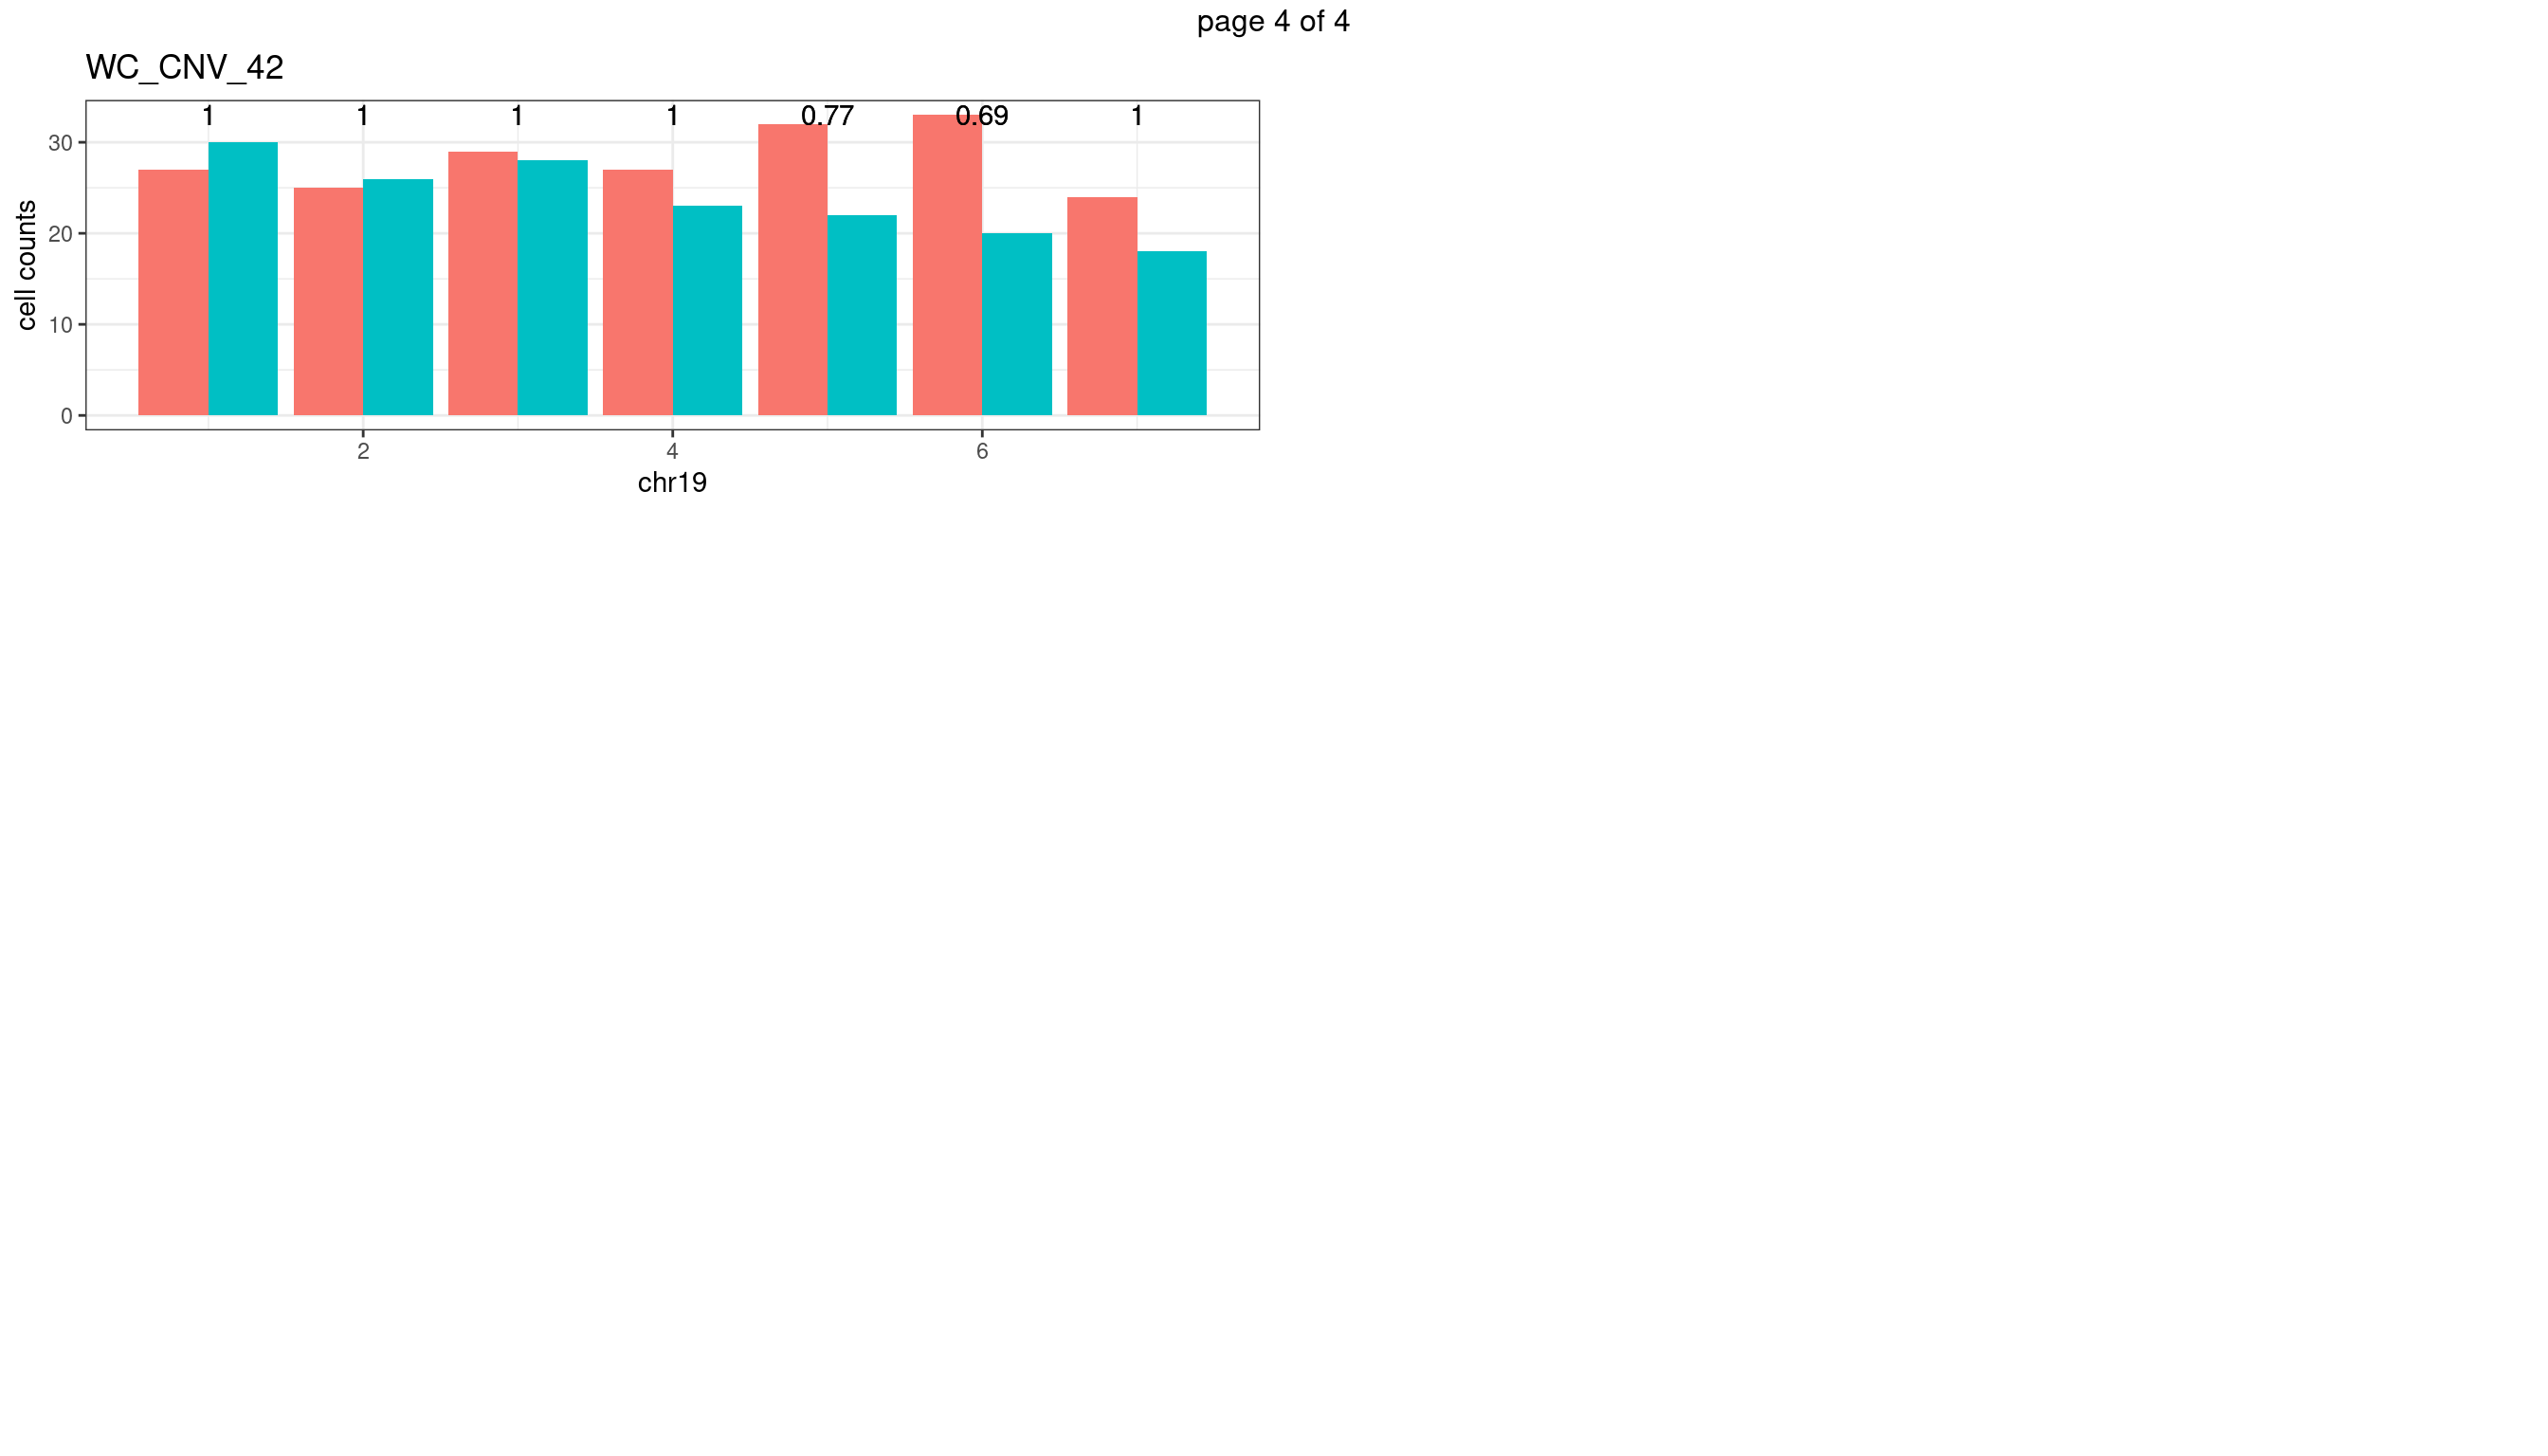
WC_CNV_42
sampleName <- "WC_CNV_42"
plots_list <- list()
for(chrName in paste0("chr",1:19)){
  bin_state_gr <- readRDS(paste0("./output/outputR/analysisRDS/",sampleName,"_",
                          chrName,"bin_state_gr-mar_2022.rds"))

s1_counts <- rowSums(data.frame(mcols(bin_state_gr),check.names = F)=="s1",na.rm=T)
s2_counts <- rowSums(data.frame(mcols(bin_state_gr),check.names = F)=="s2",na.rm=T)
bins_pvals <- lapply(seq(s1_counts), function(i){
  btest <- binom.test(c(s1_counts[i],s2_counts[i]))
  btest$p.value
})

plot_df <- data.frame(s1_count = s1_counts,
                      s2_count = s2_counts,
                      bin_id = seq(length(bins_pvals)),
                      biom_pvals = unlist(bins_pvals),
                      fdr = p.adjust(unlist(bins_pvals),method = "fdr"))

p <- plot_df %>% tidyr::pivot_longer(c("s1_count","s2_count")) %>% ggplot() +
  geom_bar(aes(x = bin_id, y = value,fill = name),position = "dodge",
           stat = "identity")+
  geom_text(aes(x = bin_id,y=max(c(s1_counts,s2_counts)), label = round(fdr,2)))+
  xlab(chrName)+ylab("cell counts")+theme_bw()+ggtitle(sampleName)
plots_list[[chrName]] <- p+guides(fill = "none" )
}
mChrThresPlots <- marrangeGrob(plots_list, nrow=3, ncol=2)
mChrThresPlots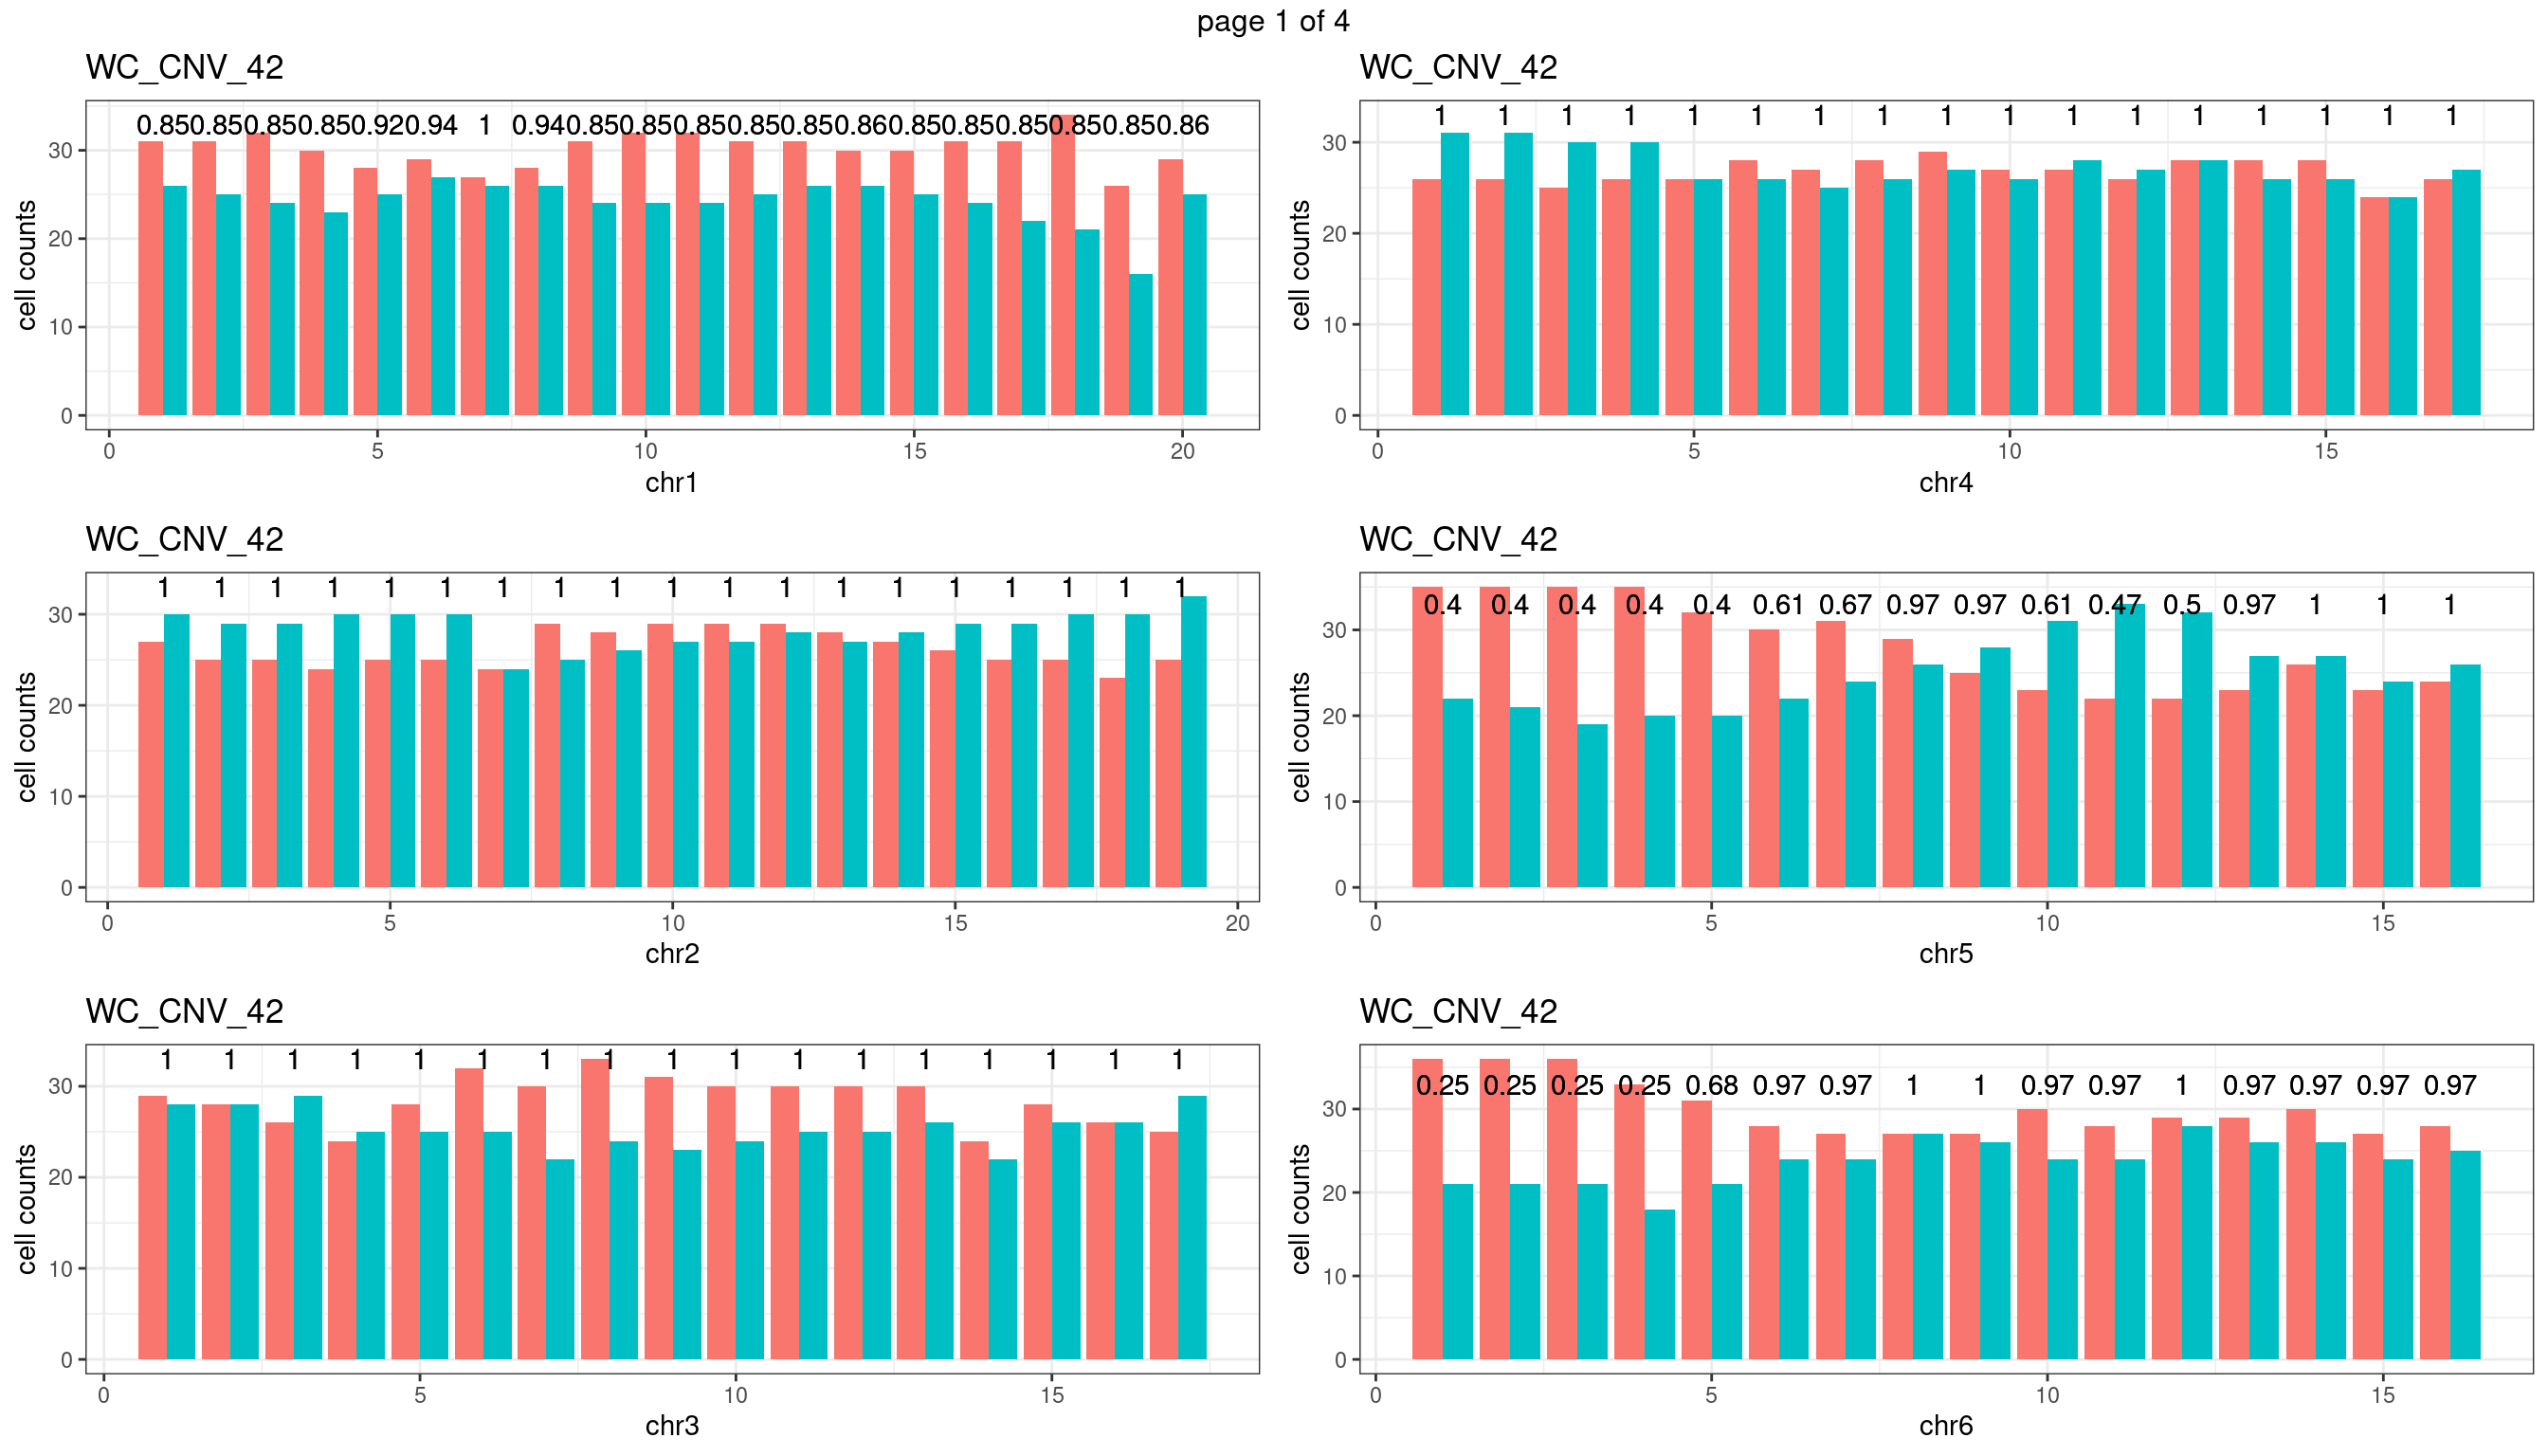
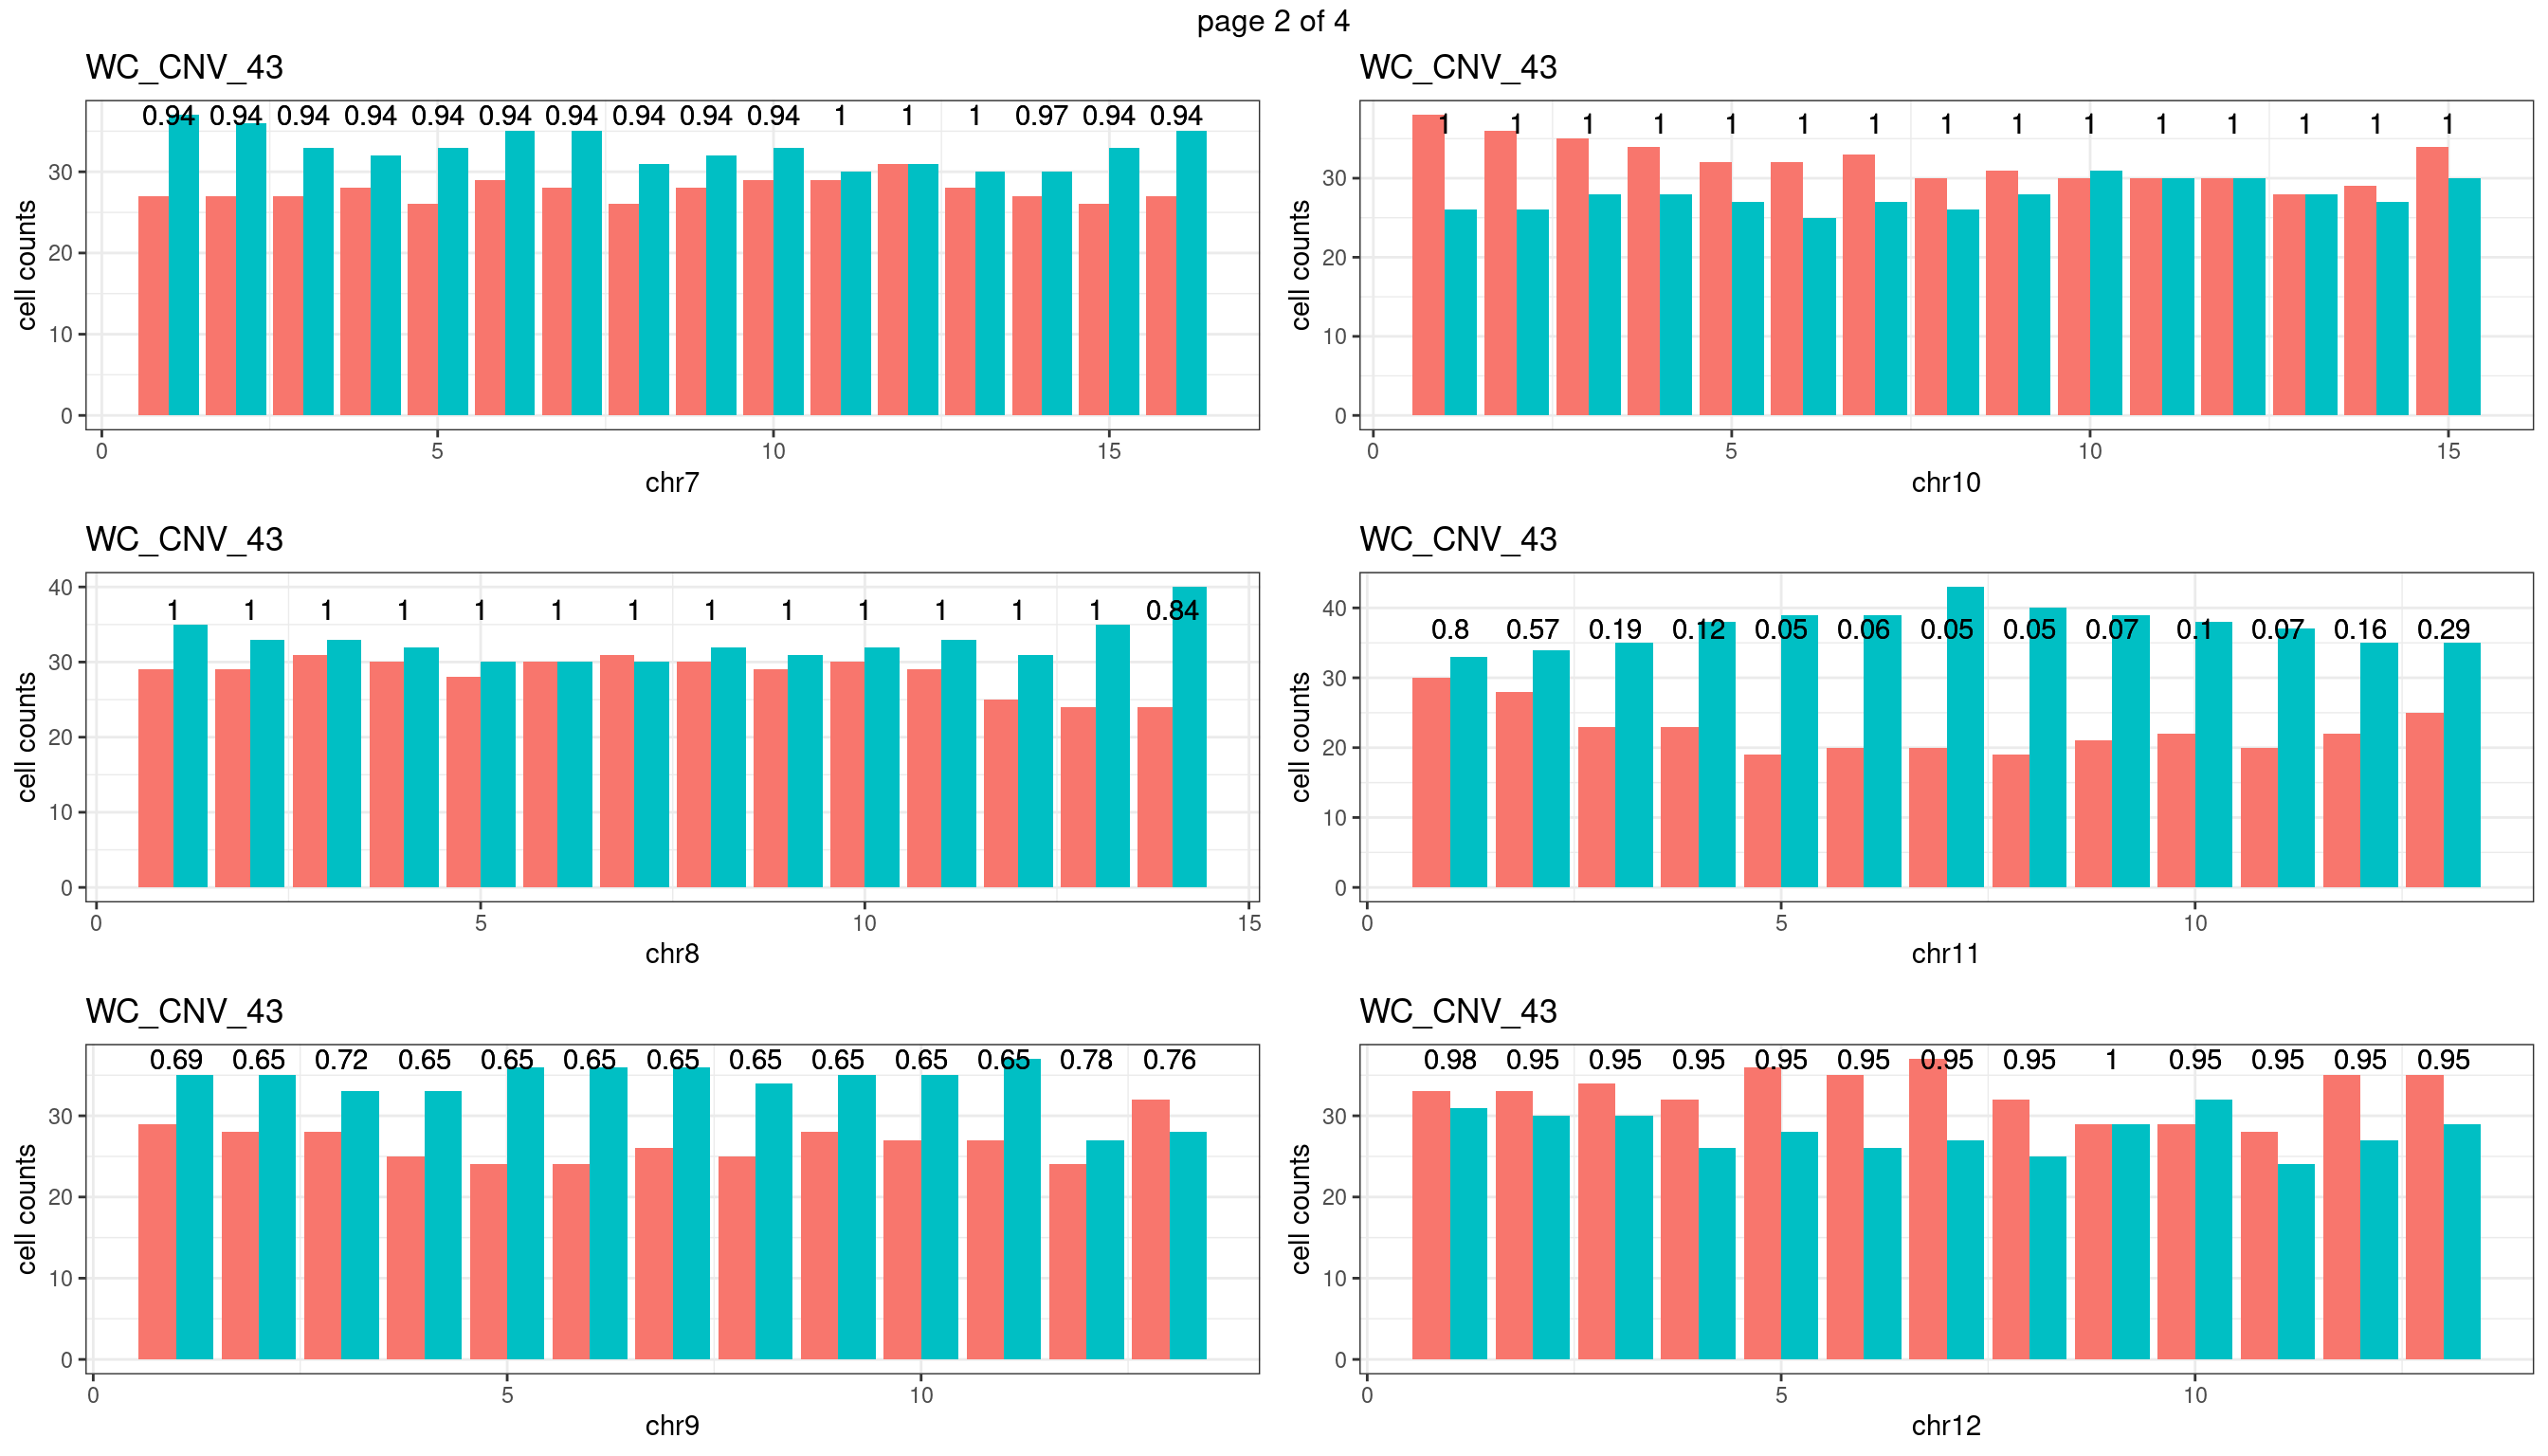
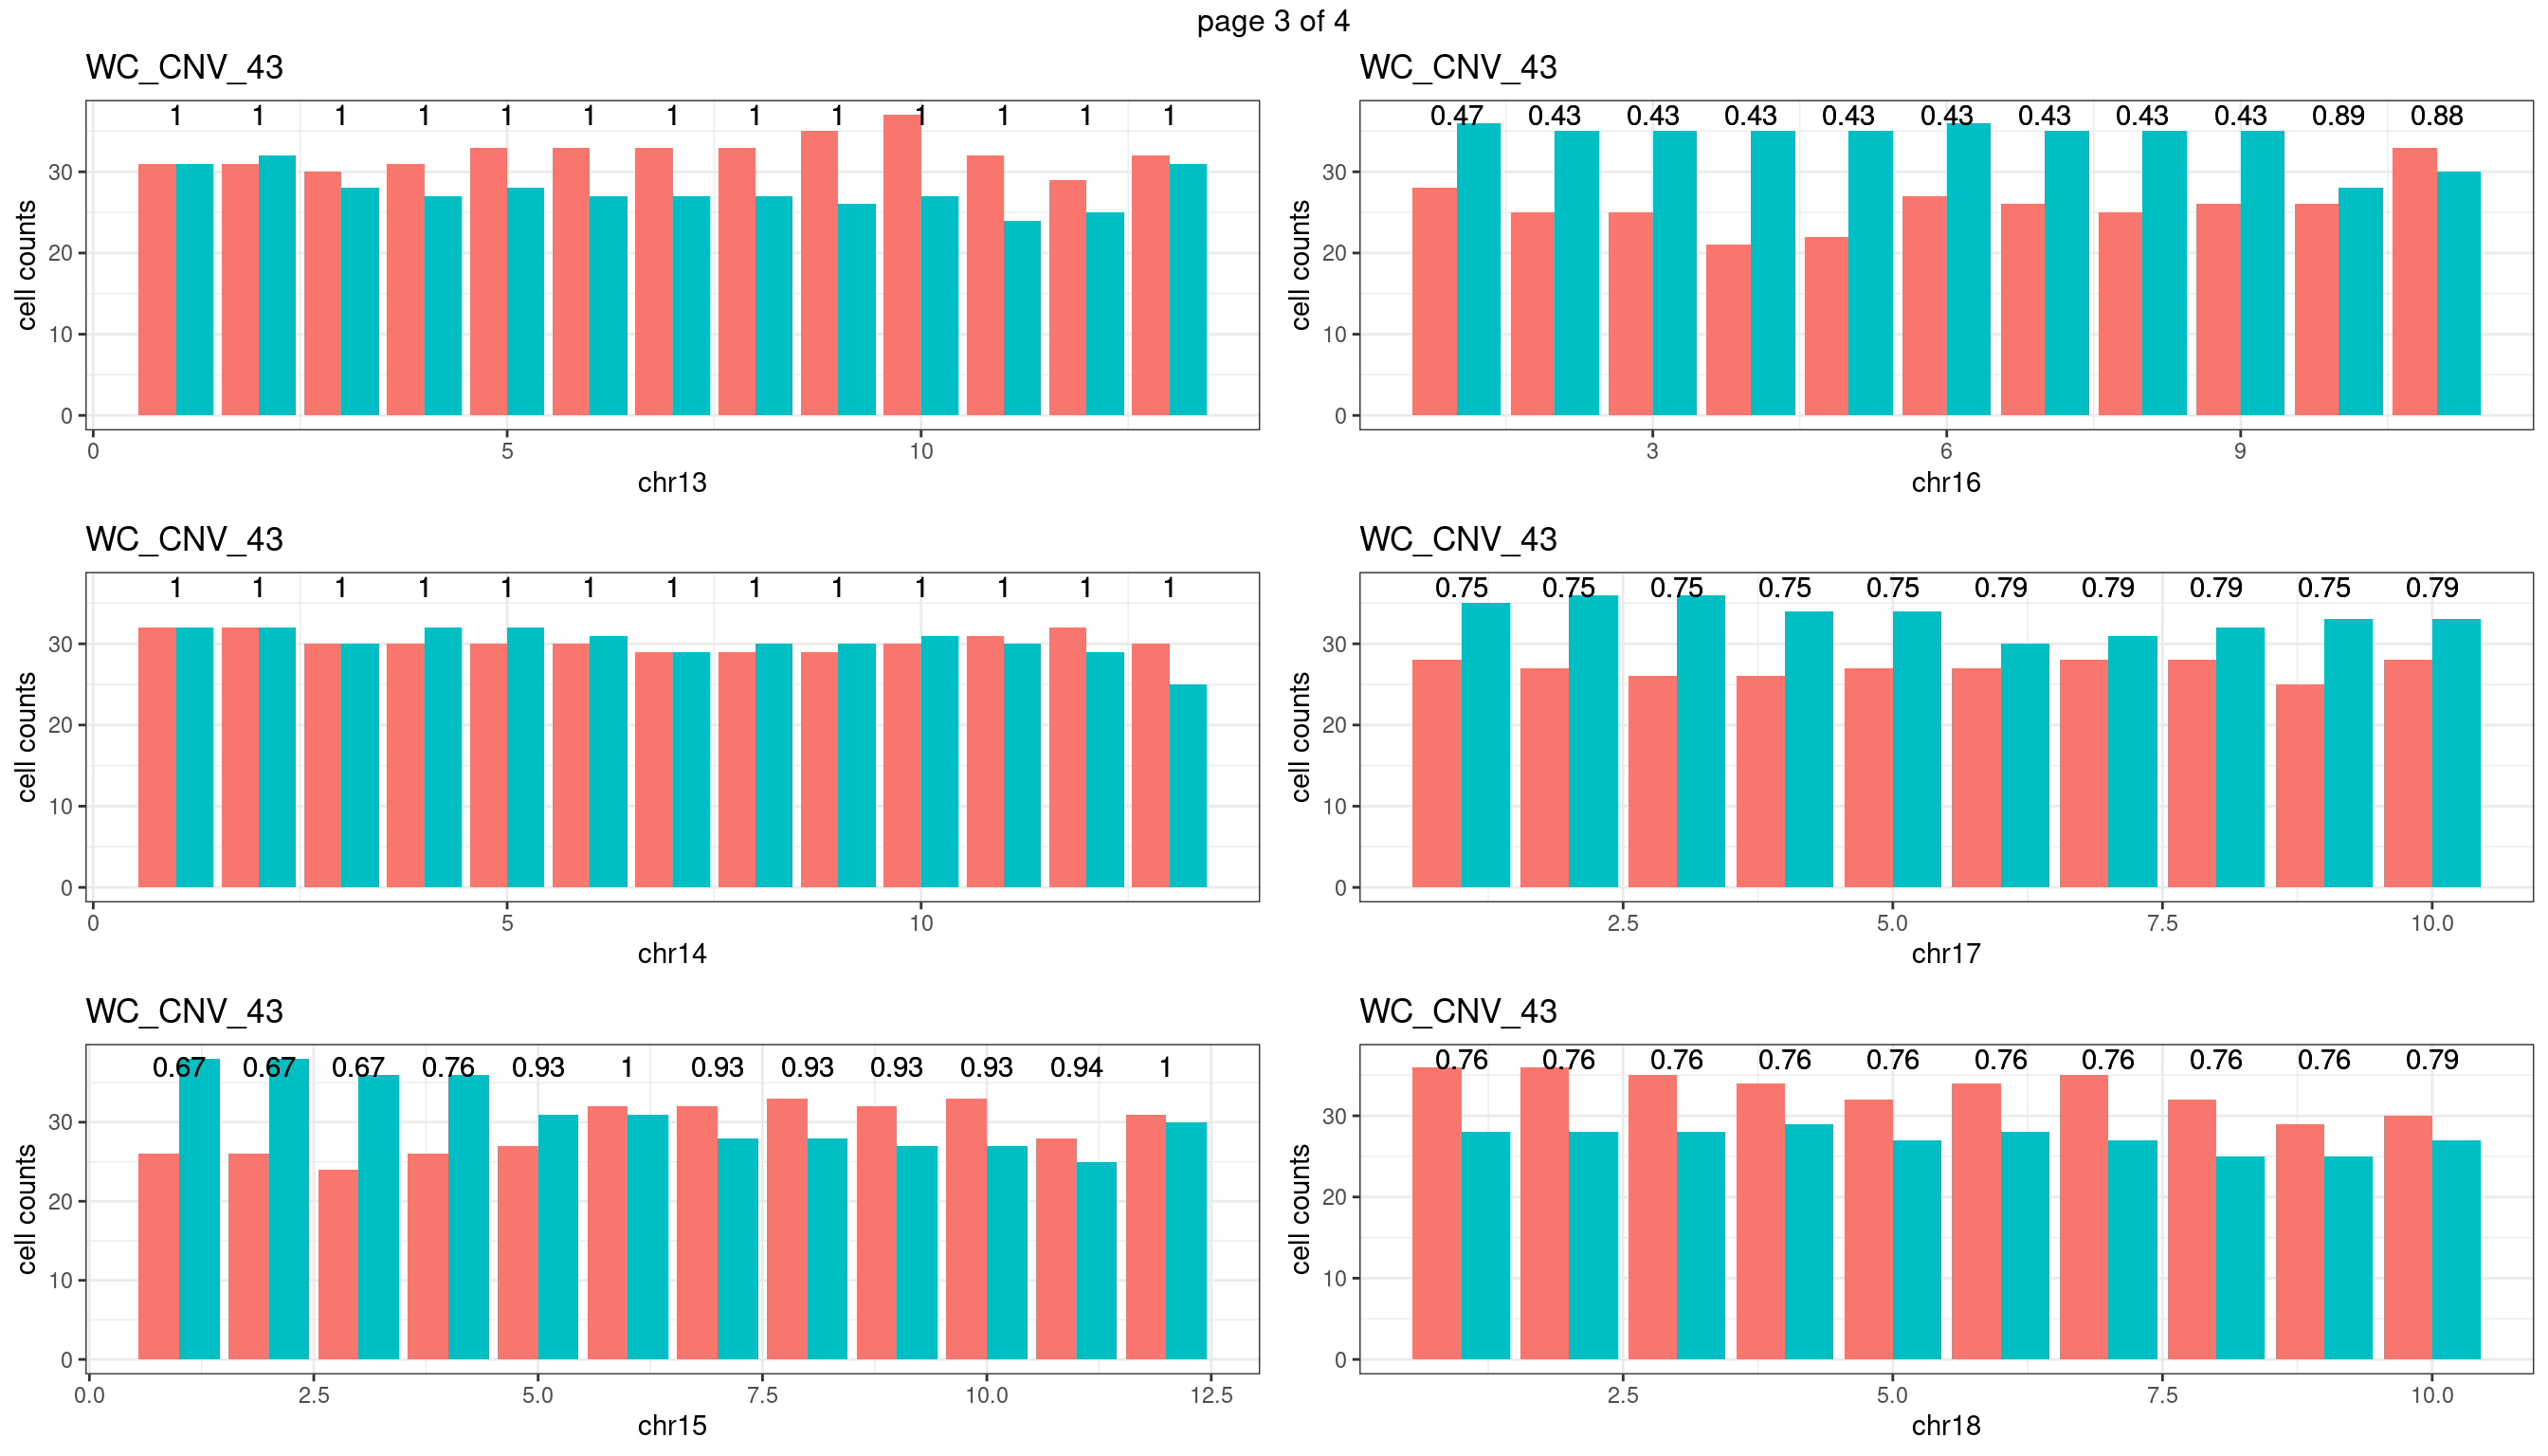
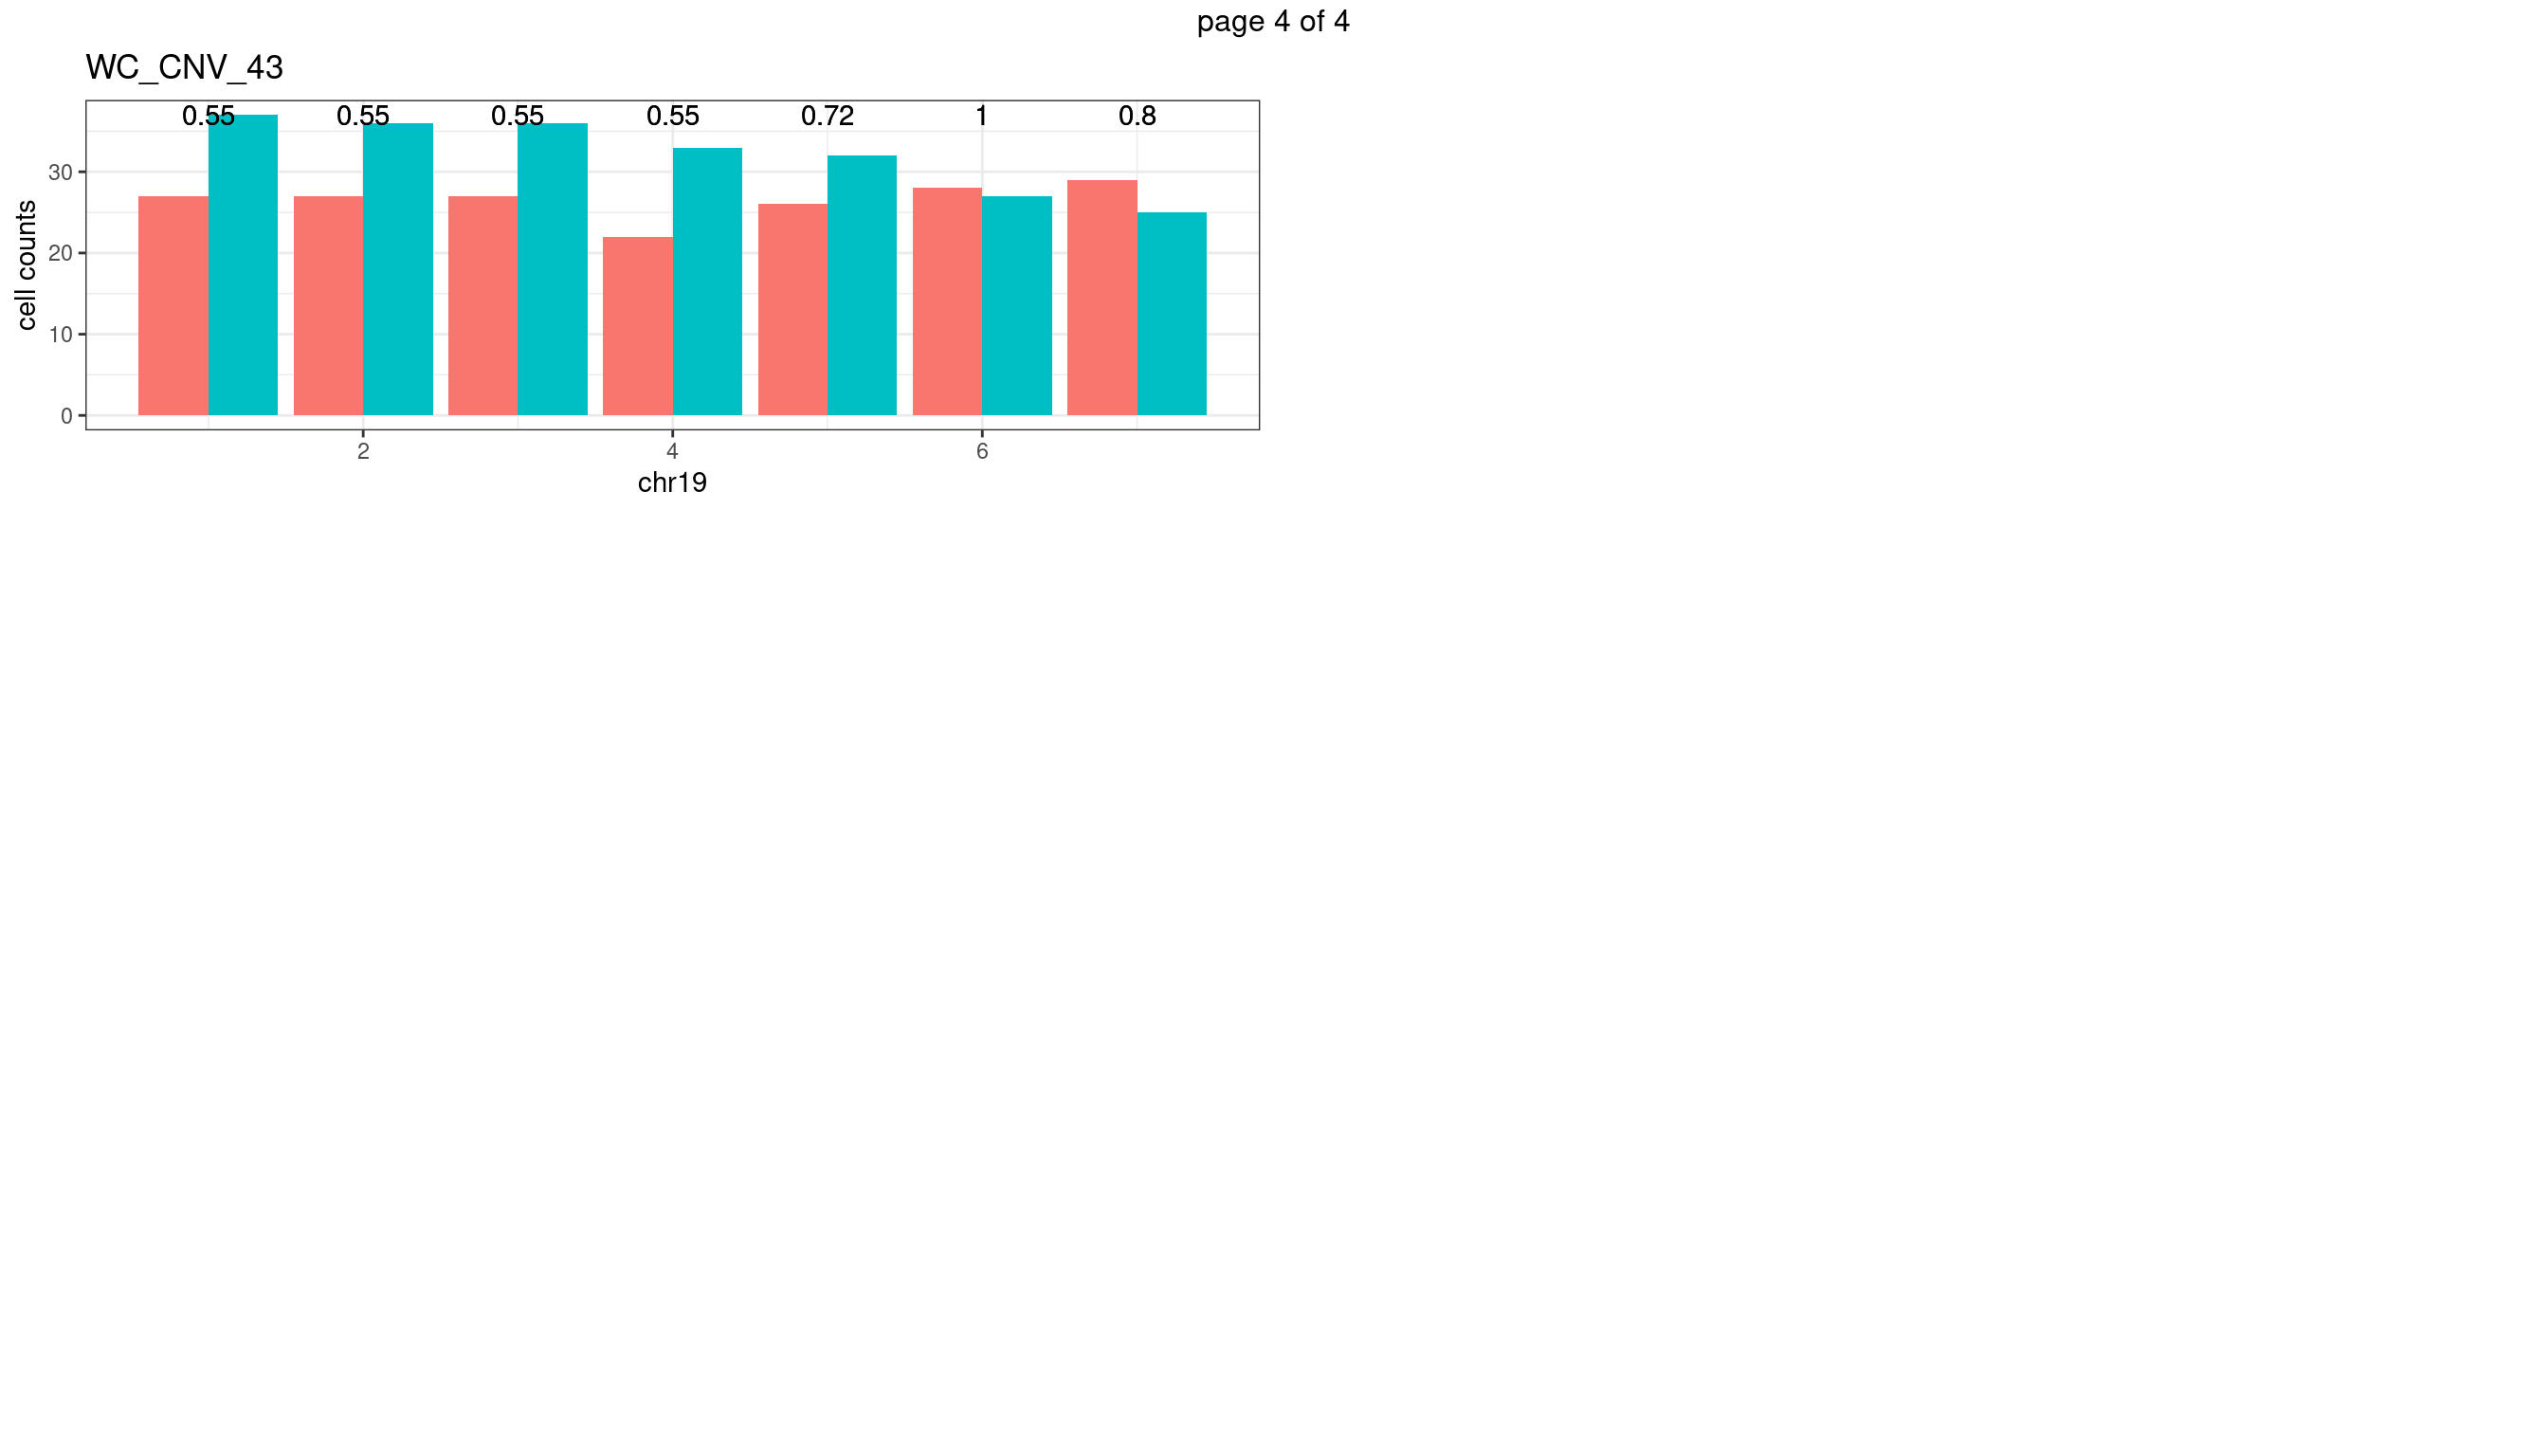
WC_CNV_43
sampleName <- "WC_CNV_43"
plots_list <- list()
for(chrName in paste0("chr",1:19)){
  bin_state_gr <- readRDS(paste0("./output/outputR/analysisRDS/",sampleName,"_",
                          chrName,"bin_state_gr-mar_2022.rds"))

s1_counts <- rowSums(data.frame(mcols(bin_state_gr),check.names = F)=="s1",na.rm=T)
s2_counts <- rowSums(data.frame(mcols(bin_state_gr),check.names = F)=="s2",na.rm=T)
bins_pvals <- lapply(seq(s1_counts), function(i){
  btest <- binom.test(c(s1_counts[i],s2_counts[i]))
  btest$p.value
})

plot_df <- data.frame(s1_count = s1_counts,
                      s2_count = s2_counts,
                      bin_id = seq(length(bins_pvals)),
                      biom_pvals = unlist(bins_pvals),
                      fdr = p.adjust(unlist(bins_pvals),method = "fdr"))

p <- plot_df %>% tidyr::pivot_longer(c("s1_count","s2_count")) %>% ggplot() +
  geom_bar(aes(x = bin_id, y = value,fill = name),position = "dodge",
           stat = "identity")+
  geom_text(aes(x = bin_id,y=max(c(s1_counts,s2_counts)), label = round(fdr,2)))+
  xlab(chrName)+ylab("cell counts")+theme_bw()+ggtitle(sampleName)
plots_list[[chrName]] <- p+guides(fill = "none" )
}
mChrThresPlots <- marrangeGrob(plots_list, nrow=3, ncol=2)
mChrThresPlots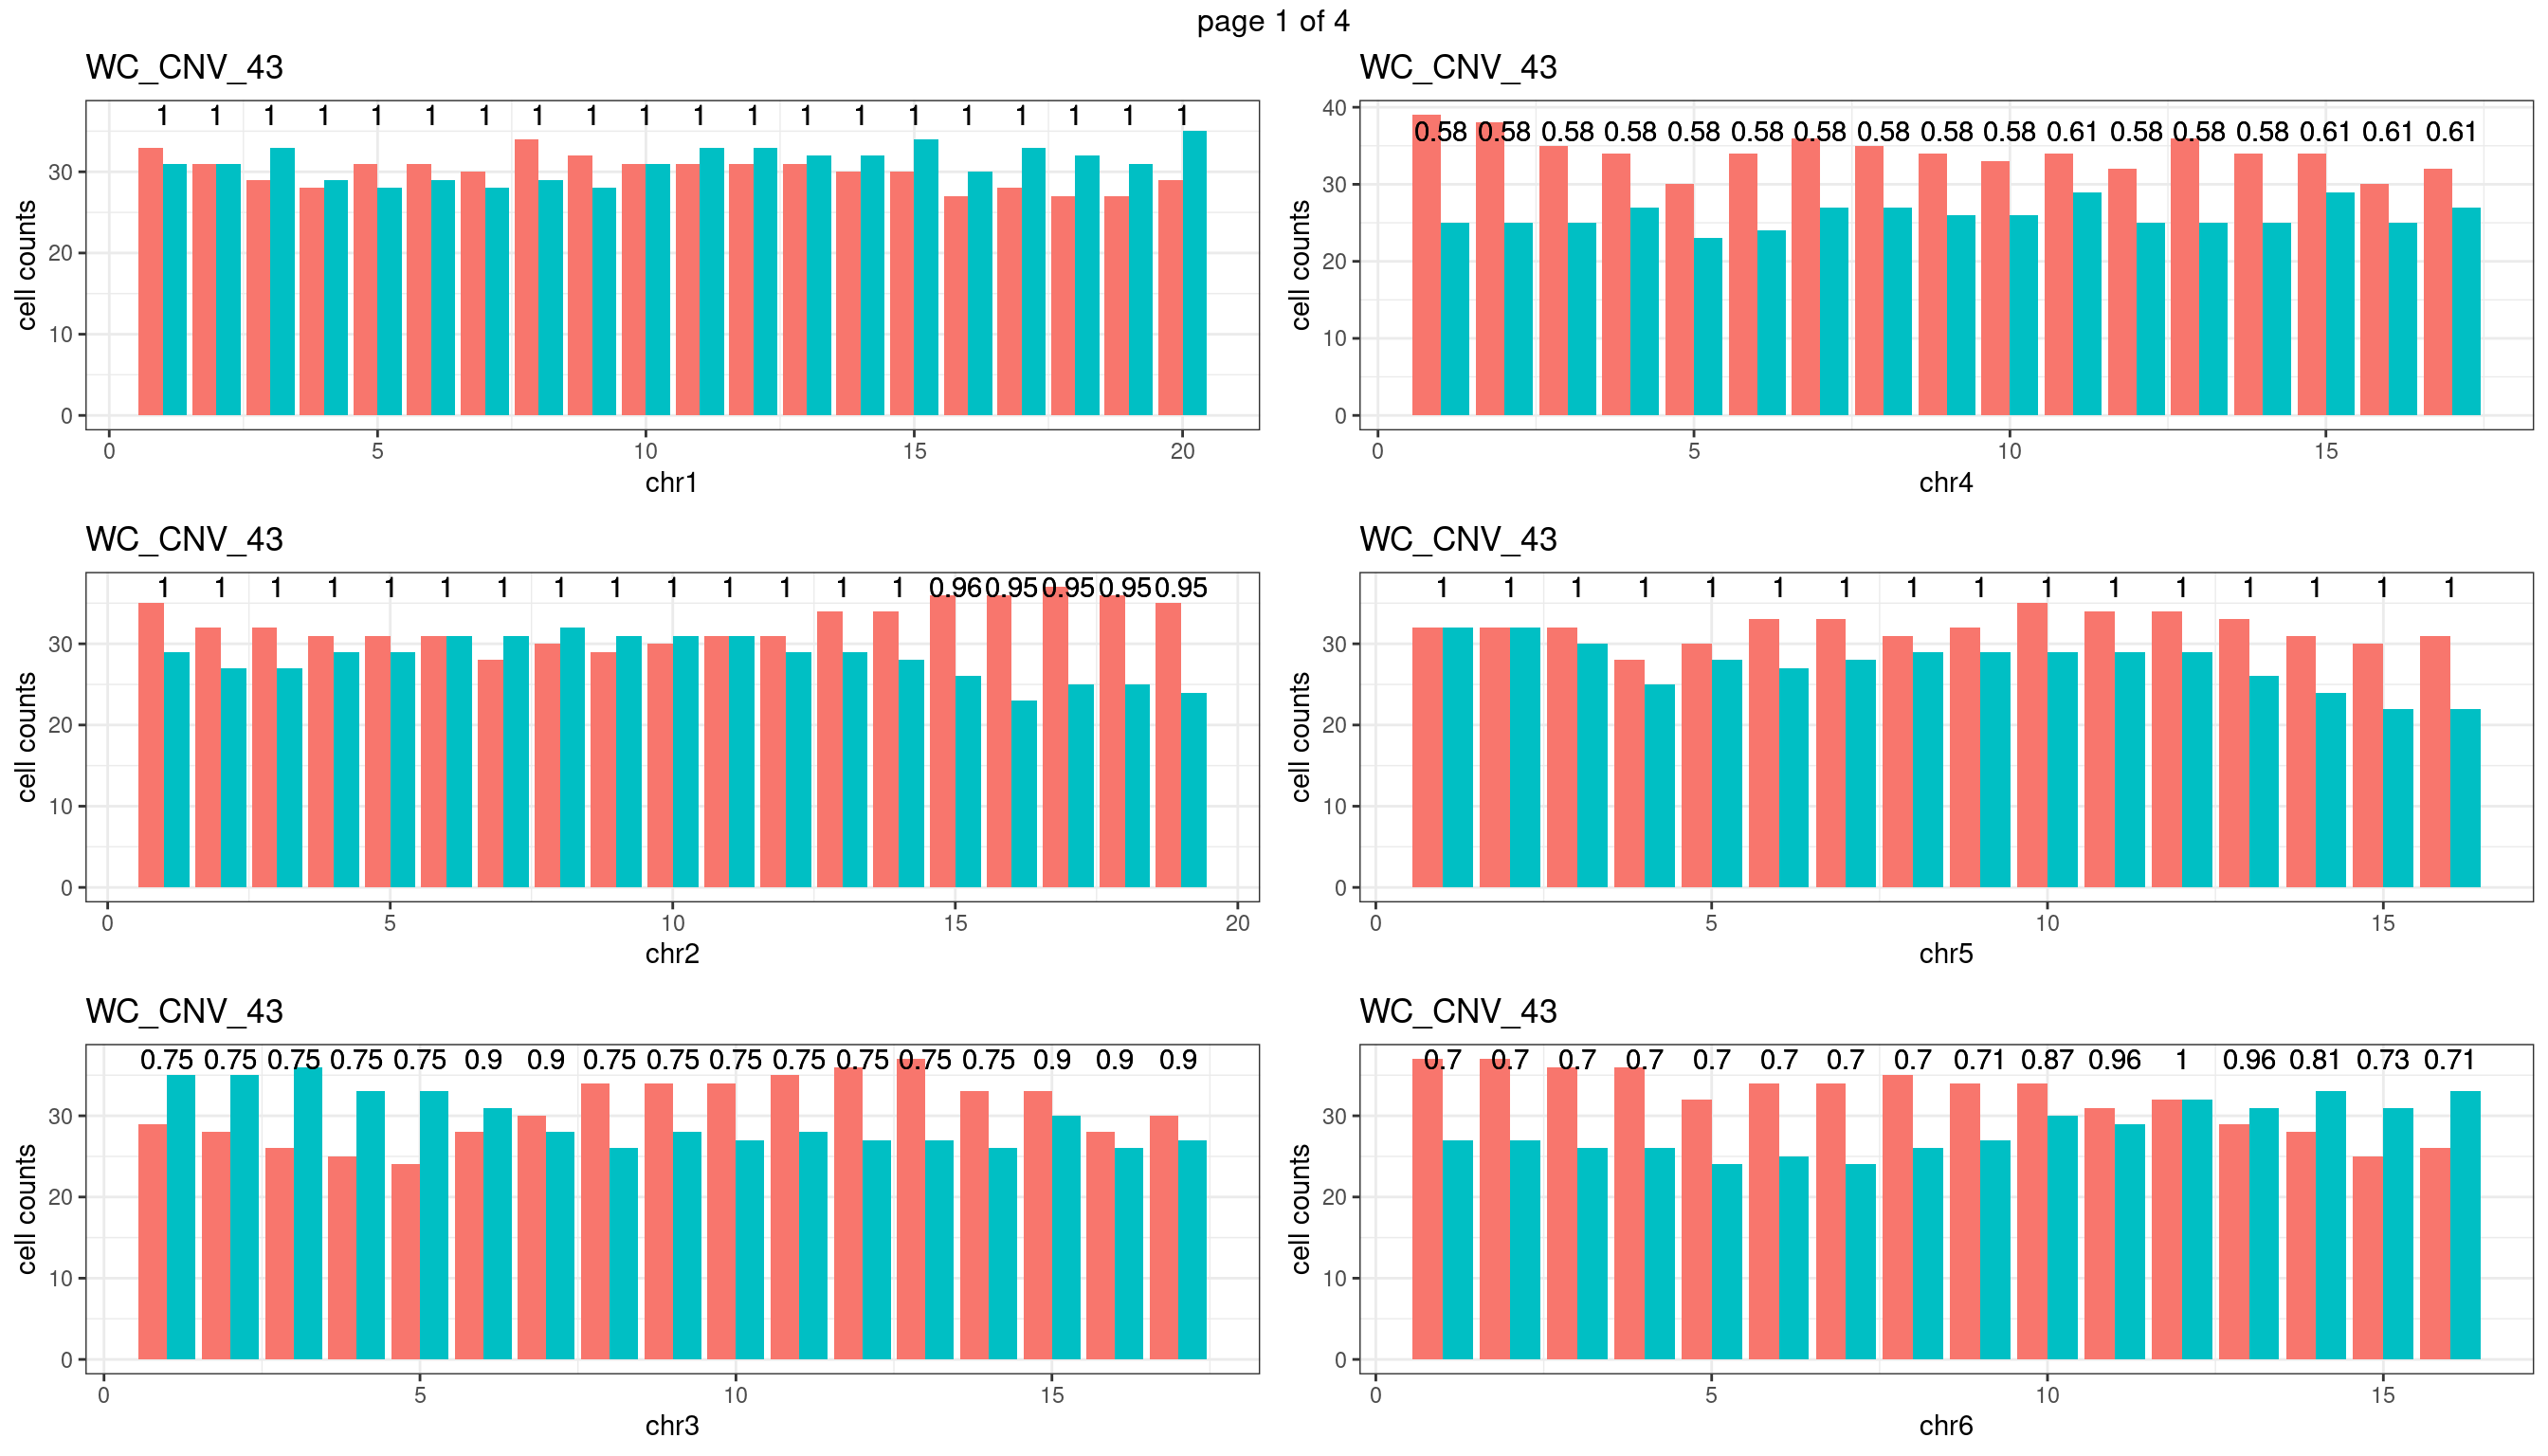
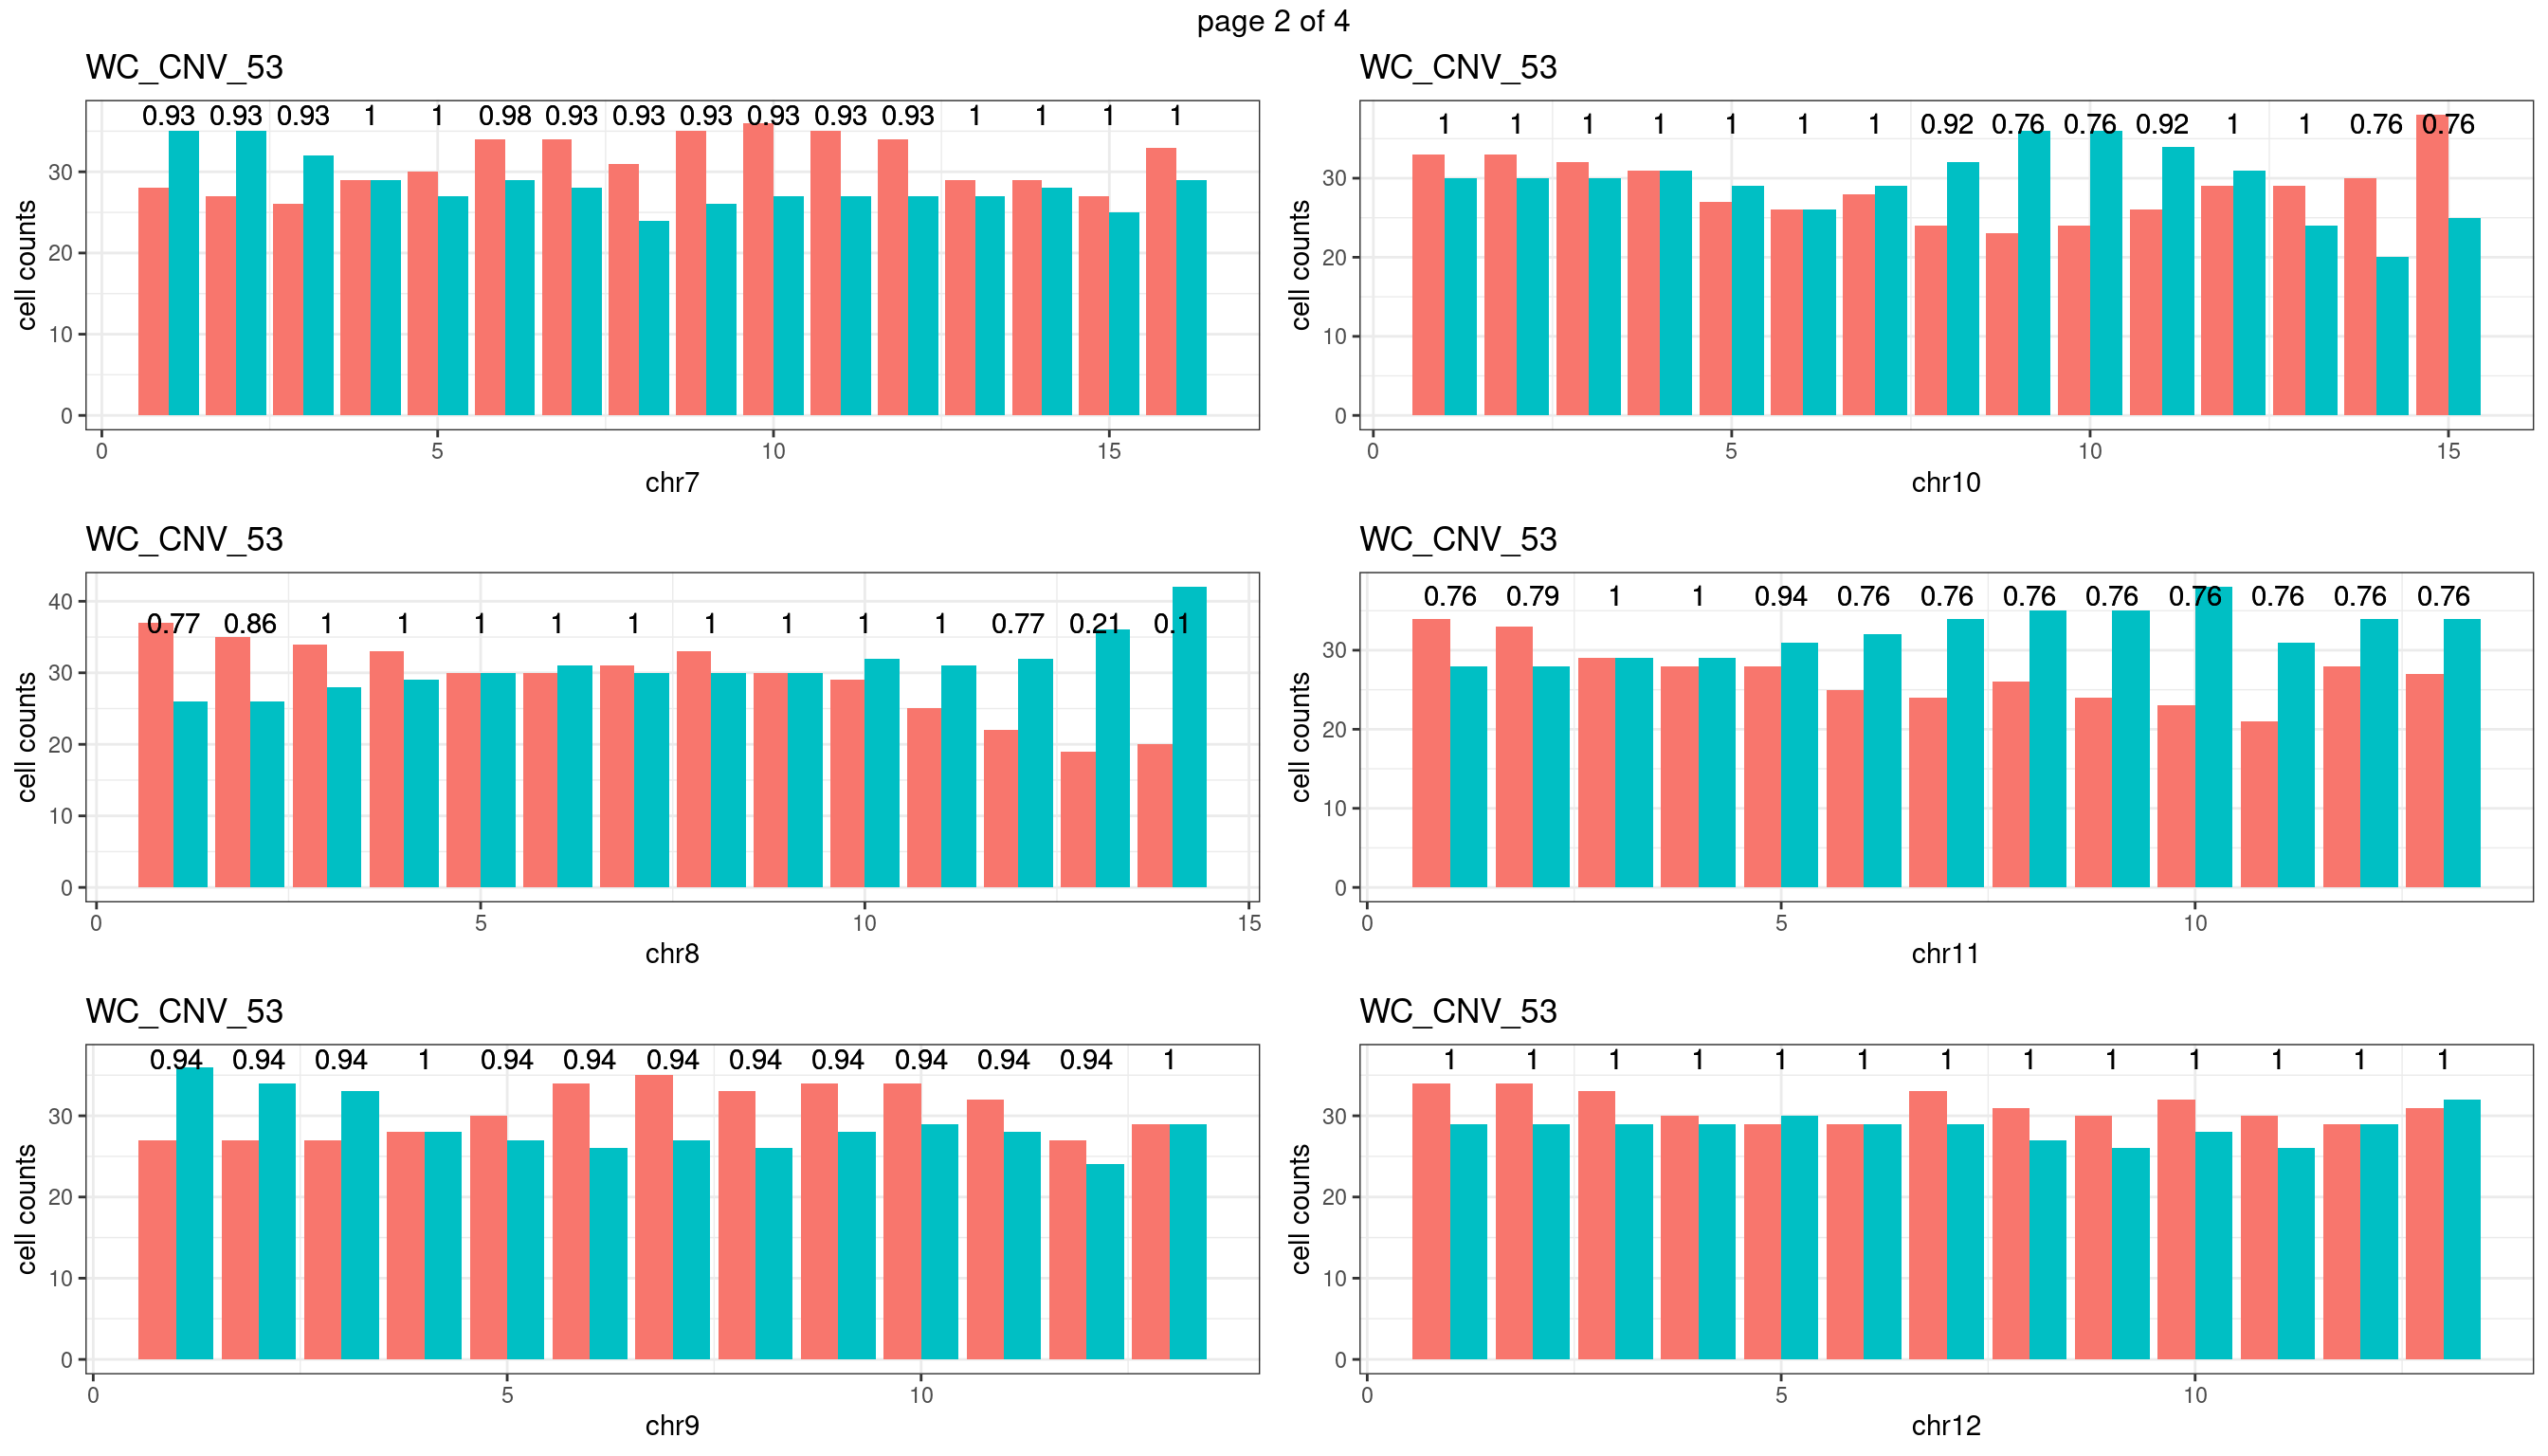
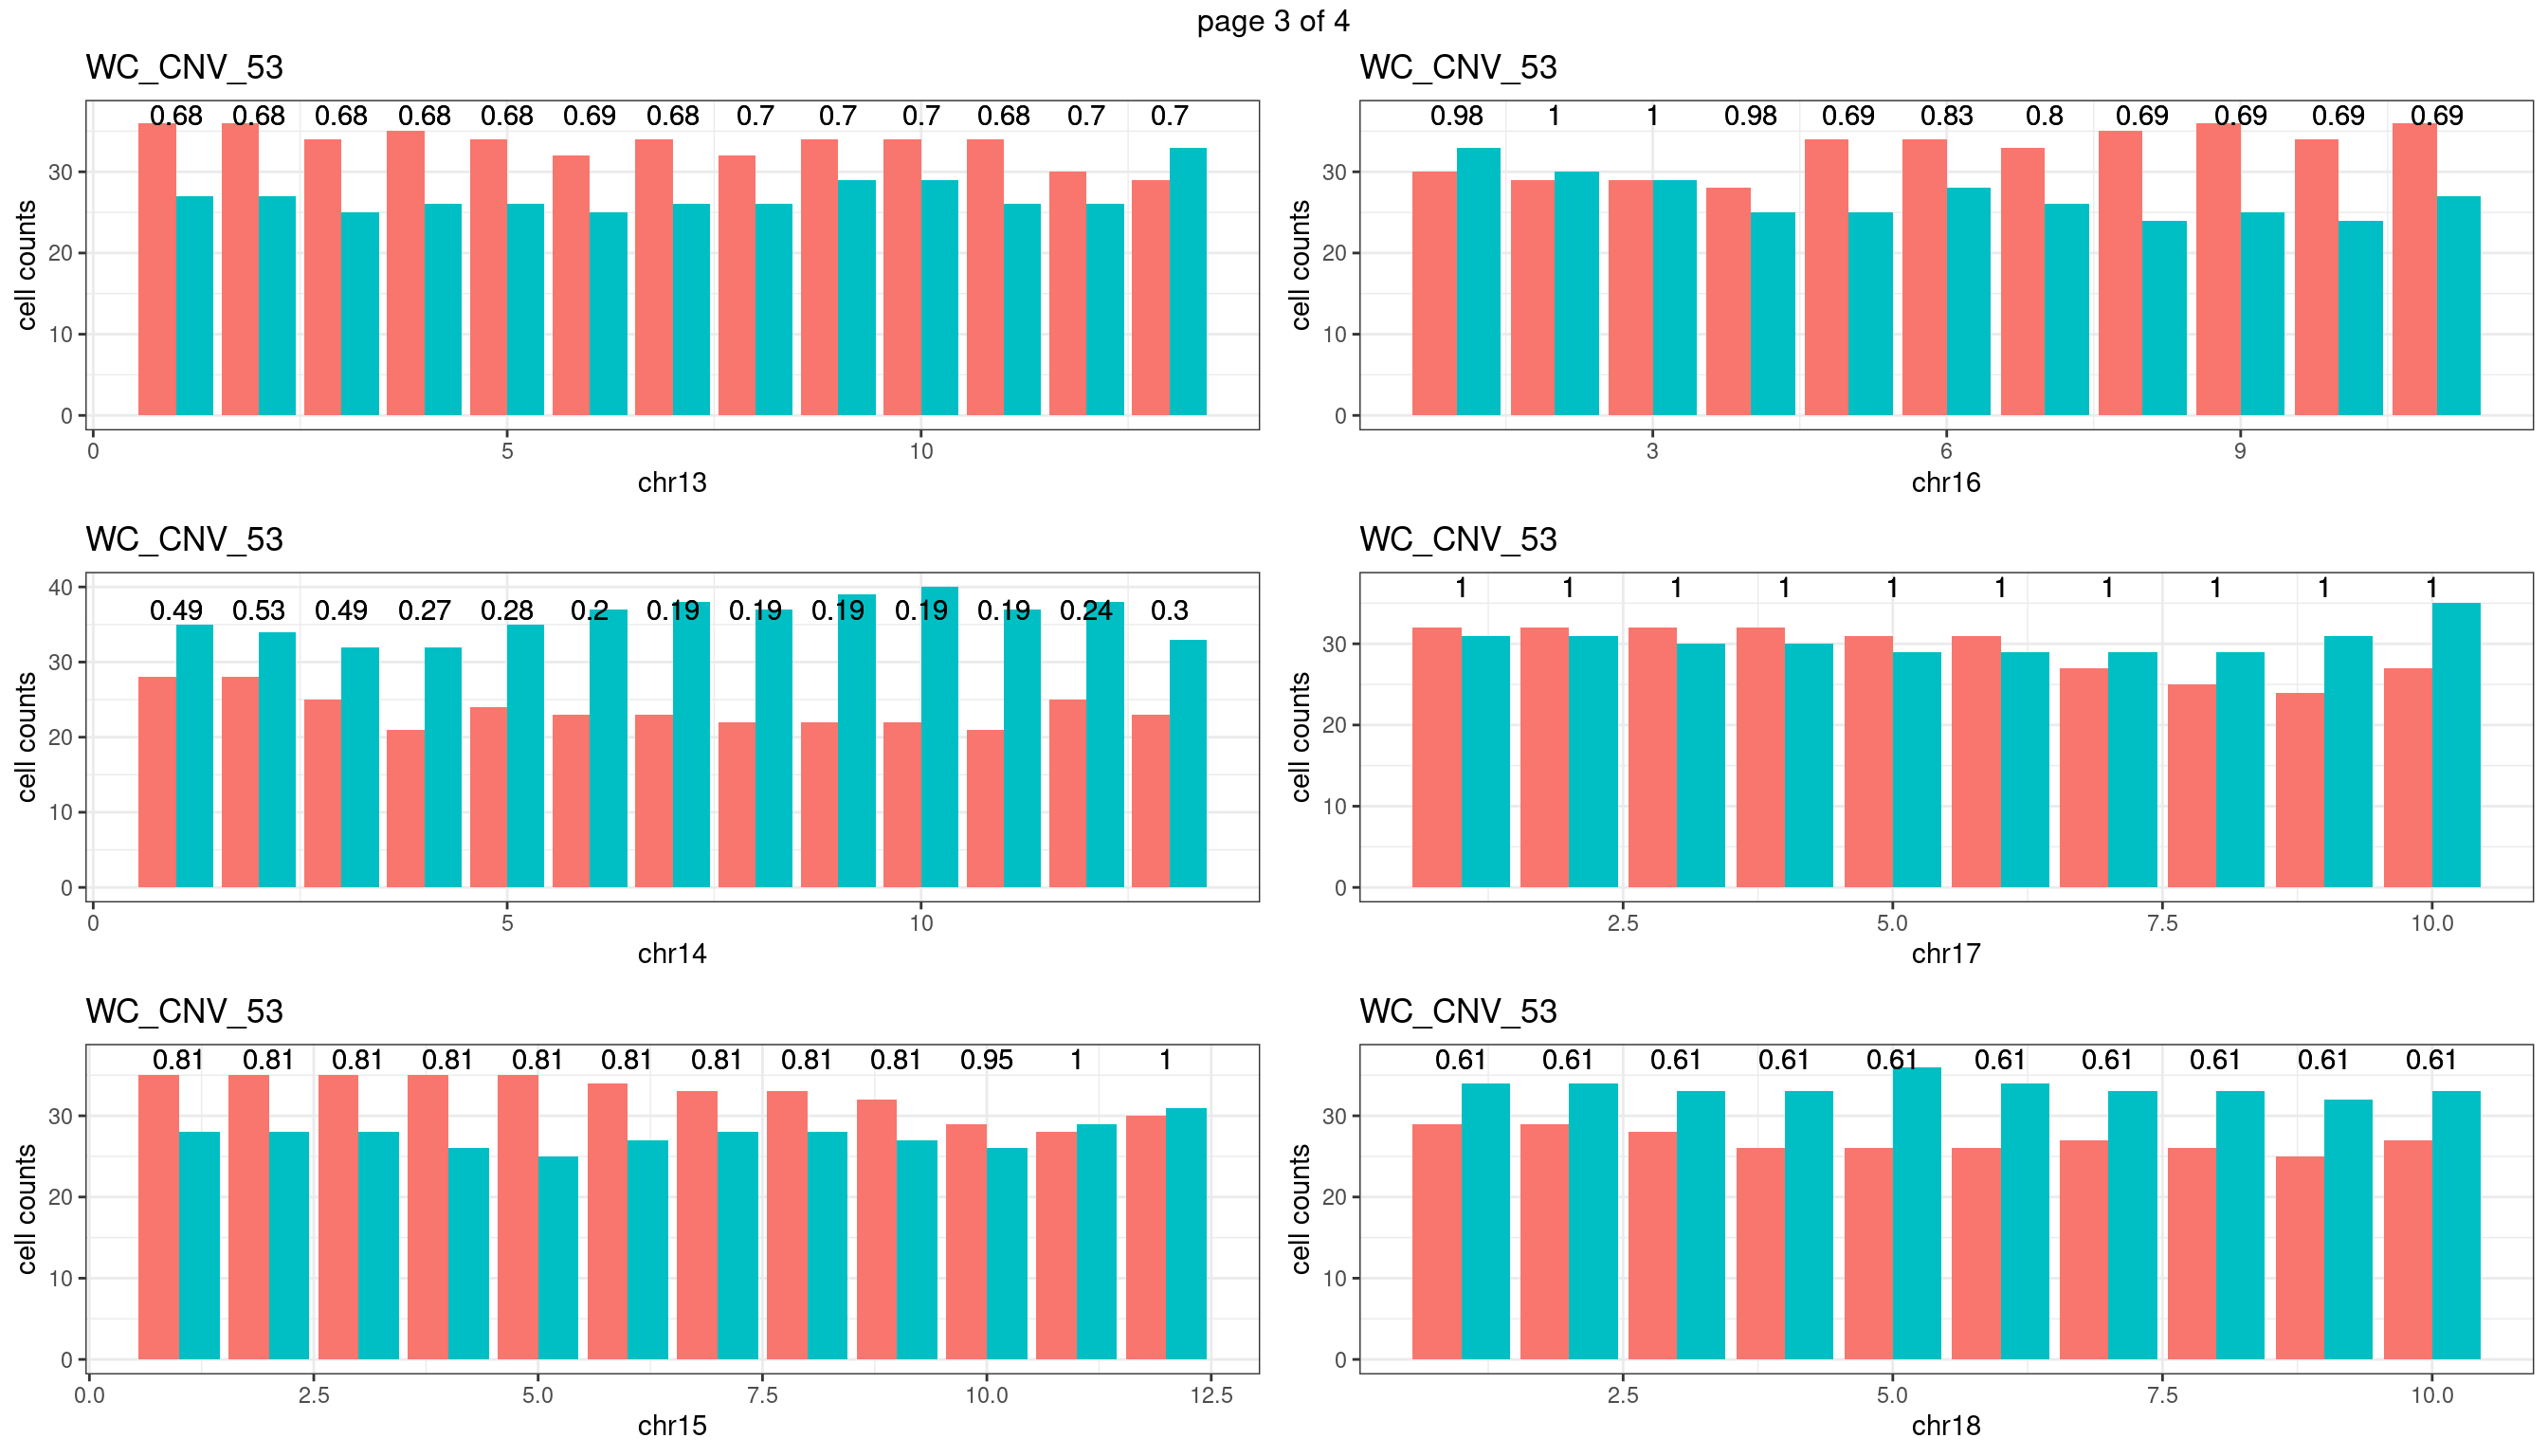
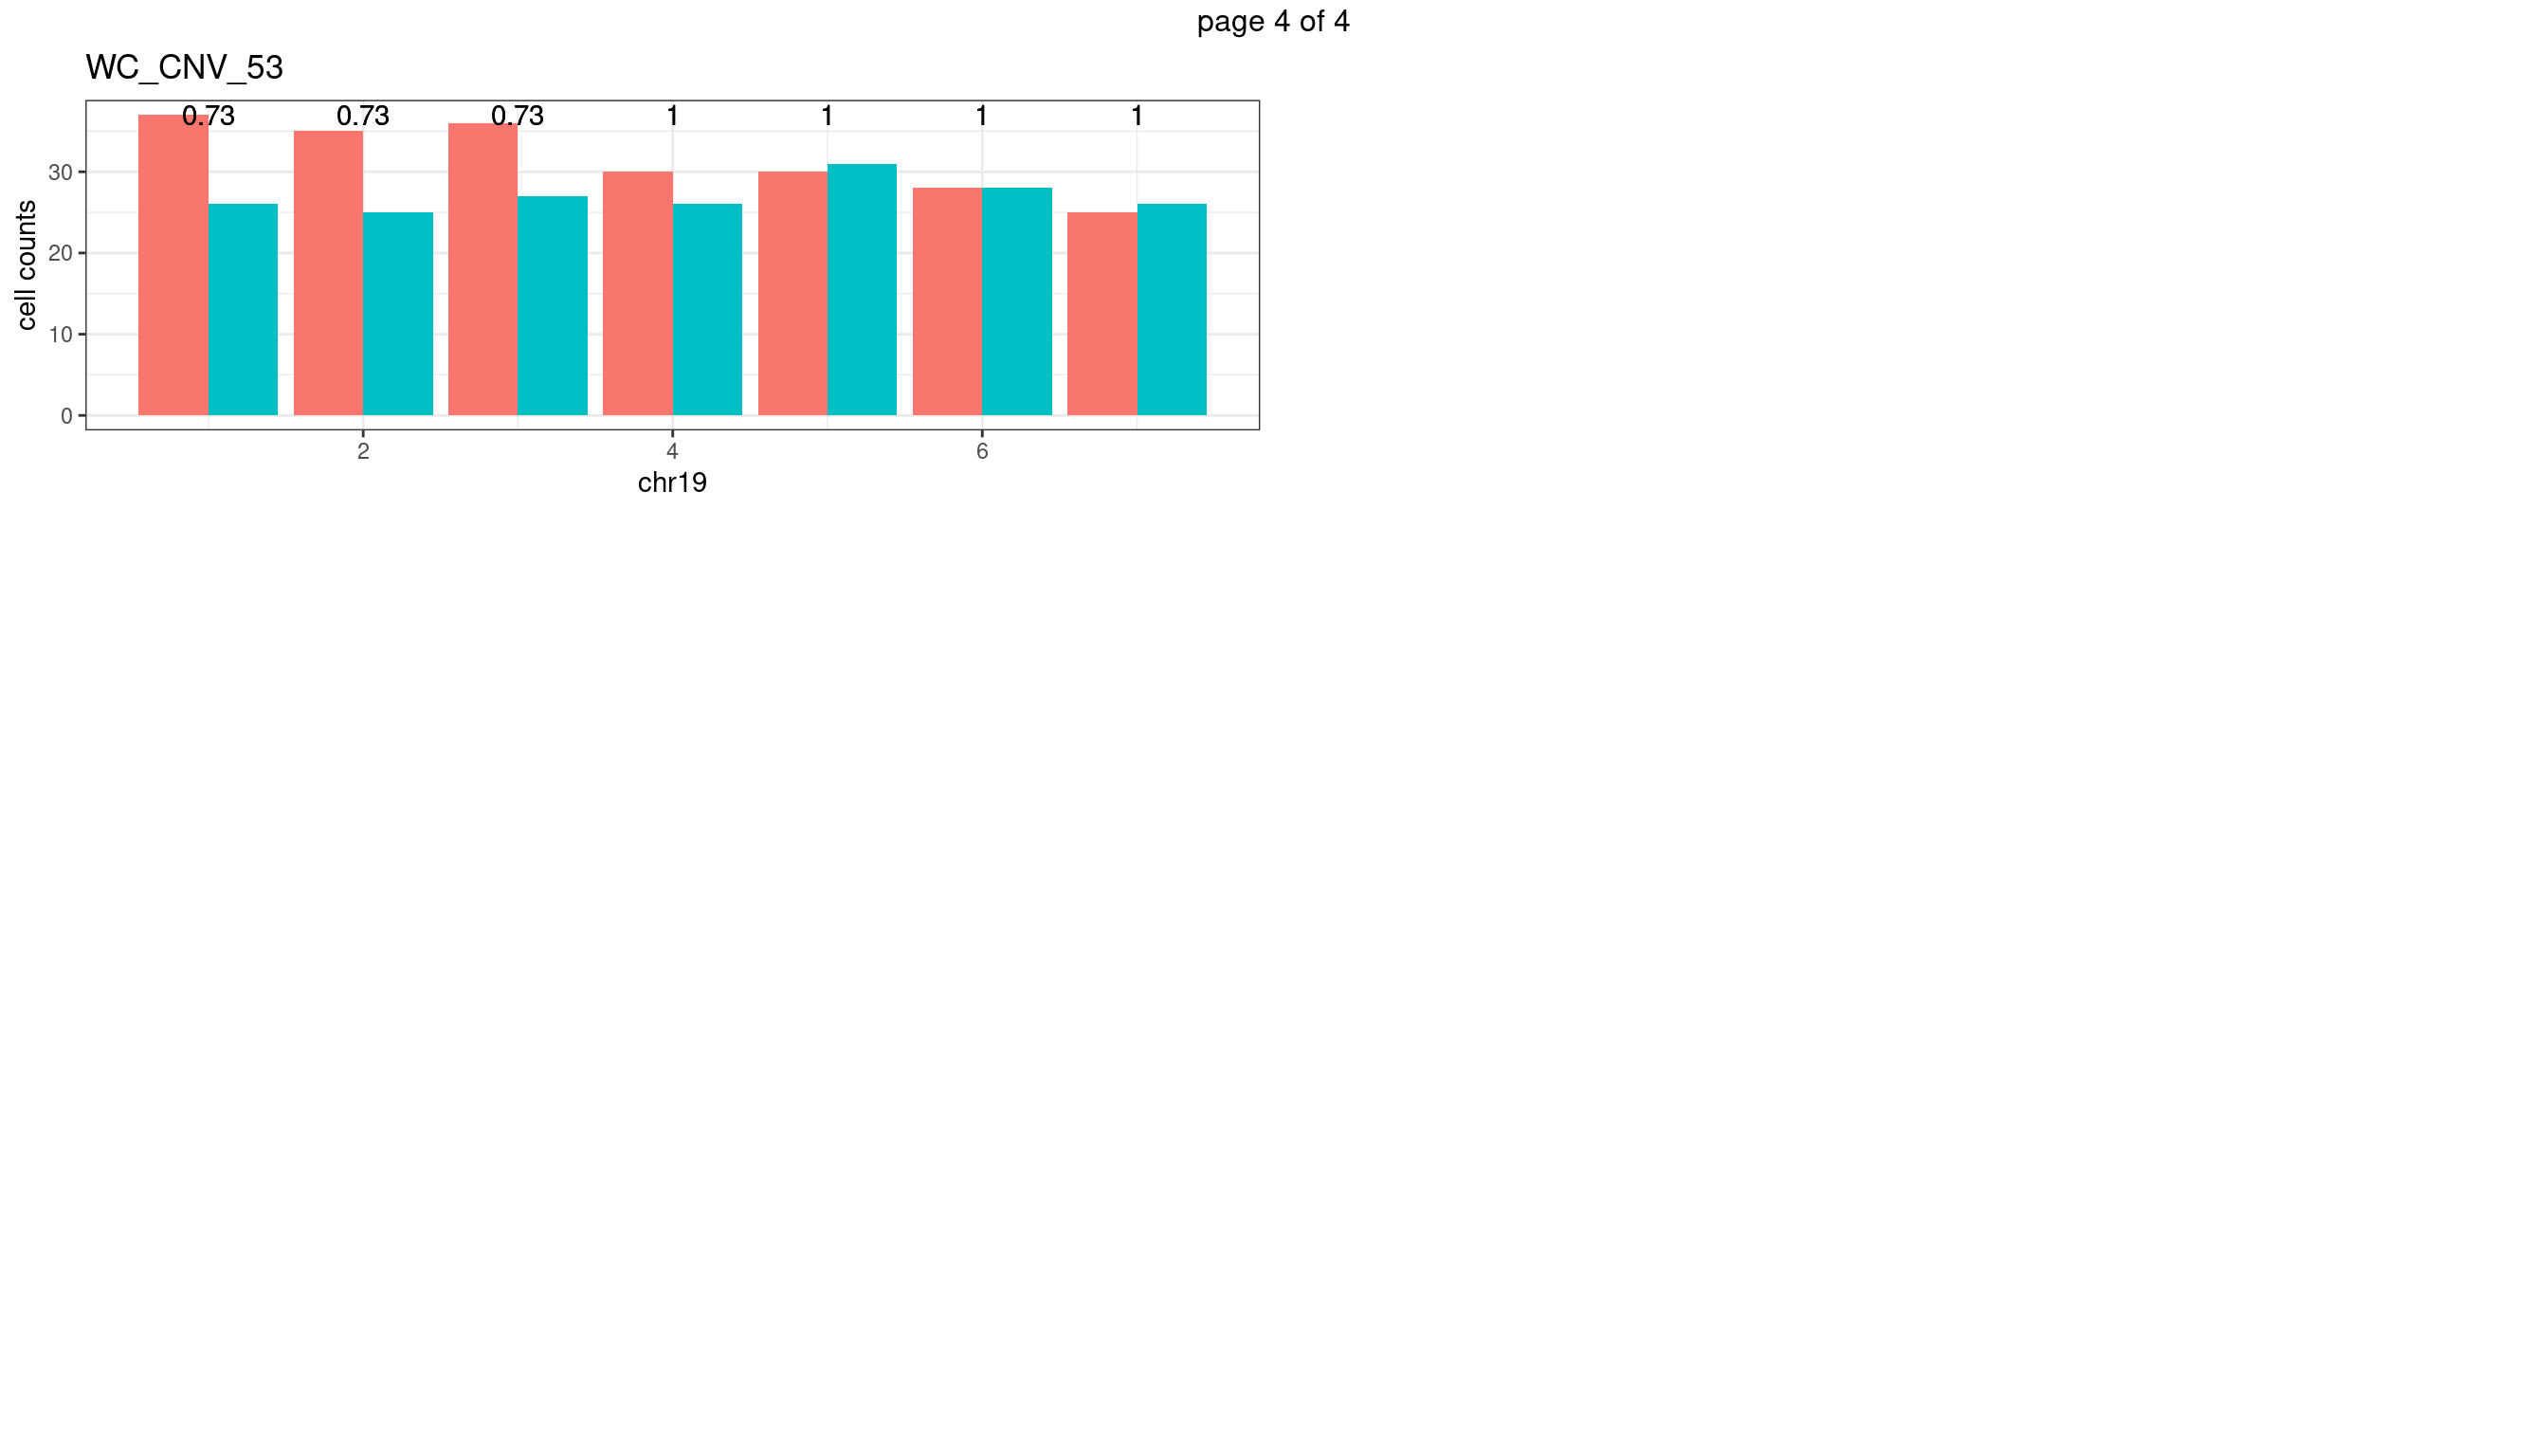
WC_CNV_53
sampleName <- "WC_CNV_53"
plots_list <- list()
for(chrName in paste0("chr",1:19)){
  bin_state_gr <- readRDS(paste0("./output/outputR/analysisRDS/",sampleName,"_",
                          chrName,"bin_state_gr-mar_2022.rds"))

s1_counts <- rowSums(data.frame(mcols(bin_state_gr),check.names = F)=="s1",na.rm=T)
s2_counts <- rowSums(data.frame(mcols(bin_state_gr),check.names = F)=="s2",na.rm=T)
bins_pvals <- lapply(seq(s1_counts), function(i){
  btest <- binom.test(c(s1_counts[i],s2_counts[i]))
  btest$p.value
})

plot_df <- data.frame(s1_count = s1_counts,
                      s2_count = s2_counts,
                      bin_id = seq(length(bins_pvals)),
                      biom_pvals = unlist(bins_pvals),
                      fdr = p.adjust(unlist(bins_pvals),method = "fdr"))

p <- plot_df %>% tidyr::pivot_longer(c("s1_count","s2_count")) %>% ggplot() +
  geom_bar(aes(x = bin_id, y = value,fill = name),position = "dodge",
           stat = "identity")+
  geom_text(aes(x = bin_id,y=max(c(s1_counts,s2_counts)), label = round(fdr,2)))+
  xlab(chrName)+ylab("cell counts")+theme_bw()+ggtitle(sampleName)
plots_list[[chrName]] <- p+guides(fill = "none" )
}
mChrThresPlots <- marrangeGrob(plots_list, nrow=3, ncol=2)
mChrThresPlots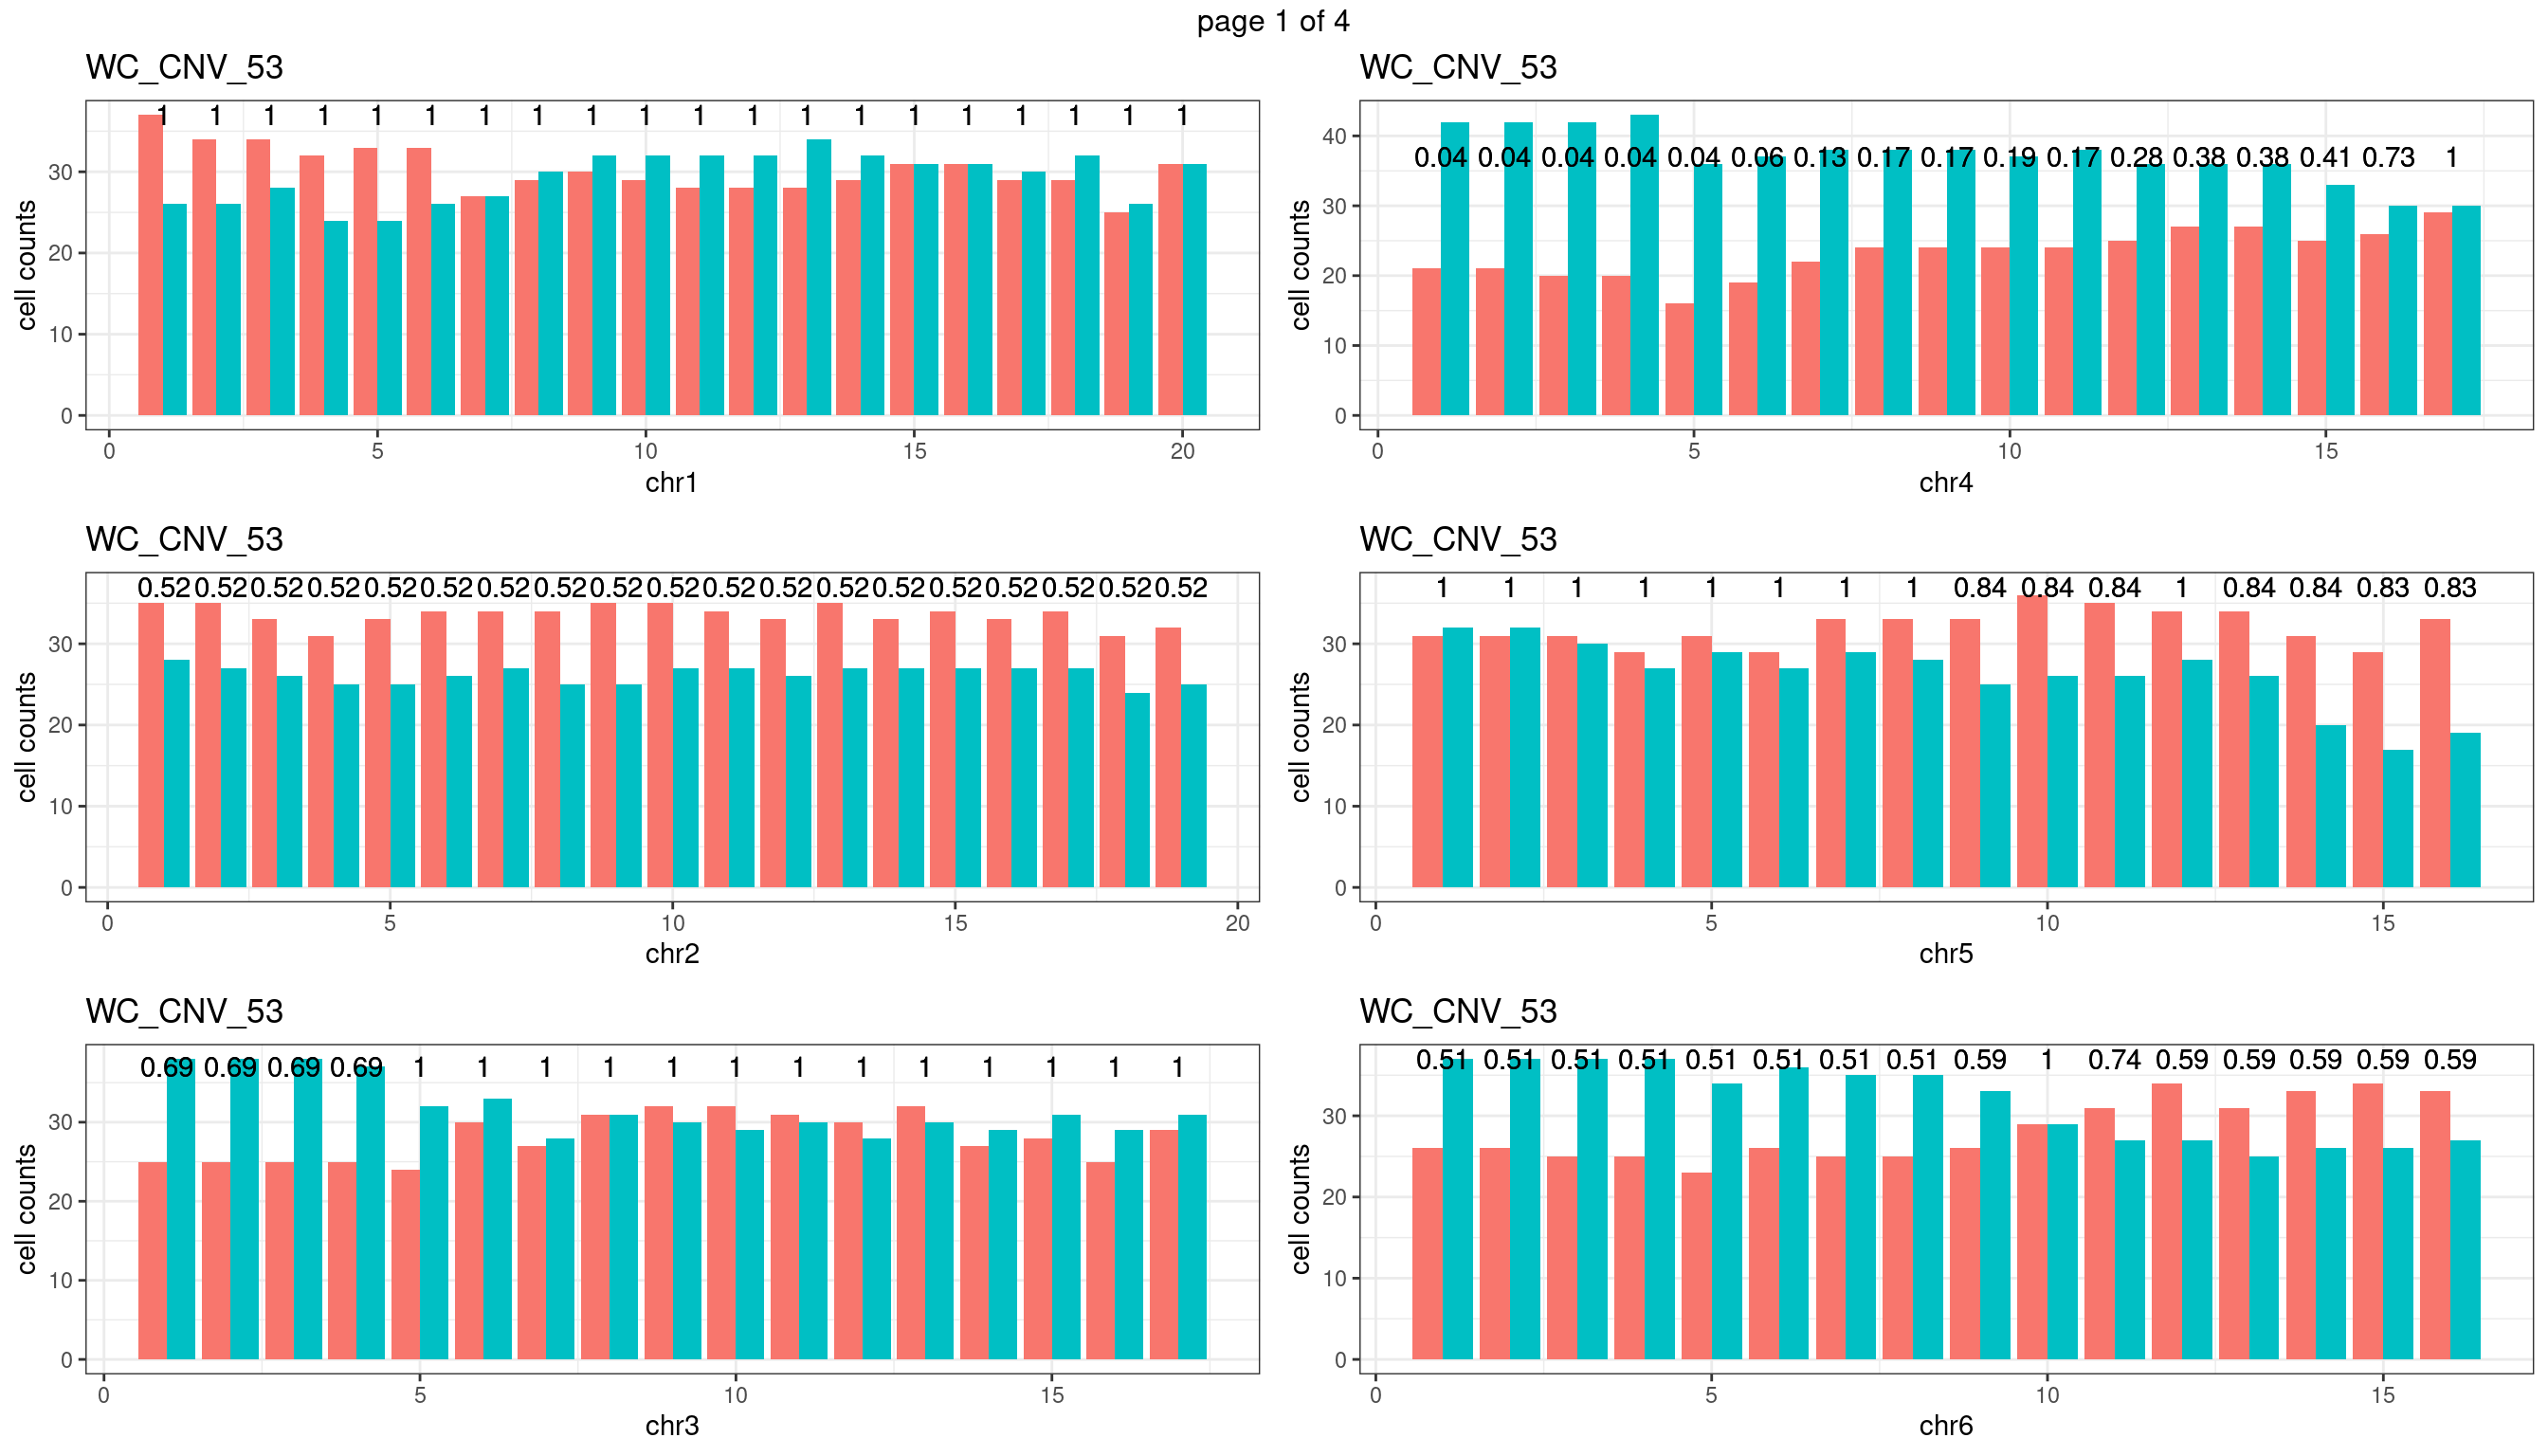
Aggregate all cells from mutant mouse individuals
mutant_samples <- c("WC_522","WC_526","WC_CNV_43")#sampleName <- "WC_CNV_44"
plots_list <- list()
bins_pvals_list <- list()
for(chrName in paste0("chr",1:19)){
bin_state_gr <- lapply(mutant_samples,function(sampleName){
readRDS(paste0("./output/outputR/analysisRDS/",sampleName,"_",
chrName,"bin_state_gr-mar_2022.rds"))
})
merged_mcols <- do.call(cbind,lapply(bin_state_gr, mcols))
s1_counts <- rowSums(data.frame(merged_mcols,check.names = F)=="s1",na.rm=T)
s2_counts <- rowSums(data.frame(merged_mcols,check.names = F)=="s2",na.rm=T)
bins_pvals <- lapply(seq(s1_counts), function(i){
btest <- binom.test(c(s1_counts[i],s2_counts[i]))
btest$p.value
})
plot_df <- data.frame(s1_count = s1_counts,
s2_count = s2_counts,
bin_id = seq(length(bins_pvals)),
biom_pvals = unlist(bins_pvals),
fdr = p.adjust(unlist(bins_pvals),method = "fdr"))
# p <- plot_df %>% tidyr::pivot_longer(c("s1_count","s2_count")) %>% ggplot() +
# geom_bar(aes(x = bin_id, y = value,fill = name),position = "dodge",
# stat = "identity")+
# geom_text(aes(x = bin_id,y=max(c(s1_counts,s2_counts)), label = round(fdr,2)))+
# xlab(chrName)+ylab("cell counts")+theme_bw()+ggtitle("mutant")
p <- plot_df %>% mutate(hap_ratio = s1_count /(s1_count +s2_count )) %>% ggplot() +
geom_point(aes(x = bin_id, y = hap_ratio))+geom_hline(mapping = aes(yintercept = 0.5),linetype="dotted")+
# geom_text(aes(x = bin_id,y=max(hap_ratio)+0.1, label = round(fdr,2)))+
xlab(chrName)+ylab("cell counts")+ylim(c(0,1))+theme_bw(base_size = 18)+ggtitle("mutant")
plots_list[[chrName]] <- p+guides(fill = "none" )
bins_pvals_list[[chrName]] <- bins_pvals
}
message(mutant_samples, " number of bins with FDR < 0.05: ",
sum(p.adjust(unlist(bins_pvals_list),"fdr")<0.05))WC_522WC_526WC_CNV_43 number of bins with FDR < 0.05: 0notitle_p <- lapply(plots_list, function(x) x +ggtitle("")+ylab("")+
theme(plot.margin = unit(c(0.00,0.00,-0.02,0.00), "cm")))
mChrThresPlots <- marrangeGrob(notitle_p, ncol=7,nrow=3,
left = textGrob("Haplotype state ratio",
rot = 90,gp = gpar(fontsize=22)),
layout_matrix = matrix(c(1:19,NA,NA), 3, 7, TRUE),
right= " ")
mChrThresPlots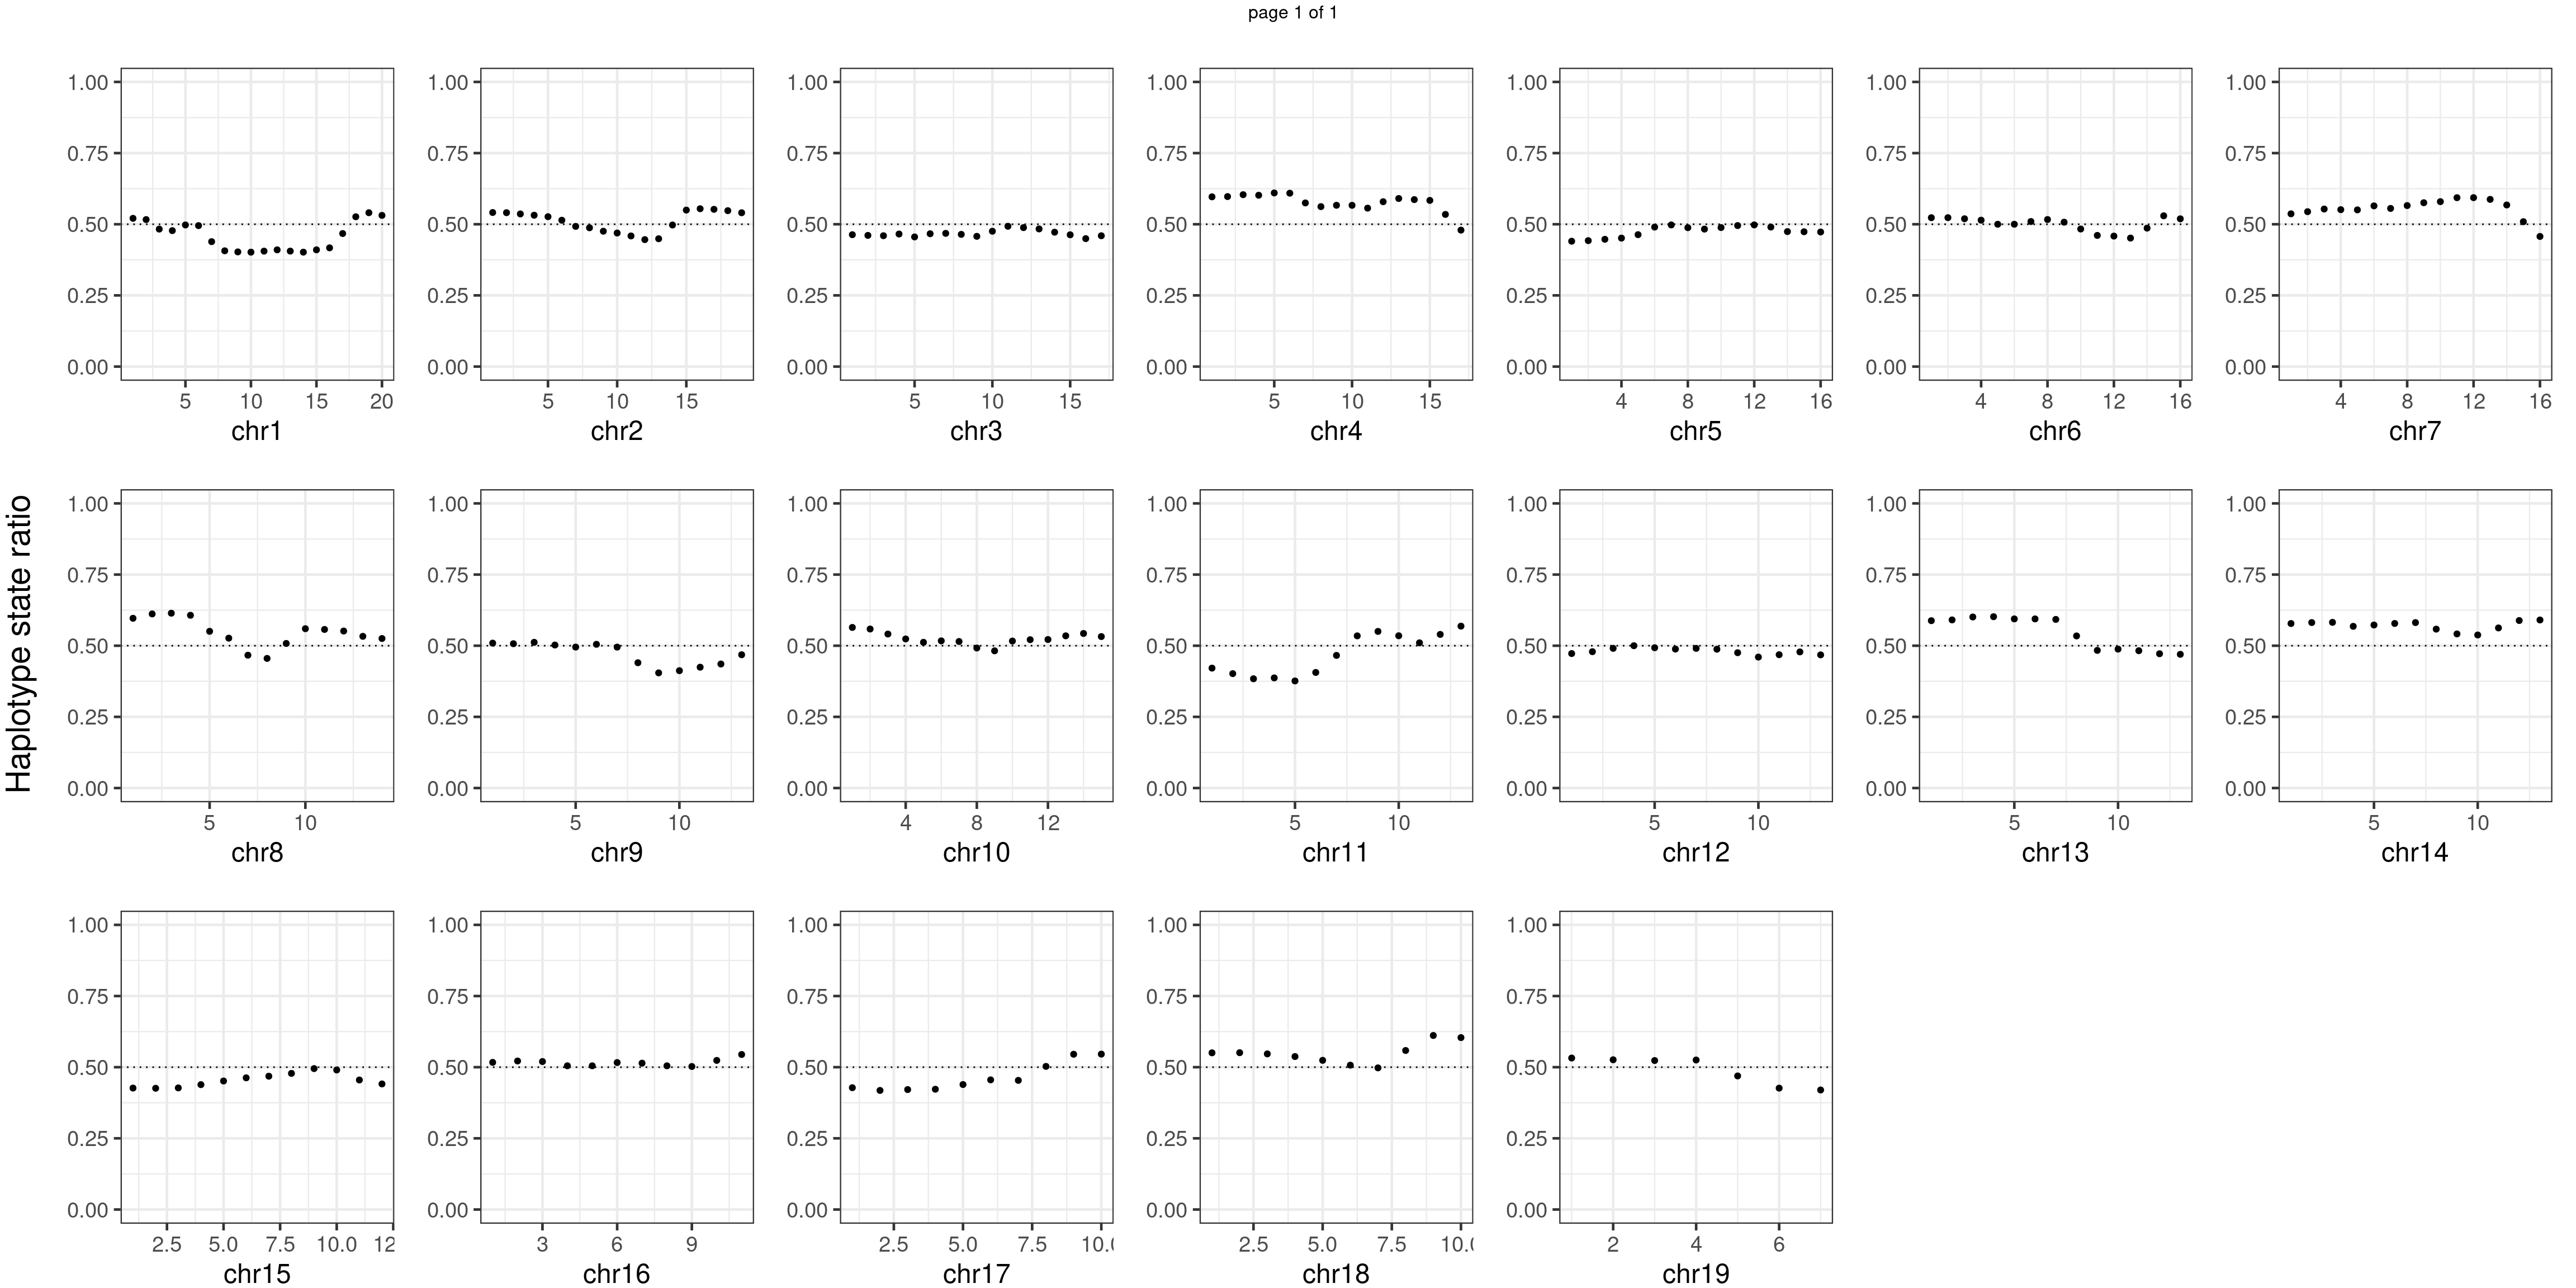
Aggregate all cells from wildtype mouse individuals
wildtype_samples <- c("WC_CNV_42","WC_CNV_44","WC_CNV_53")
plots_list <- list()
bins_pvals_list <- list()

for(chrName in paste0("chr",1:19)){
  bin_state_gr <- lapply(wildtype_samples,function(sampleName){
    readRDS(paste0("./output/outputR/analysisRDS/",sampleName,"_",
                          chrName,"bin_state_gr-mar_2022.rds"))
  })
 merged_mcols <- do.call(cbind,lapply(bin_state_gr, mcols))

s1_counts <- rowSums(data.frame(merged_mcols,check.names = F)=="s1",na.rm=T)
s2_counts <- rowSums(data.frame(merged_mcols,check.names = F)=="s2",na.rm=T)
bins_pvals <- lapply(seq(s1_counts), function(i){
  btest <- binom.test(c(s1_counts[i],s2_counts[i]))
  btest$p.value
})

plot_df <- data.frame(s1_count = s1_counts,
                      s2_count = s2_counts,
                      bin_id = seq(length(bins_pvals)),
                      biom_pvals = unlist(bins_pvals),
                      fdr = p.adjust(unlist(bins_pvals),method = "fdr"))


# p <- plot_df %>% tidyr::pivot_longer(c("s1_count","s2_count")) %>% ggplot() +
#   geom_bar(aes(x = bin_id, y = value,fill = name),position = "dodge",
#            stat = "identity")+
#   geom_text(aes(x = bin_id,y=max(c(s1_counts,s2_counts)), label = round(fdr,2)))+
#   xlab(chrName)+ylab("cell counts")+theme_bw()+ggtitle("mutant")

p <- plot_df %>% mutate(hap_ratio = s1_count /(s1_count +s2_count )) %>% ggplot() +
  geom_point(aes(x = bin_id, y = hap_ratio))+geom_hline(mapping = aes(yintercept = 0.5),linetype="dotted")+
#  geom_text(aes(x = bin_id,y=max(hap_ratio)+0.1, label = round(fdr,2)))+
  xlab(chrName)+ylab("cell counts")+ylim(c(0,1))+theme_bw(base_size = 18)+ggtitle("mutant")

plots_list[[chrName]] <- p+guides(fill = "none" )
bins_pvals_list[[chrName]] <- bins_pvals
}

message(wildtype_samples, " number of bins with FDR < 0.05: ",
        sum(p.adjust(unlist(bins_pvals_list),"fdr")<0.05))
WC_CNV_42WC_CNV_44WC_CNV_53 number of bins with FDR < 0.05: 0notitle_p <- lapply(plots_list, function(x) x +ggtitle("")+ylab("")+theme(plot.margin = unit(c(0.00,0.00,-0.02,0.00), "cm")))
mChrThresPlots <- marrangeGrob(notitle_p, ncol=7,nrow=3,
left = textGrob("Haplotype state ratio",
rot = 90,gp = gpar(fontsize=22)),
layout_matrix = matrix(c(1:19,NA,NA), 3, 7, TRUE),
right= " ")
mChrThresPlots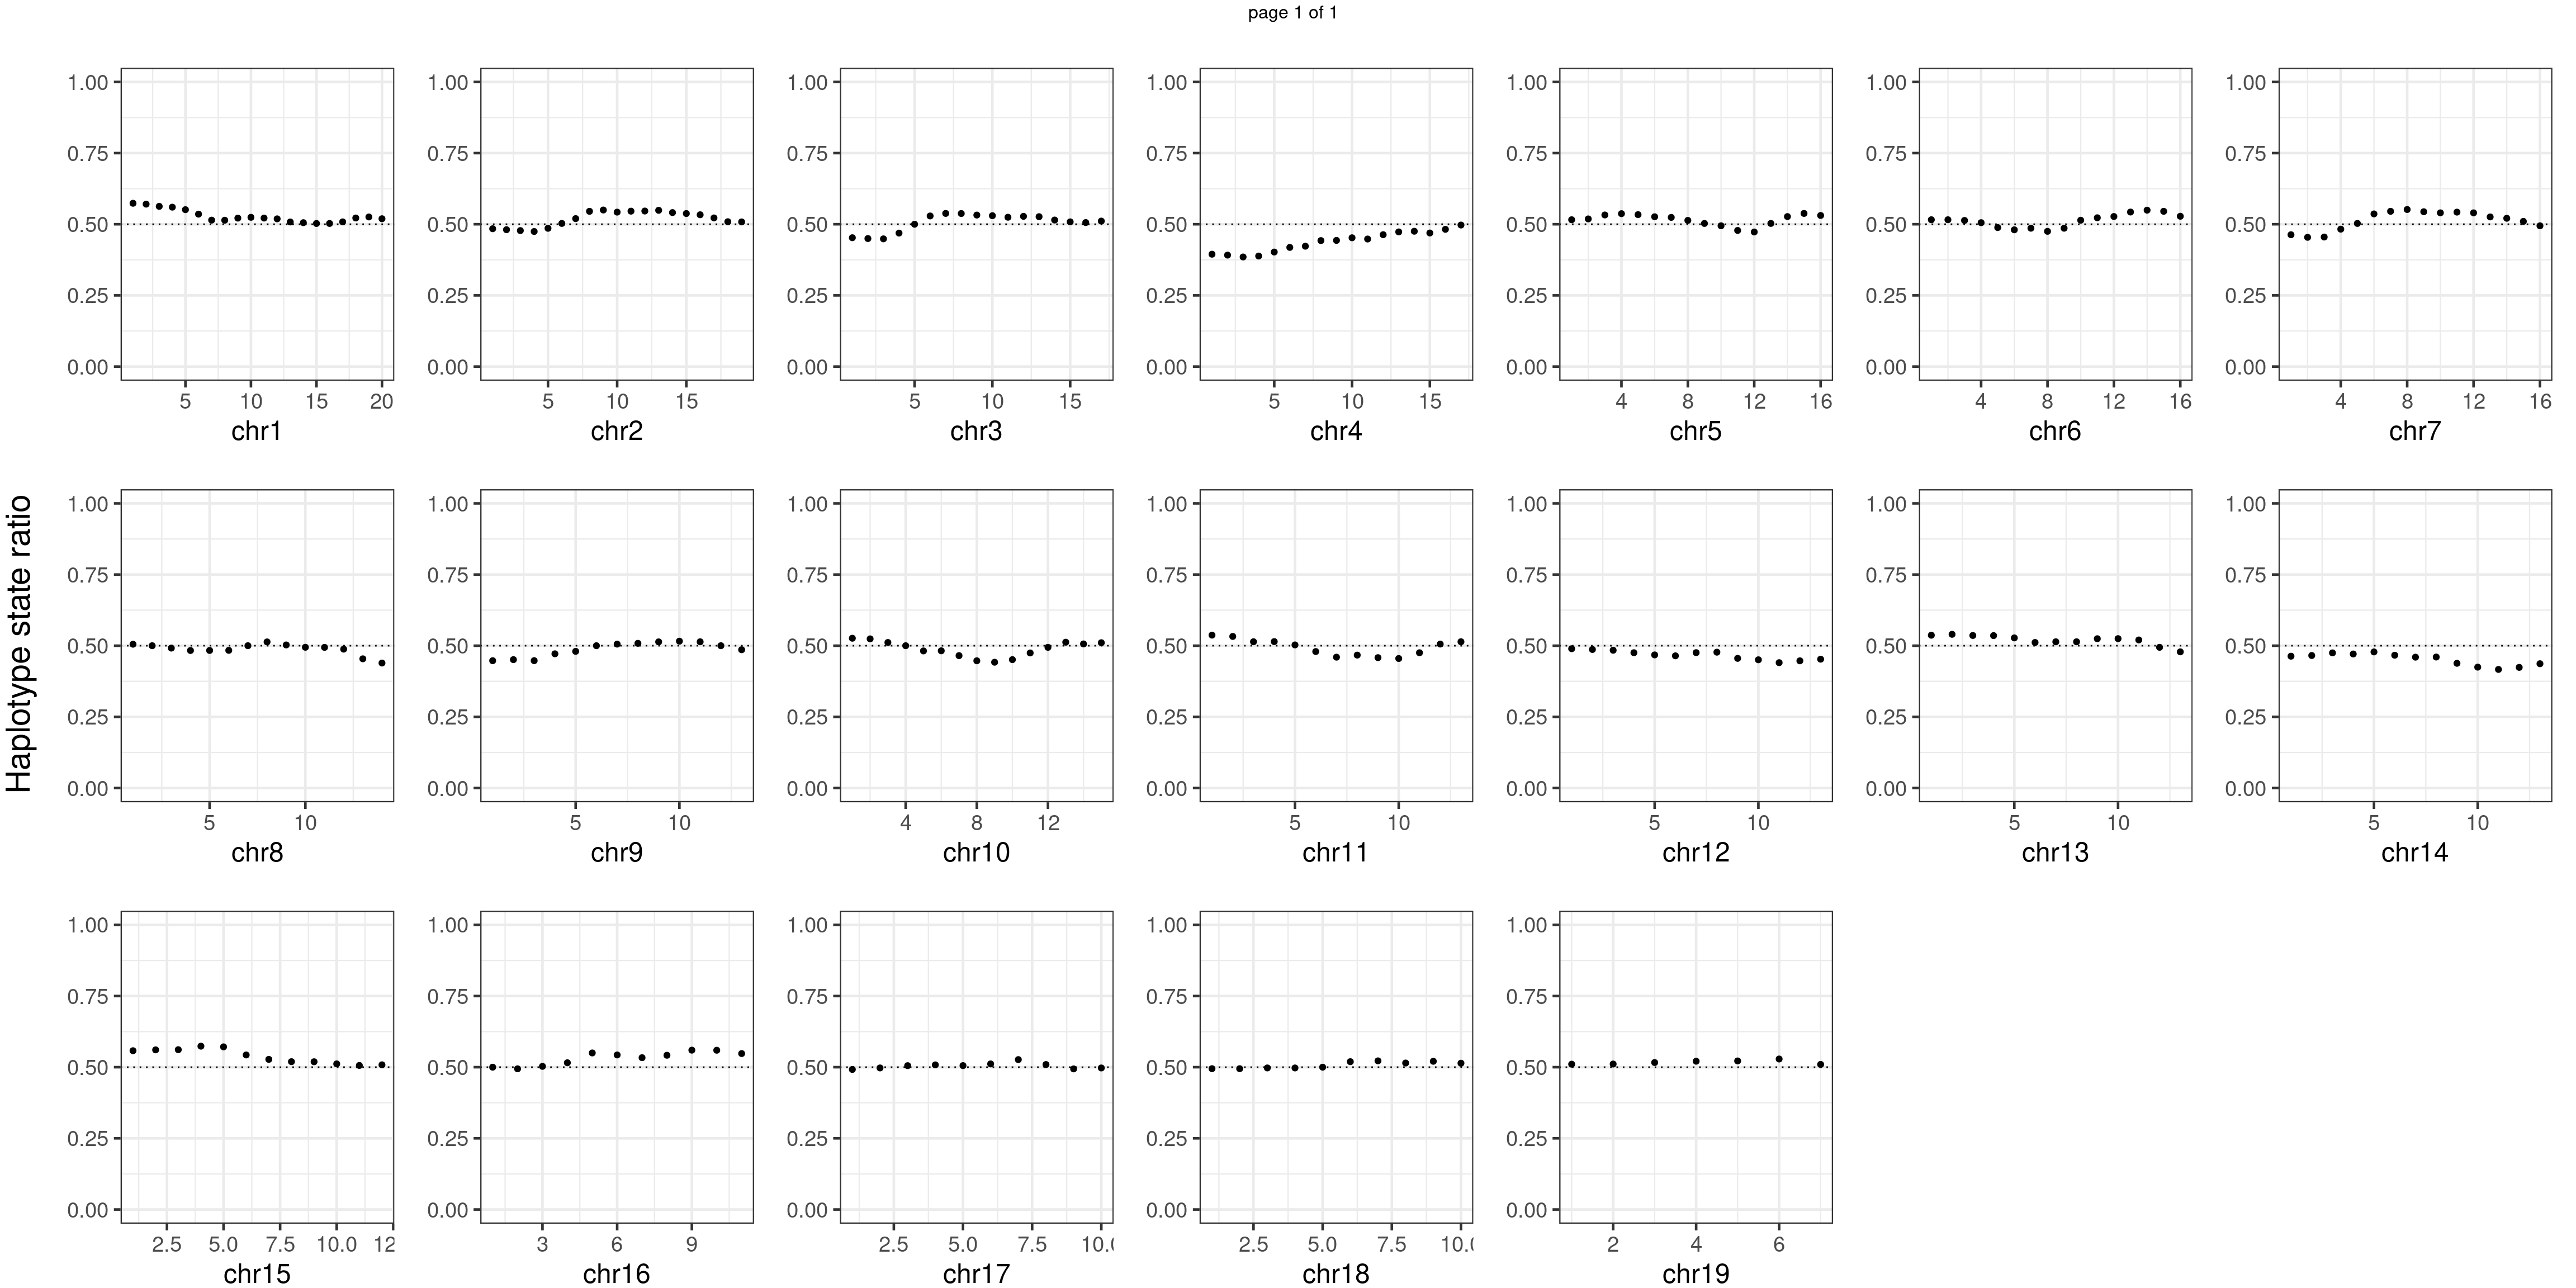
Conclusion
There is no apparent regions with imbalanced segregation among the sperm cells from mutant and sperm cells from wildtype.
BC1F1 samples
Similar idea for BC1F1 samples.
plots_list <- list()
for(chrName in paste0("chr",1:19)){
  bin_state_gr <-  readRDS(paste0("./output/outputR/analysisRDS/bc1f1_",
                          chrName,"bin_state_gr.rds"))

  s1_counts <- rowSums(data.frame(bin_state_gr,check.names = F)=="s1",na.rm=T)
  s2_counts <- rowSums(data.frame(bin_state_gr,check.names = F)=="s2",na.rm=T)
  bins_pvals <- lapply(seq(s1_counts), function(i){
    btest <- binom.test(c(s1_counts[i],s2_counts[i]))
    btest$p.value
  })
plot_df <- data.frame(s1_count = s1_counts,
                      s2_count = s2_counts,
                      bin_id = seq(length(bins_pvals)),
                      biom_pvals = unlist(bins_pvals),
                      fdr = p.adjust(unlist(bins_pvals),method = "fdr"))

# p <- plot_df %>% tidyr::pivot_longer(c("s1_count","s2_count")) %>% ggplot() +
#   geom_bar(aes(x = bin_id, y = value,fill = name),position = "dodge",
#            stat = "identity")+
#   geom_text(aes(x = bin_id,y=max(c(s1_counts,s2_counts)), label = round(fdr,2)))+
#   xlab(chrName)+ylab("cell counts")+theme_bw()+ggtitle("all bc1f1s")
p <- plot_df %>% mutate(hap_ratio = s1_count /(s1_count +s2_count )) %>% ggplot() +
  geom_point(aes(x = bin_id, y = hap_ratio))+geom_hline(mapping = aes(yintercept = 0.5),linetype="dotted")+
#  geom_text(aes(x = bin_id,y=max(hap_ratio)+0.1, label = round(fdr,2)))+
  xlab(chrName)+ylab("sample counts")+ylim(c(0,1))+theme_bw(base_size = 18)+ggtitle("all bc1f1s")

plots_list[[chrName]] <- p+guides(fill = "none" )
}
notitle_p <- lapply(plots_list, function(x) x +ggtitle("")+ylab("")+
theme(plot.margin = unit(c(0.00,0.00,-0.02,0.00), "cm")))
mChrThresPlots <- marrangeGrob(notitle_p, ncol=7,nrow=3,
left = textGrob("Haplotype state ratio",
rot = 90,gp = gpar(fontsize=22)),
layout_matrix = matrix(c(1:19,NA,NA), 3, 7, TRUE),
right= " ")
mChrThresPlots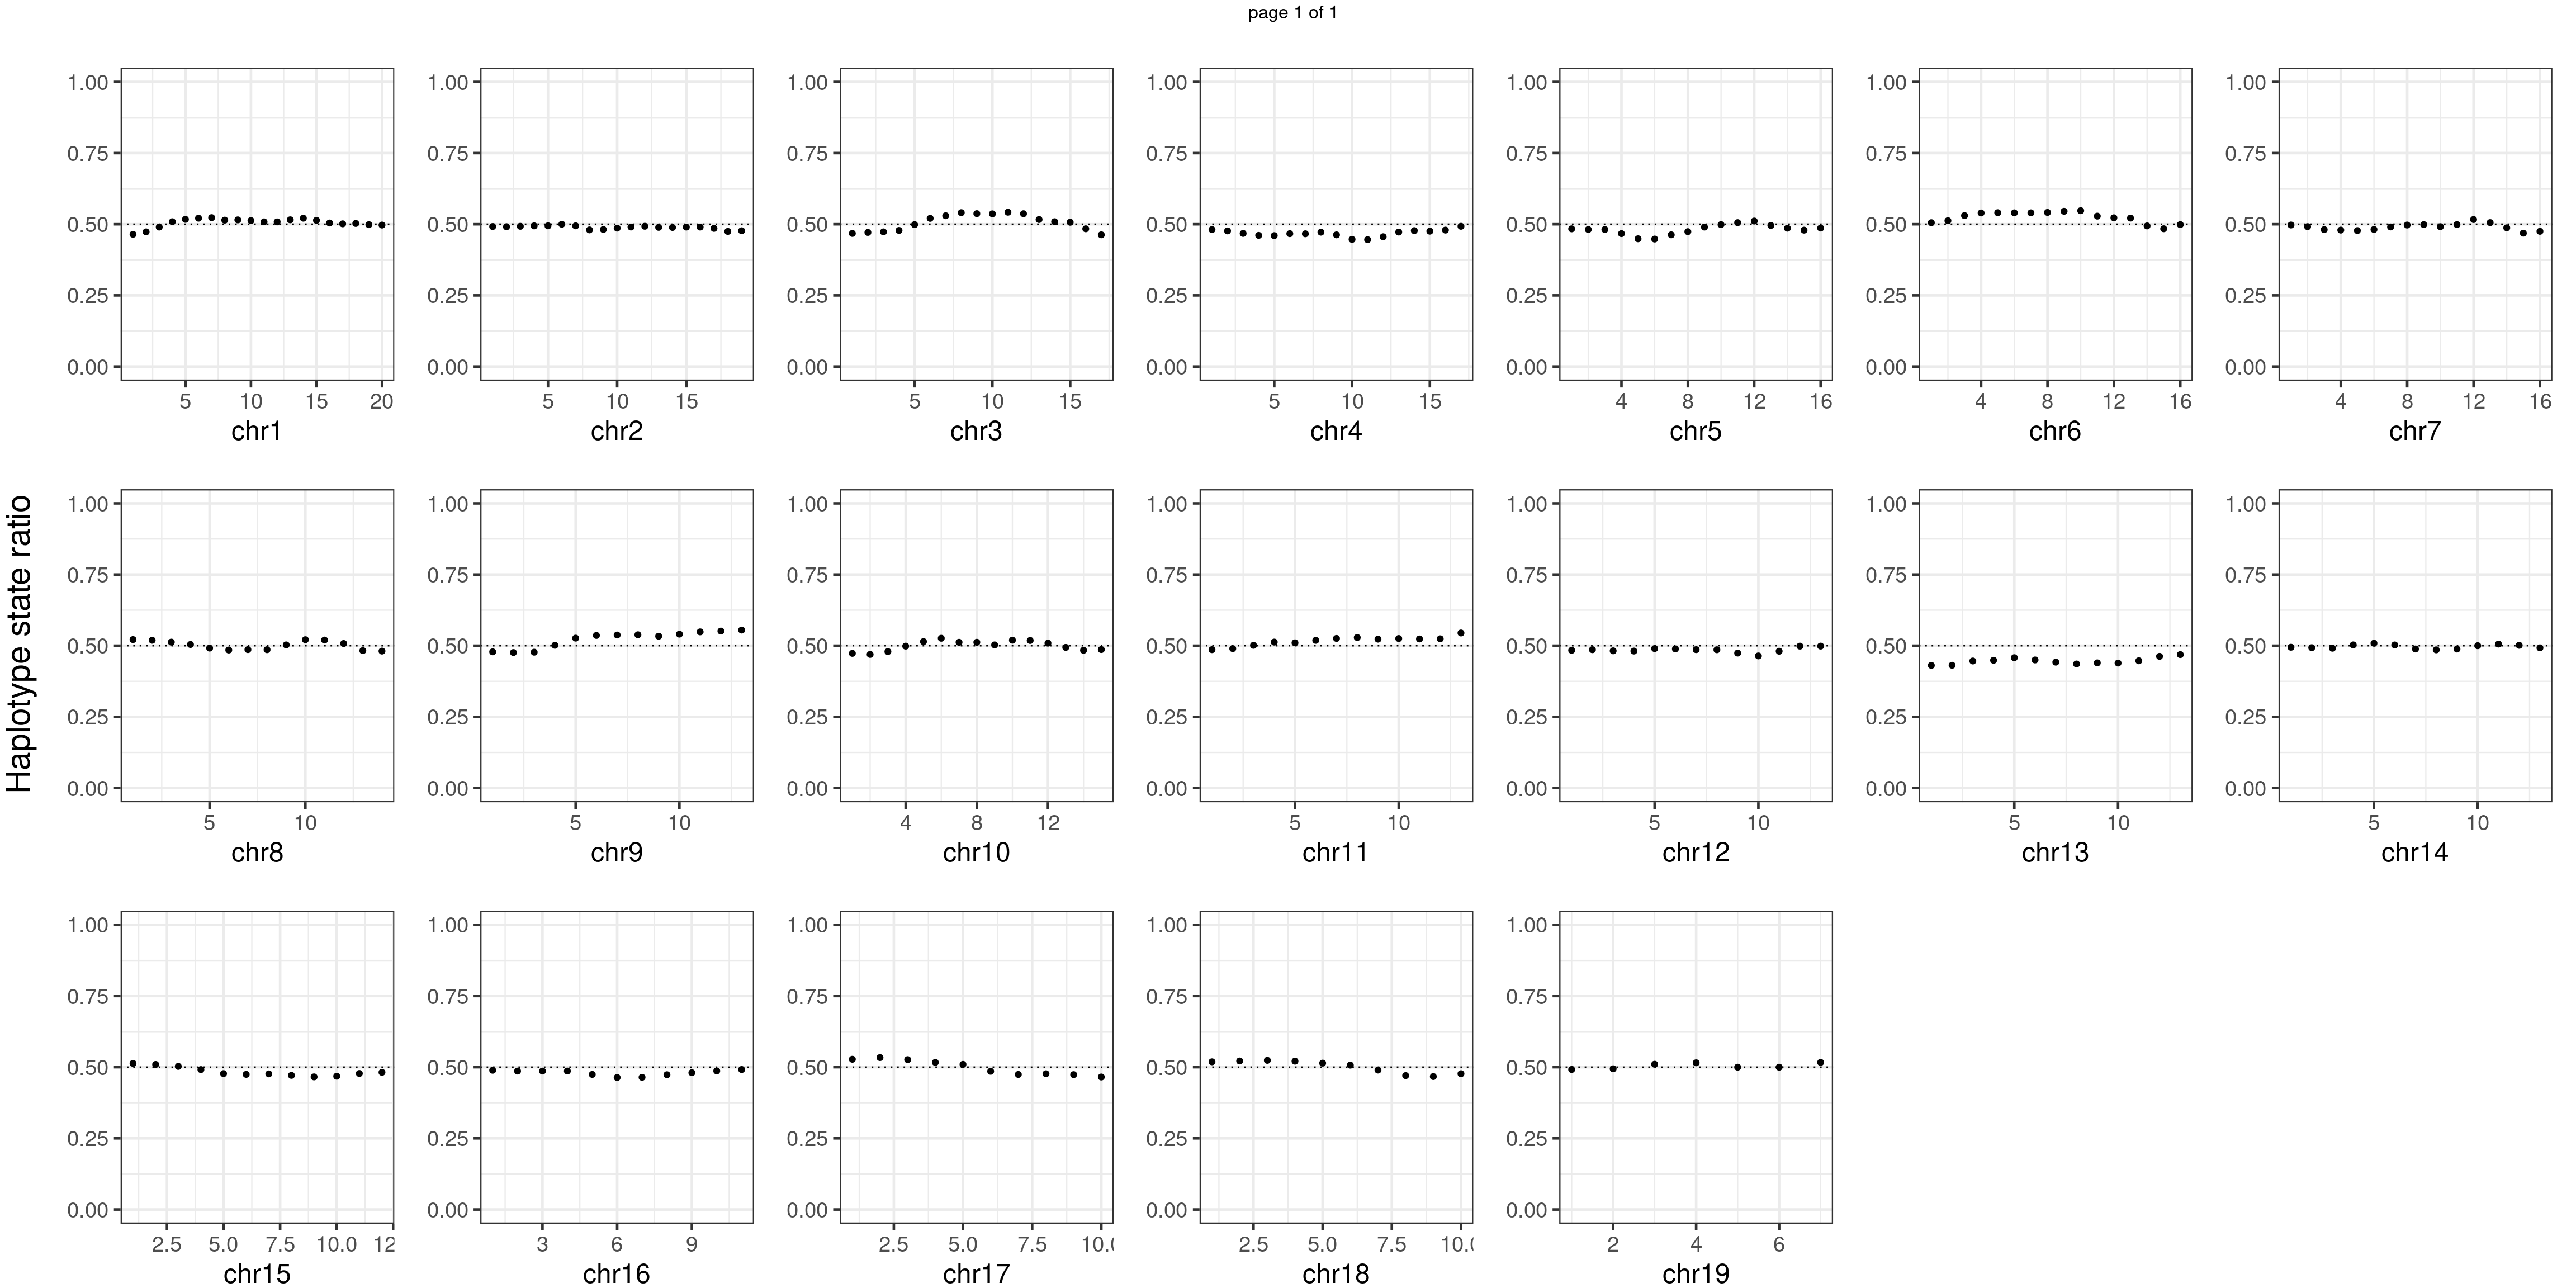
Per BC1F1 sample group
co_count <- readRDS(file = "output/outputR/analysisRDS/all_rse_count_07-20.rds")for(sample_group in unique(co_count$sampleGroup) ){
plots_list <- list()
bins_pvals_list <- list()
for(chrName in paste0("chr",1:19)){
bin_state_gr <- readRDS(paste0("./output/outputR/analysisRDS/bc1f1_",
chrName,"bin_state_gr.rds"))
group_sids <- colnames(mcols(bin_state_gr)) %in% co_count$Sid[co_count$sampleGroup==sample_group]
mcols(bin_state_gr) <- mcols(bin_state_gr)[group_sids]
s1_counts <- rowSums(data.frame(mcols(bin_state_gr),check.names = F)=="s1",na.rm=T)
s2_counts <- rowSums(data.frame(mcols(bin_state_gr),check.names = F)=="s2",na.rm=T)
bins_pvals <- lapply(seq(s1_counts), function(i){
btest <- binom.test(c(s1_counts[i],s2_counts[i]))
btest$p.value
})
plot_df <- data.frame(s1_count = s1_counts,
s2_count = s2_counts,
bin_id = seq(length(bins_pvals)),
biom_pvals = unlist(bins_pvals),
fdr = p.adjust(unlist(bins_pvals),method = "fdr"))
# p <- plot_df %>% tidyr::pivot_longer(c("s1_count","s2_count")) %>% ggplot() +
# geom_bar(aes(x = bin_id, y = value,fill = name),position = "dodge",
# stat = "identity")+
# geom_text(aes(x = bin_id,y=max(c(s1_counts,s2_counts)), label = round(fdr,2)))+
# xlab(chrName)+ylab("cell counts")+theme_bw()+ggtitle(sample_group)
p <- plot_df %>% mutate(hap_ratio = s1_count /(s1_count +s2_count )) %>% ggplot() +
geom_point(aes(x = bin_id, y = hap_ratio))+geom_hline(mapping = aes(yintercept = 0.5),linetype="dotted")+
geom_text(aes(x = bin_id,y=max(hap_ratio)+0.1, label = round(fdr,2)))+
xlab(chrName)+ylab("sample counts")+ylim(c(0,1))+theme_bw(base_size = 18)+ggtitle(sample_group)
plots_list[[chrName]] <- p+guides(fill = "none" )
bins_pvals_list[[chrName]] <- unlist(bins_pvals)
}
mChrThresPlots <- marrangeGrob(plots_list, nrow=3, ncol=2)
notitle_p <- lapply(plots_list, function(x) x+ggtitle("")+ylab("")+
theme(plot.margin = unit(c(0.00,0.00,-0.02,0.00), "cm")))
mChrThresPlots <- marrangeGrob(notitle_p, ncol=7,nrow=3,
left = textGrob(paste0("Haplotype state ratio",sample_group),
rot = 90,gp = gpar(fontsize=22)),
layout_matrix = matrix(c(1:19,NA,NA), 3, 7, TRUE),
right= " ")
print(mChrThresPlots)
message(sample_group, " number of bins with FDR < 0.05: ",
sum(p.adjust(unlist(bins_pvals_list),"fdr")<0.05))
}Male_KO number of bins with FDR < 0.05: 0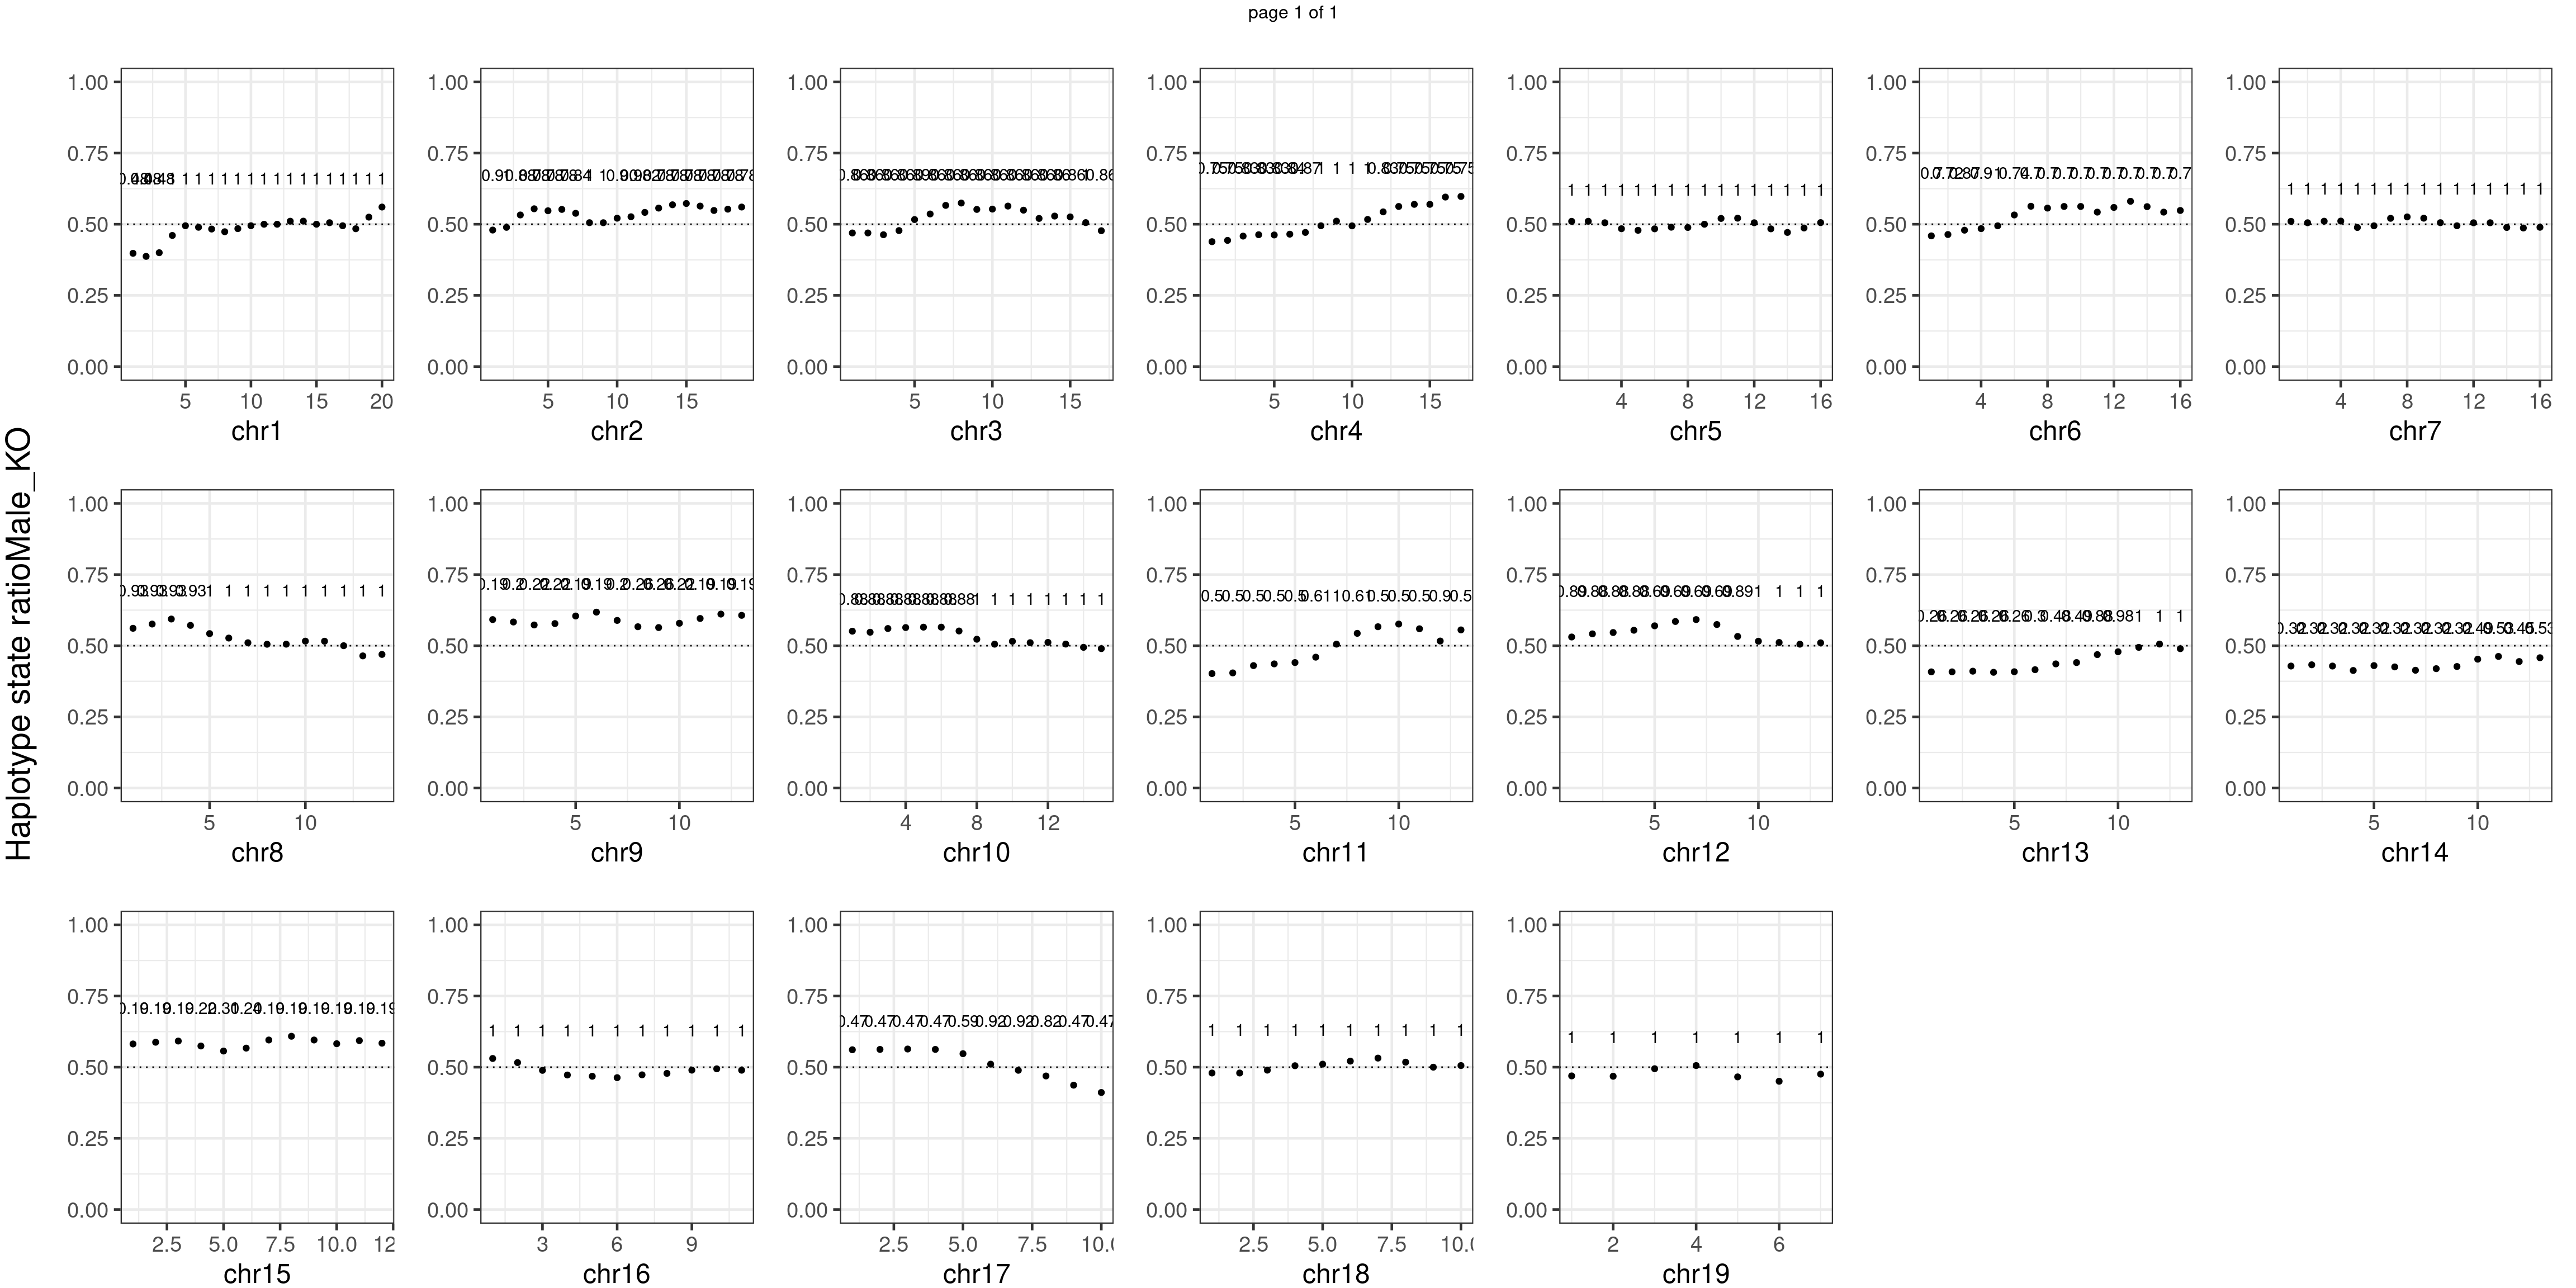
Female_KO number of bins with FDR < 0.05: 0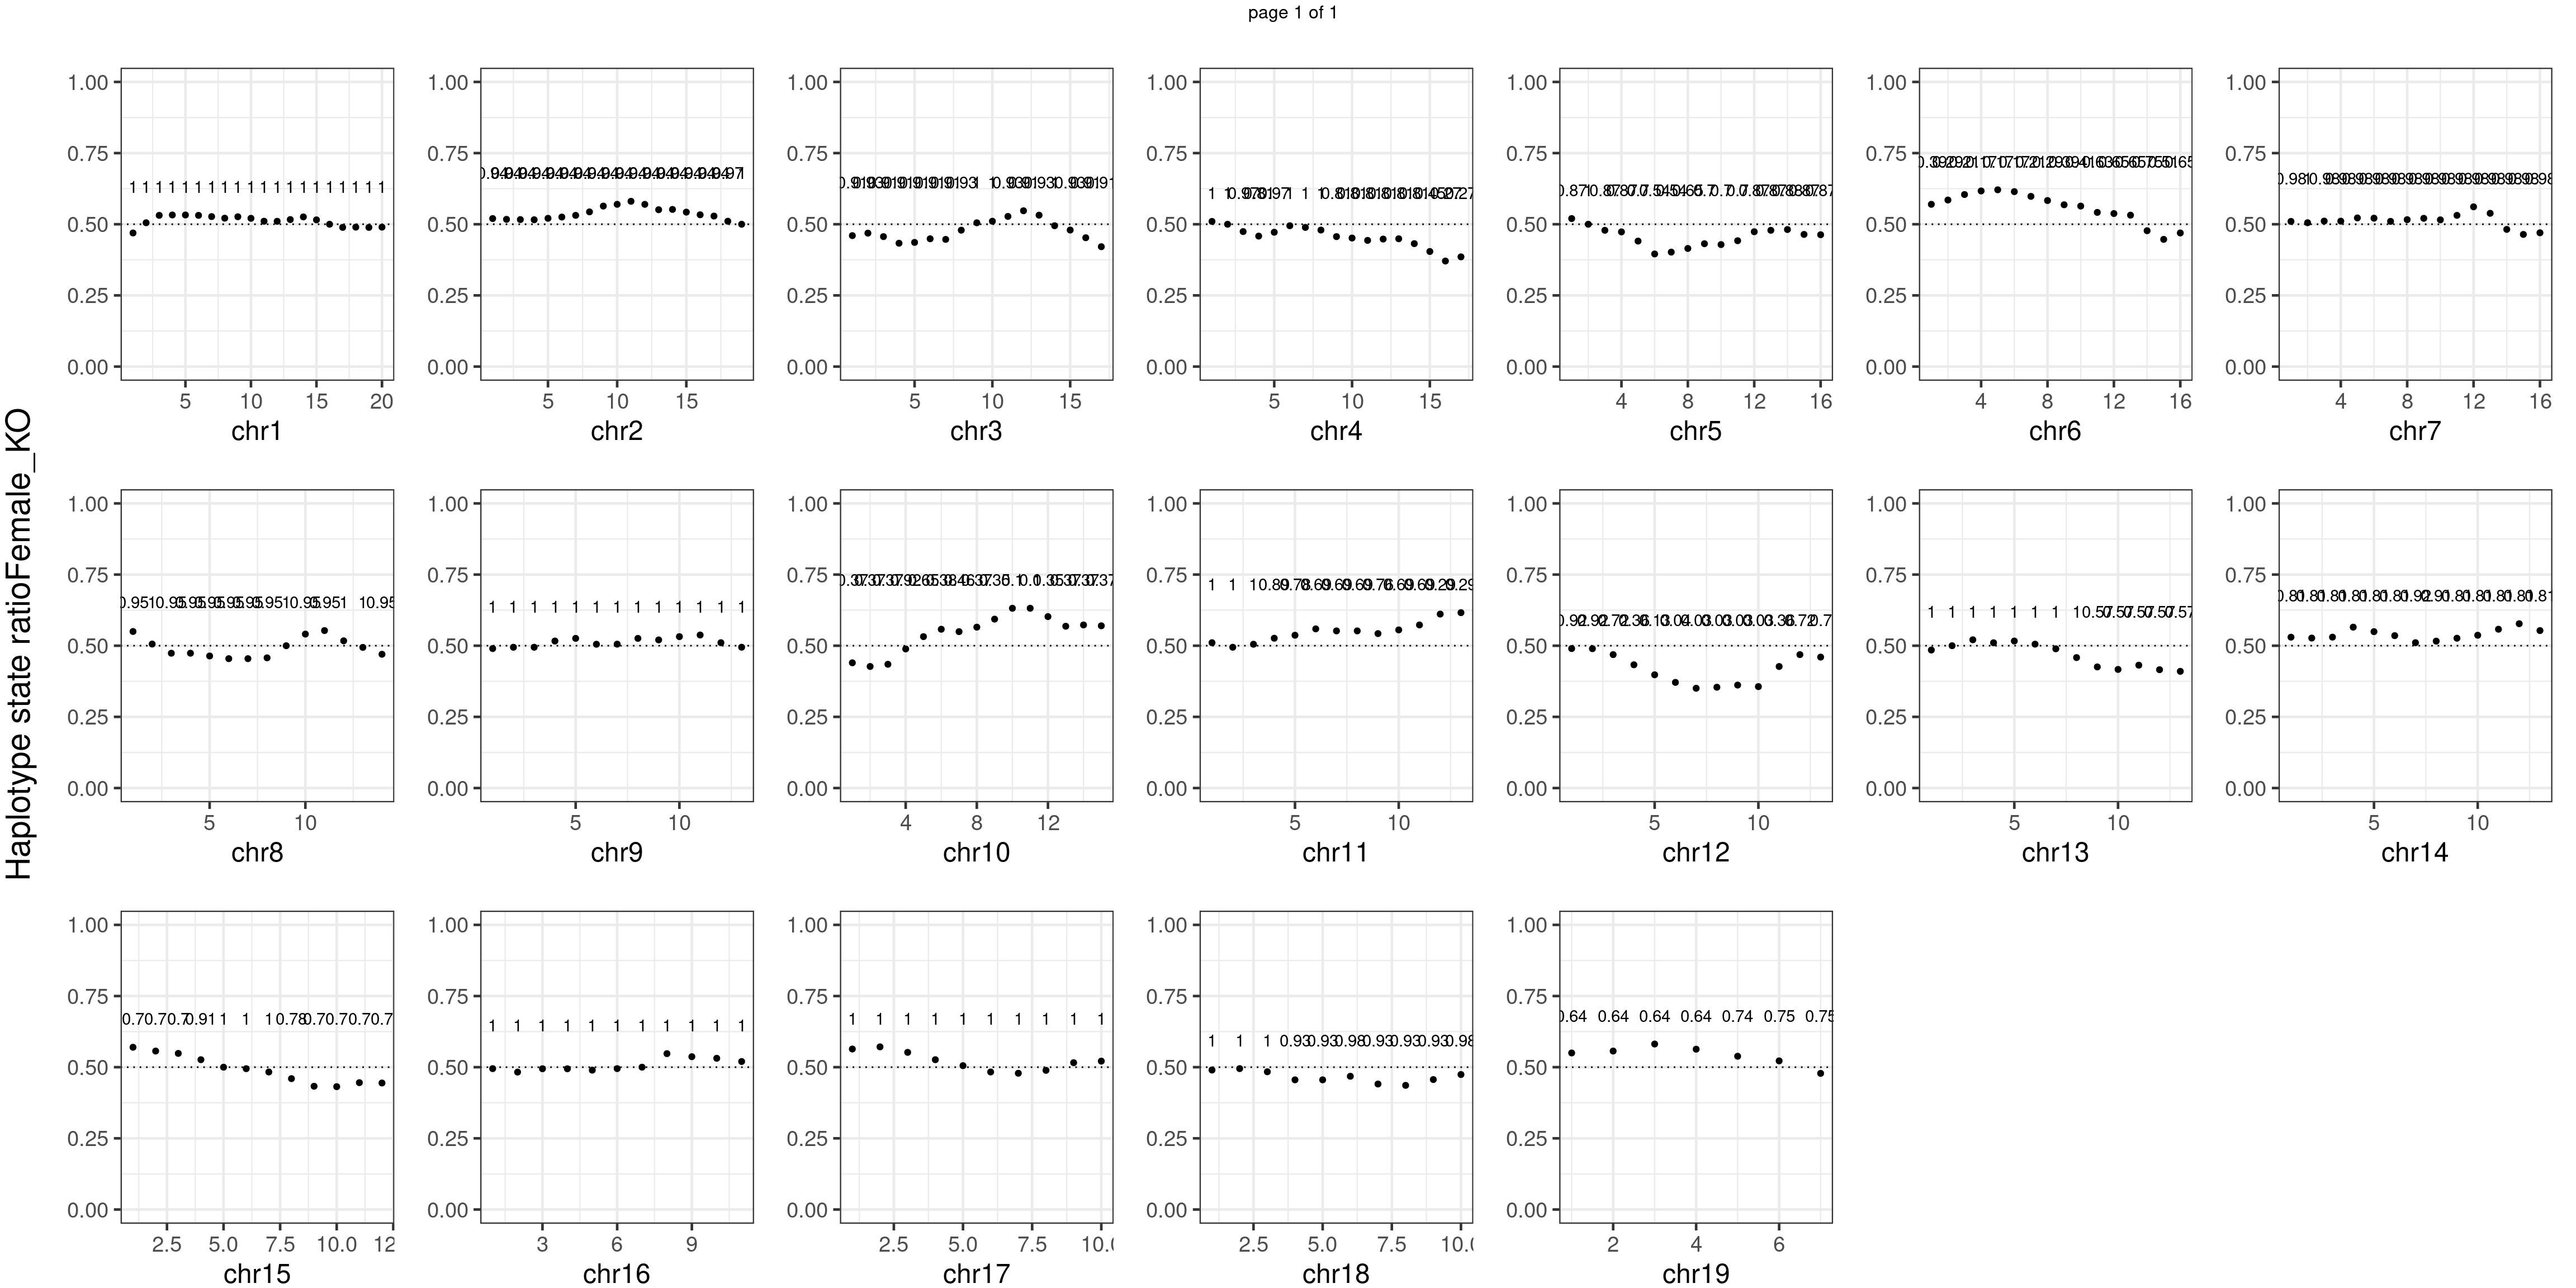
Female_WT number of bins with FDR < 0.05: 0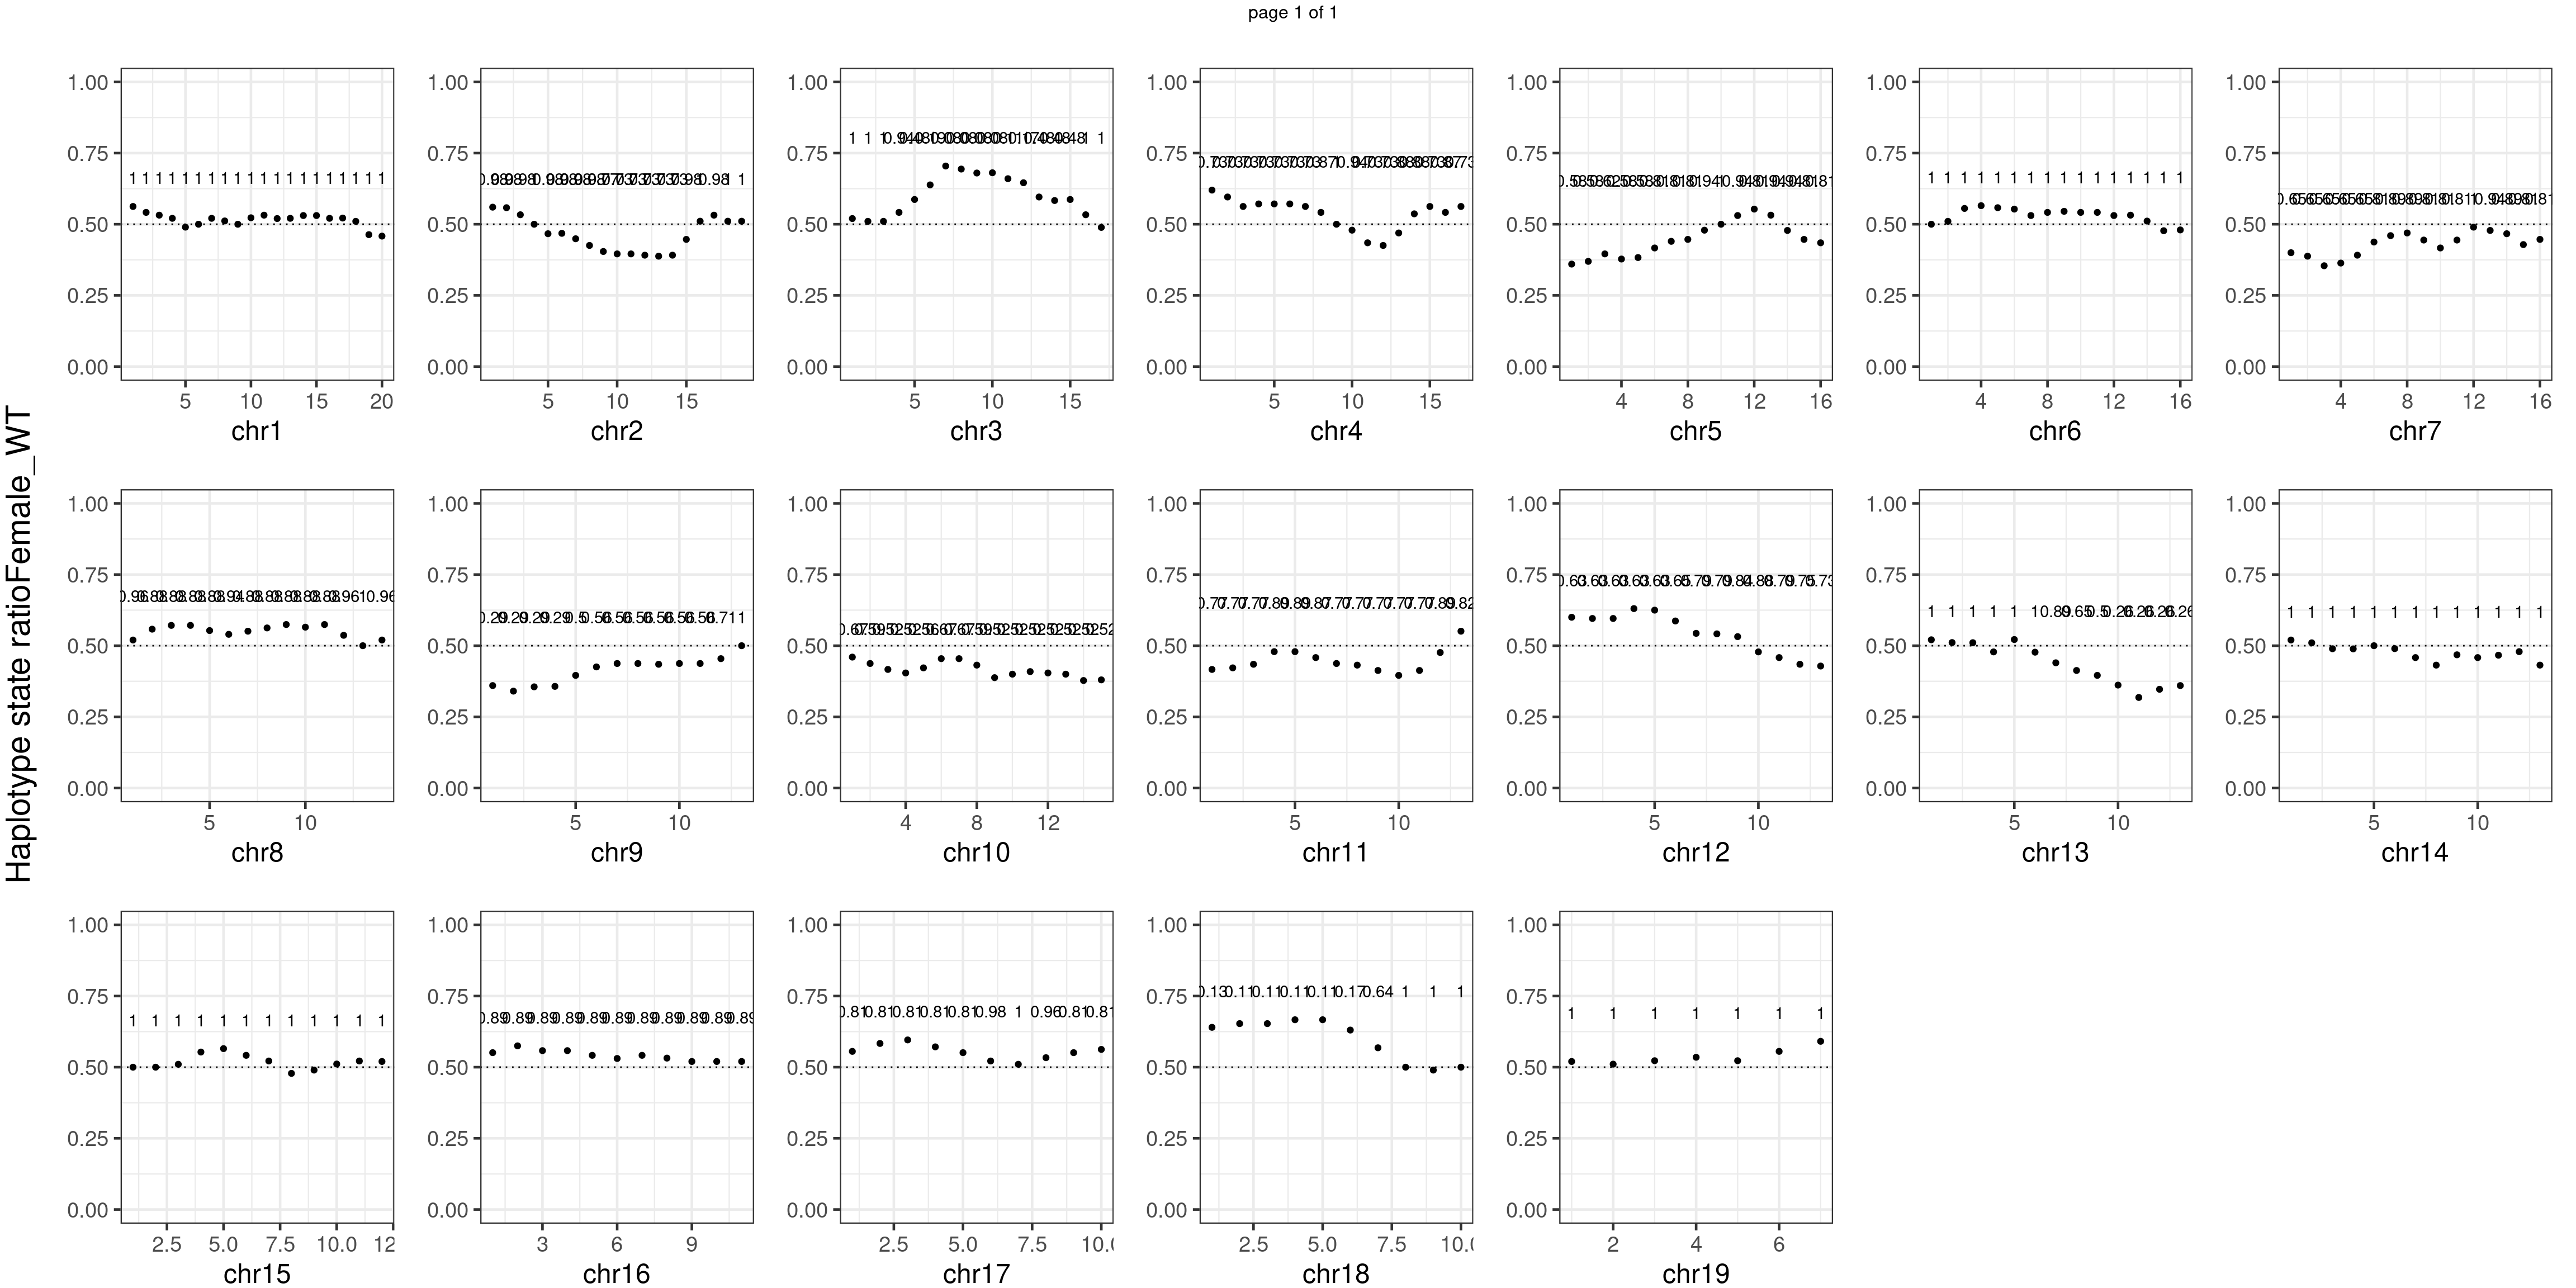
Female_HET number of bins with FDR < 0.05: 0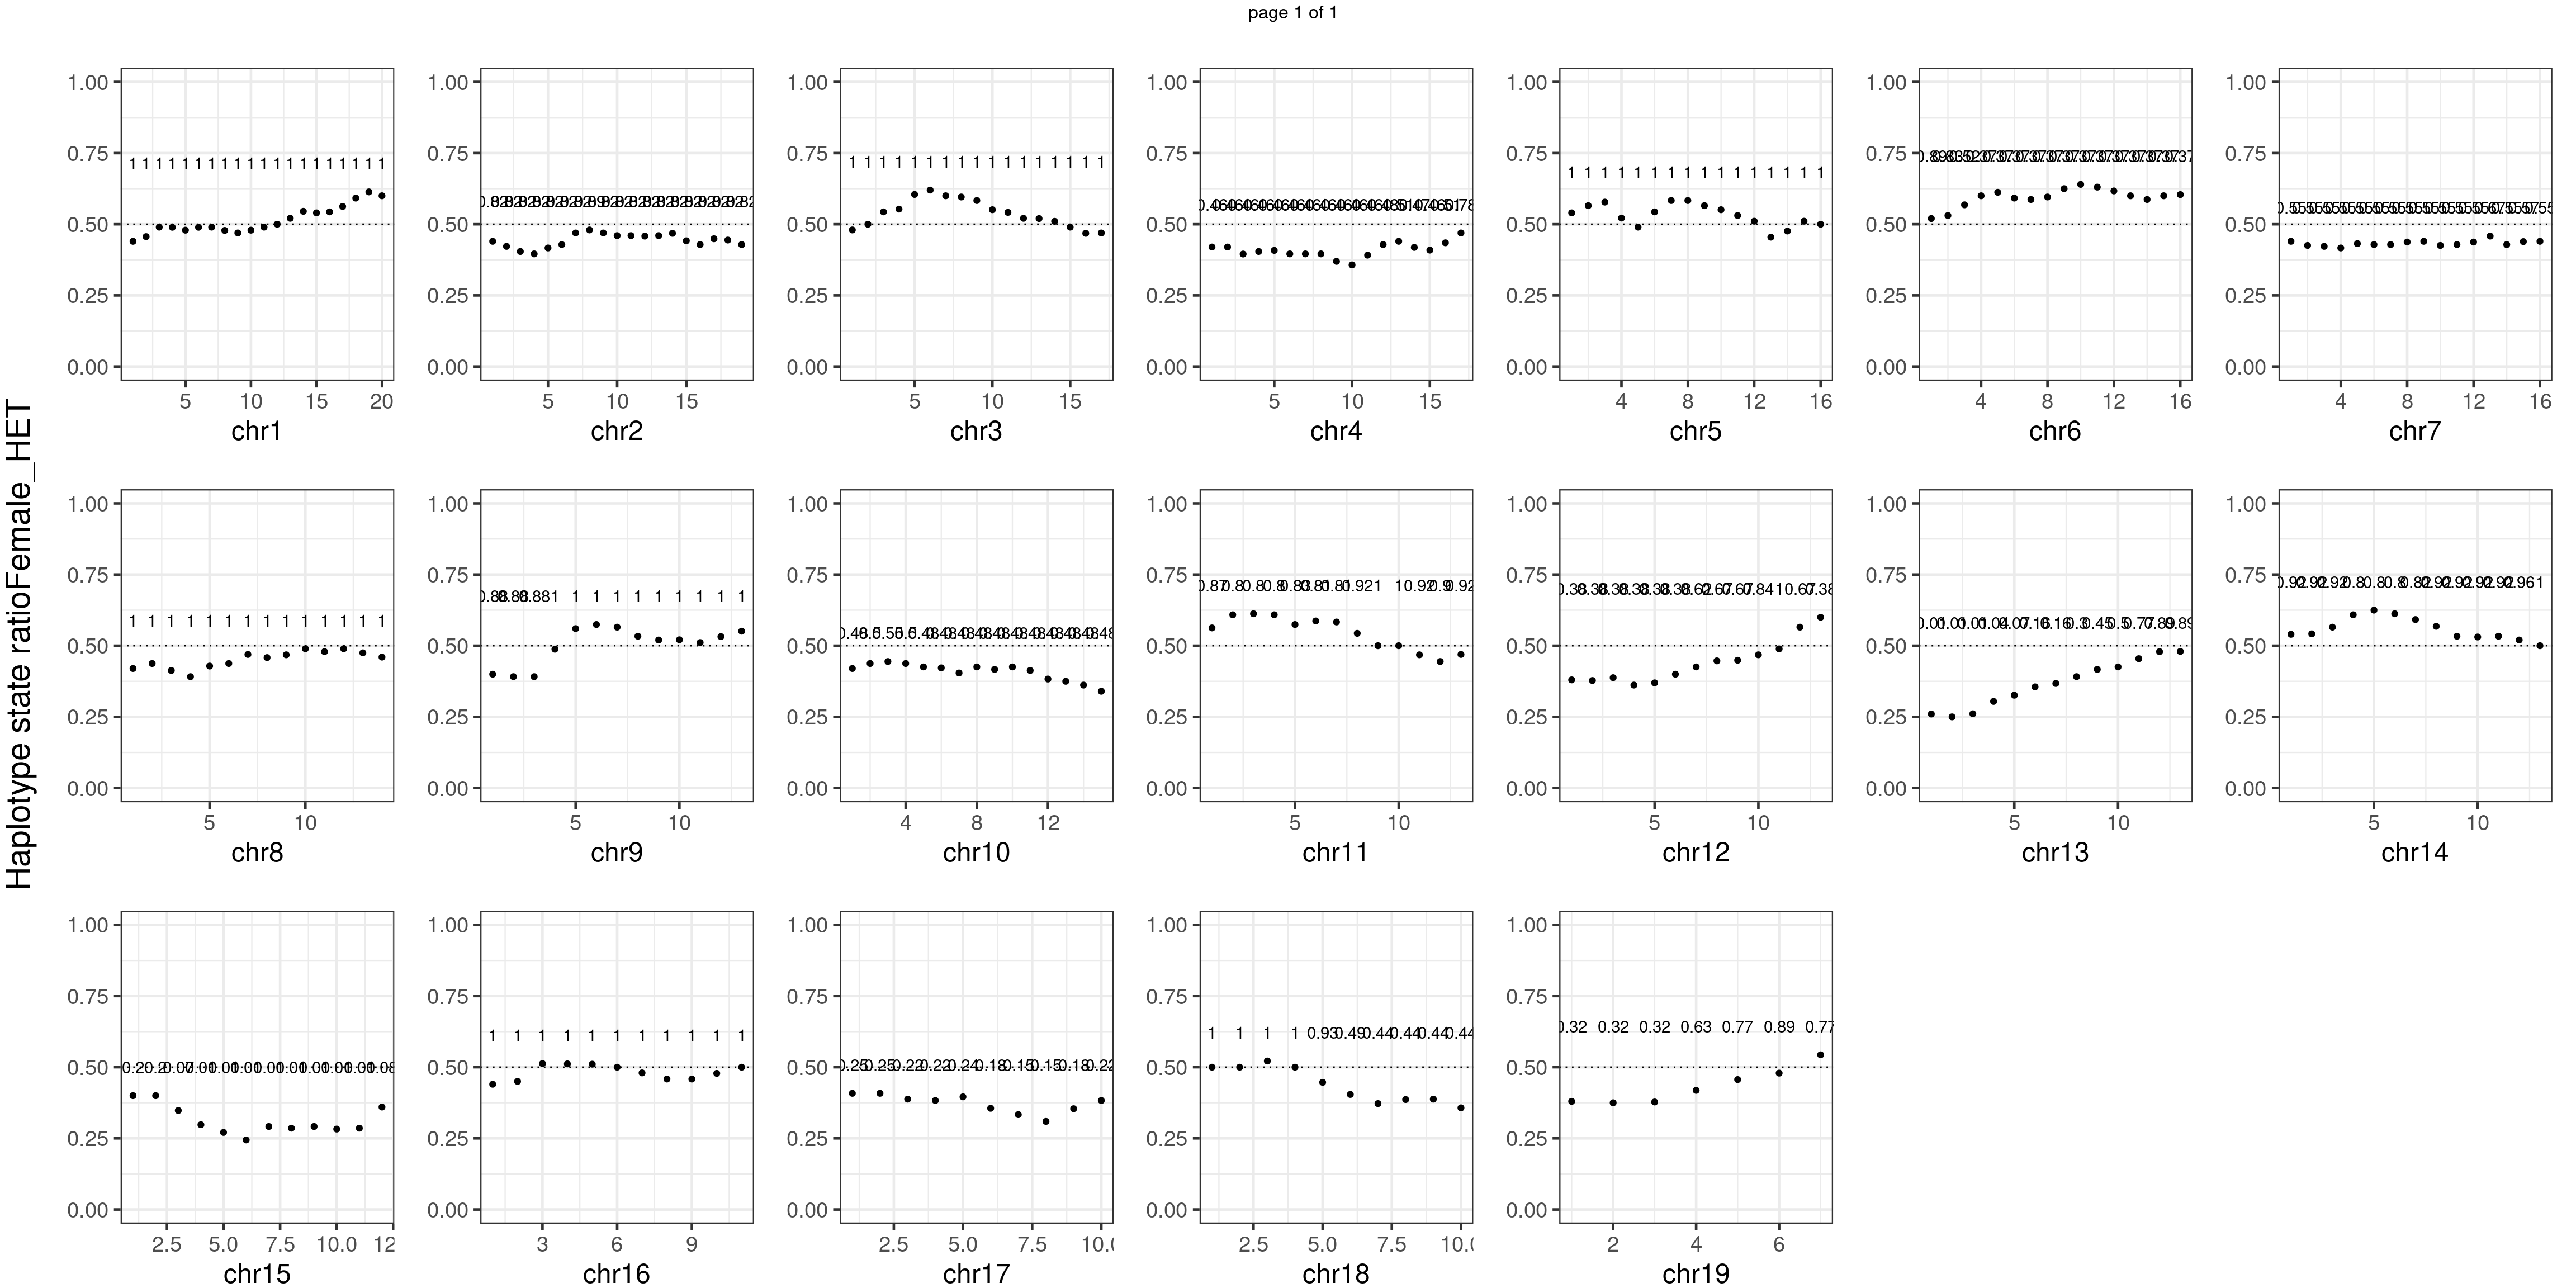
Male_WT number of bins with FDR < 0.05: 0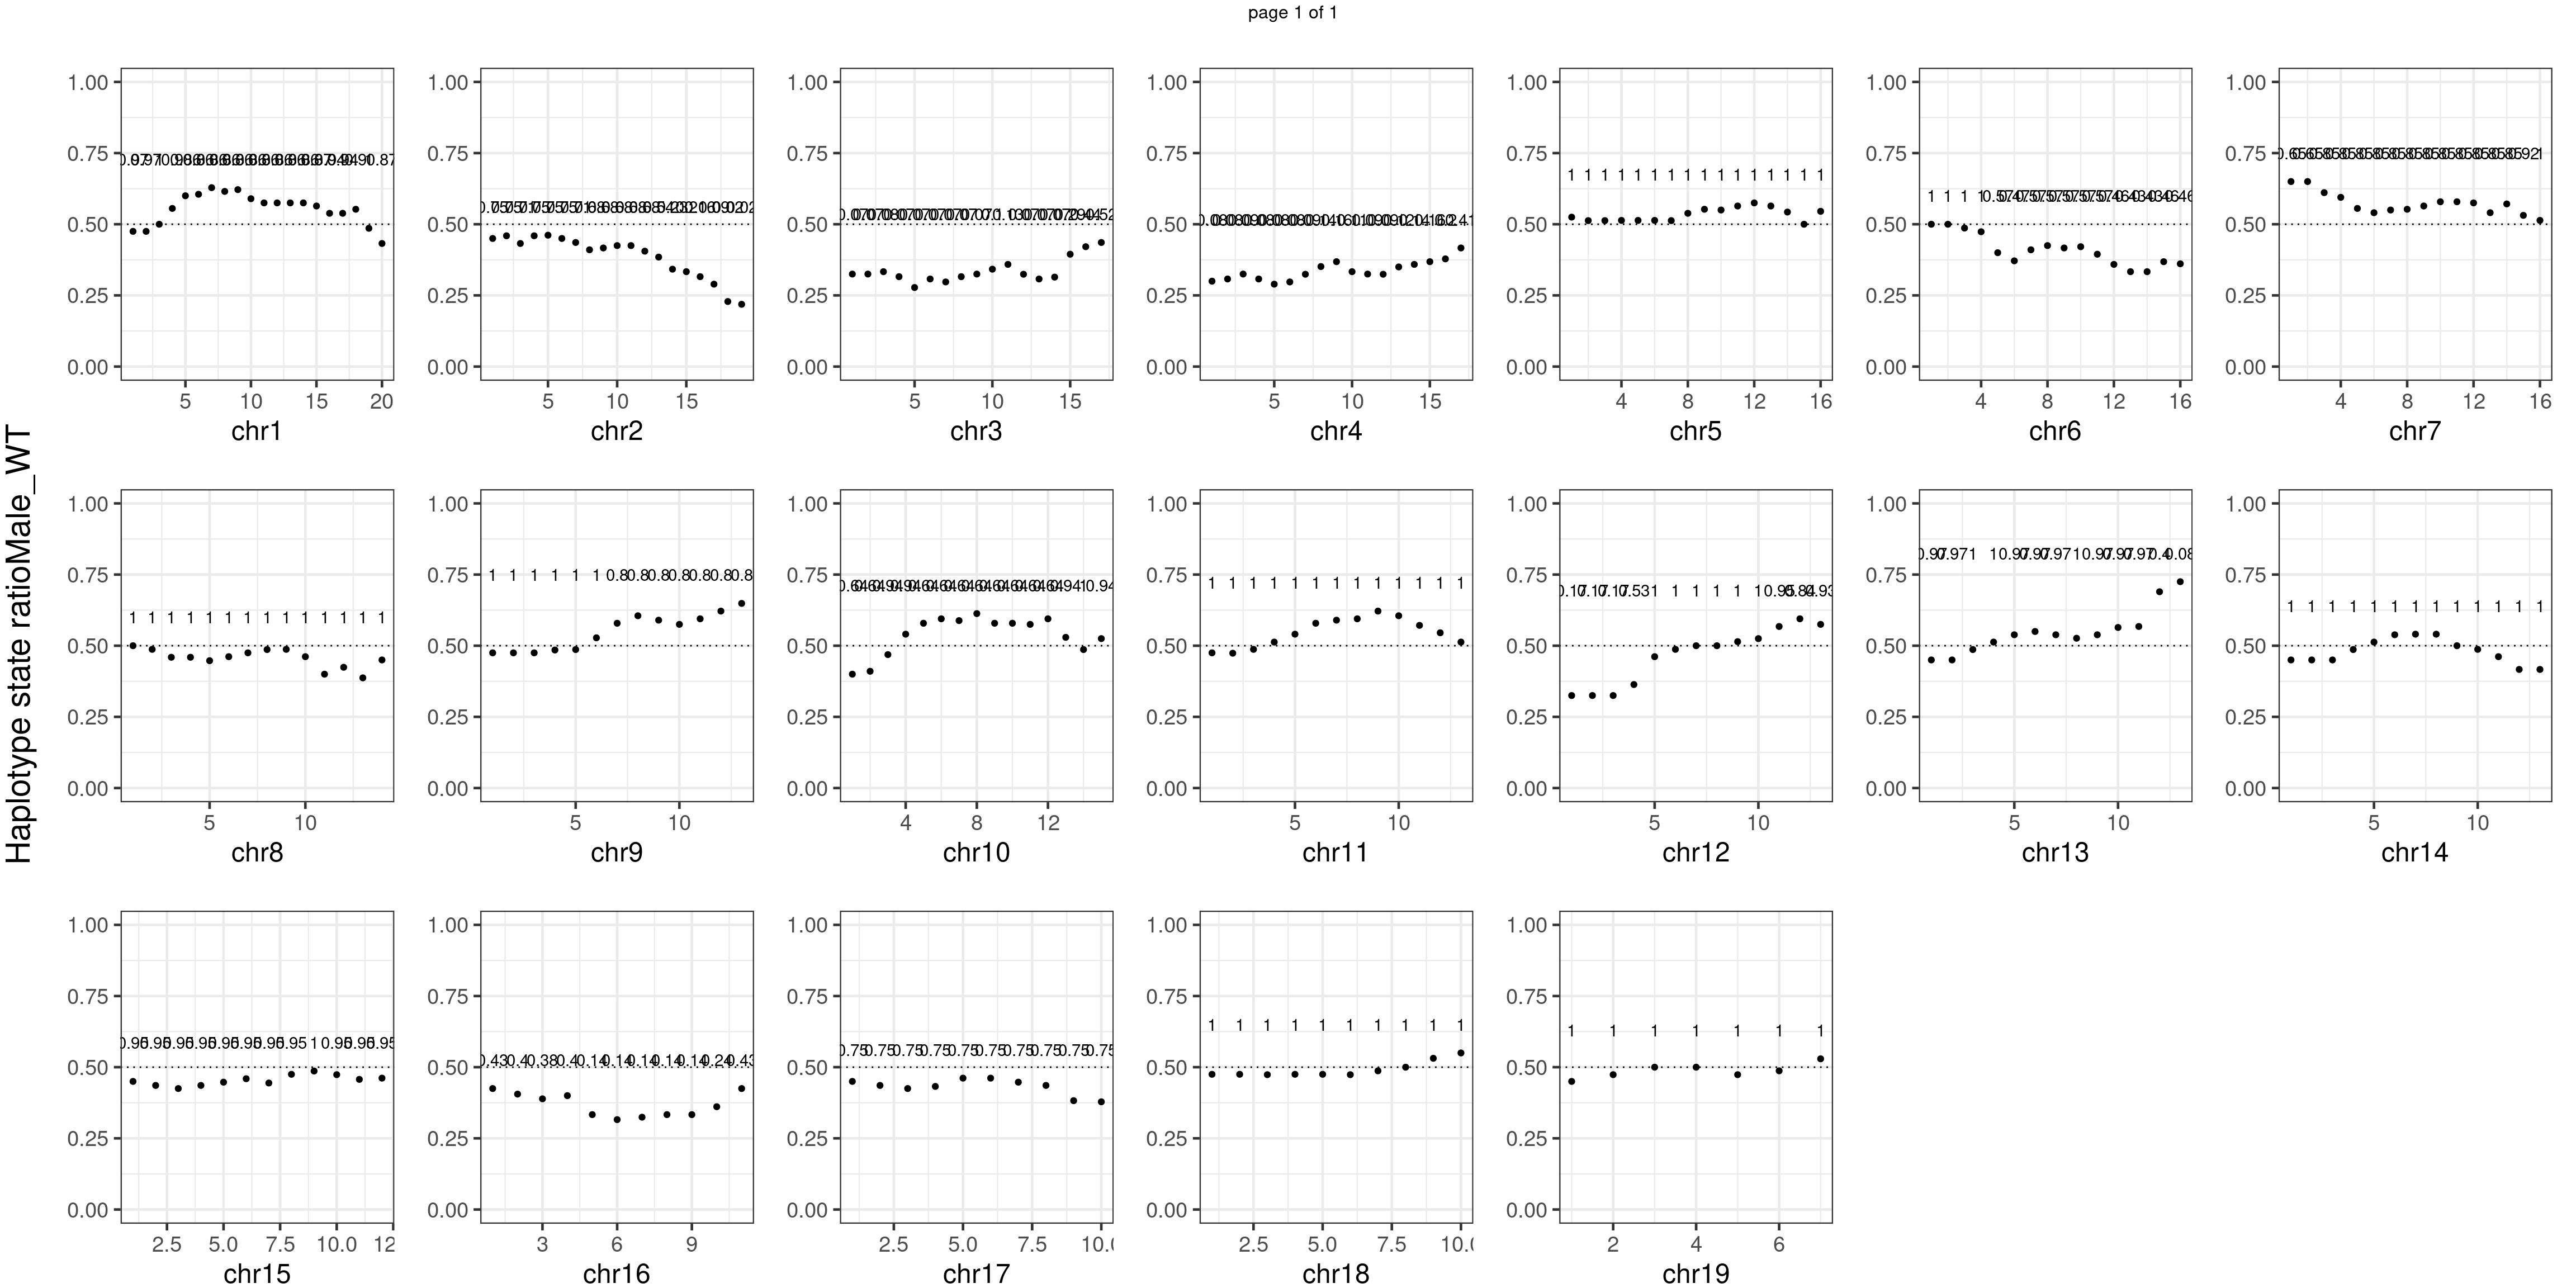
Male_HET number of bins with FDR < 0.05: 0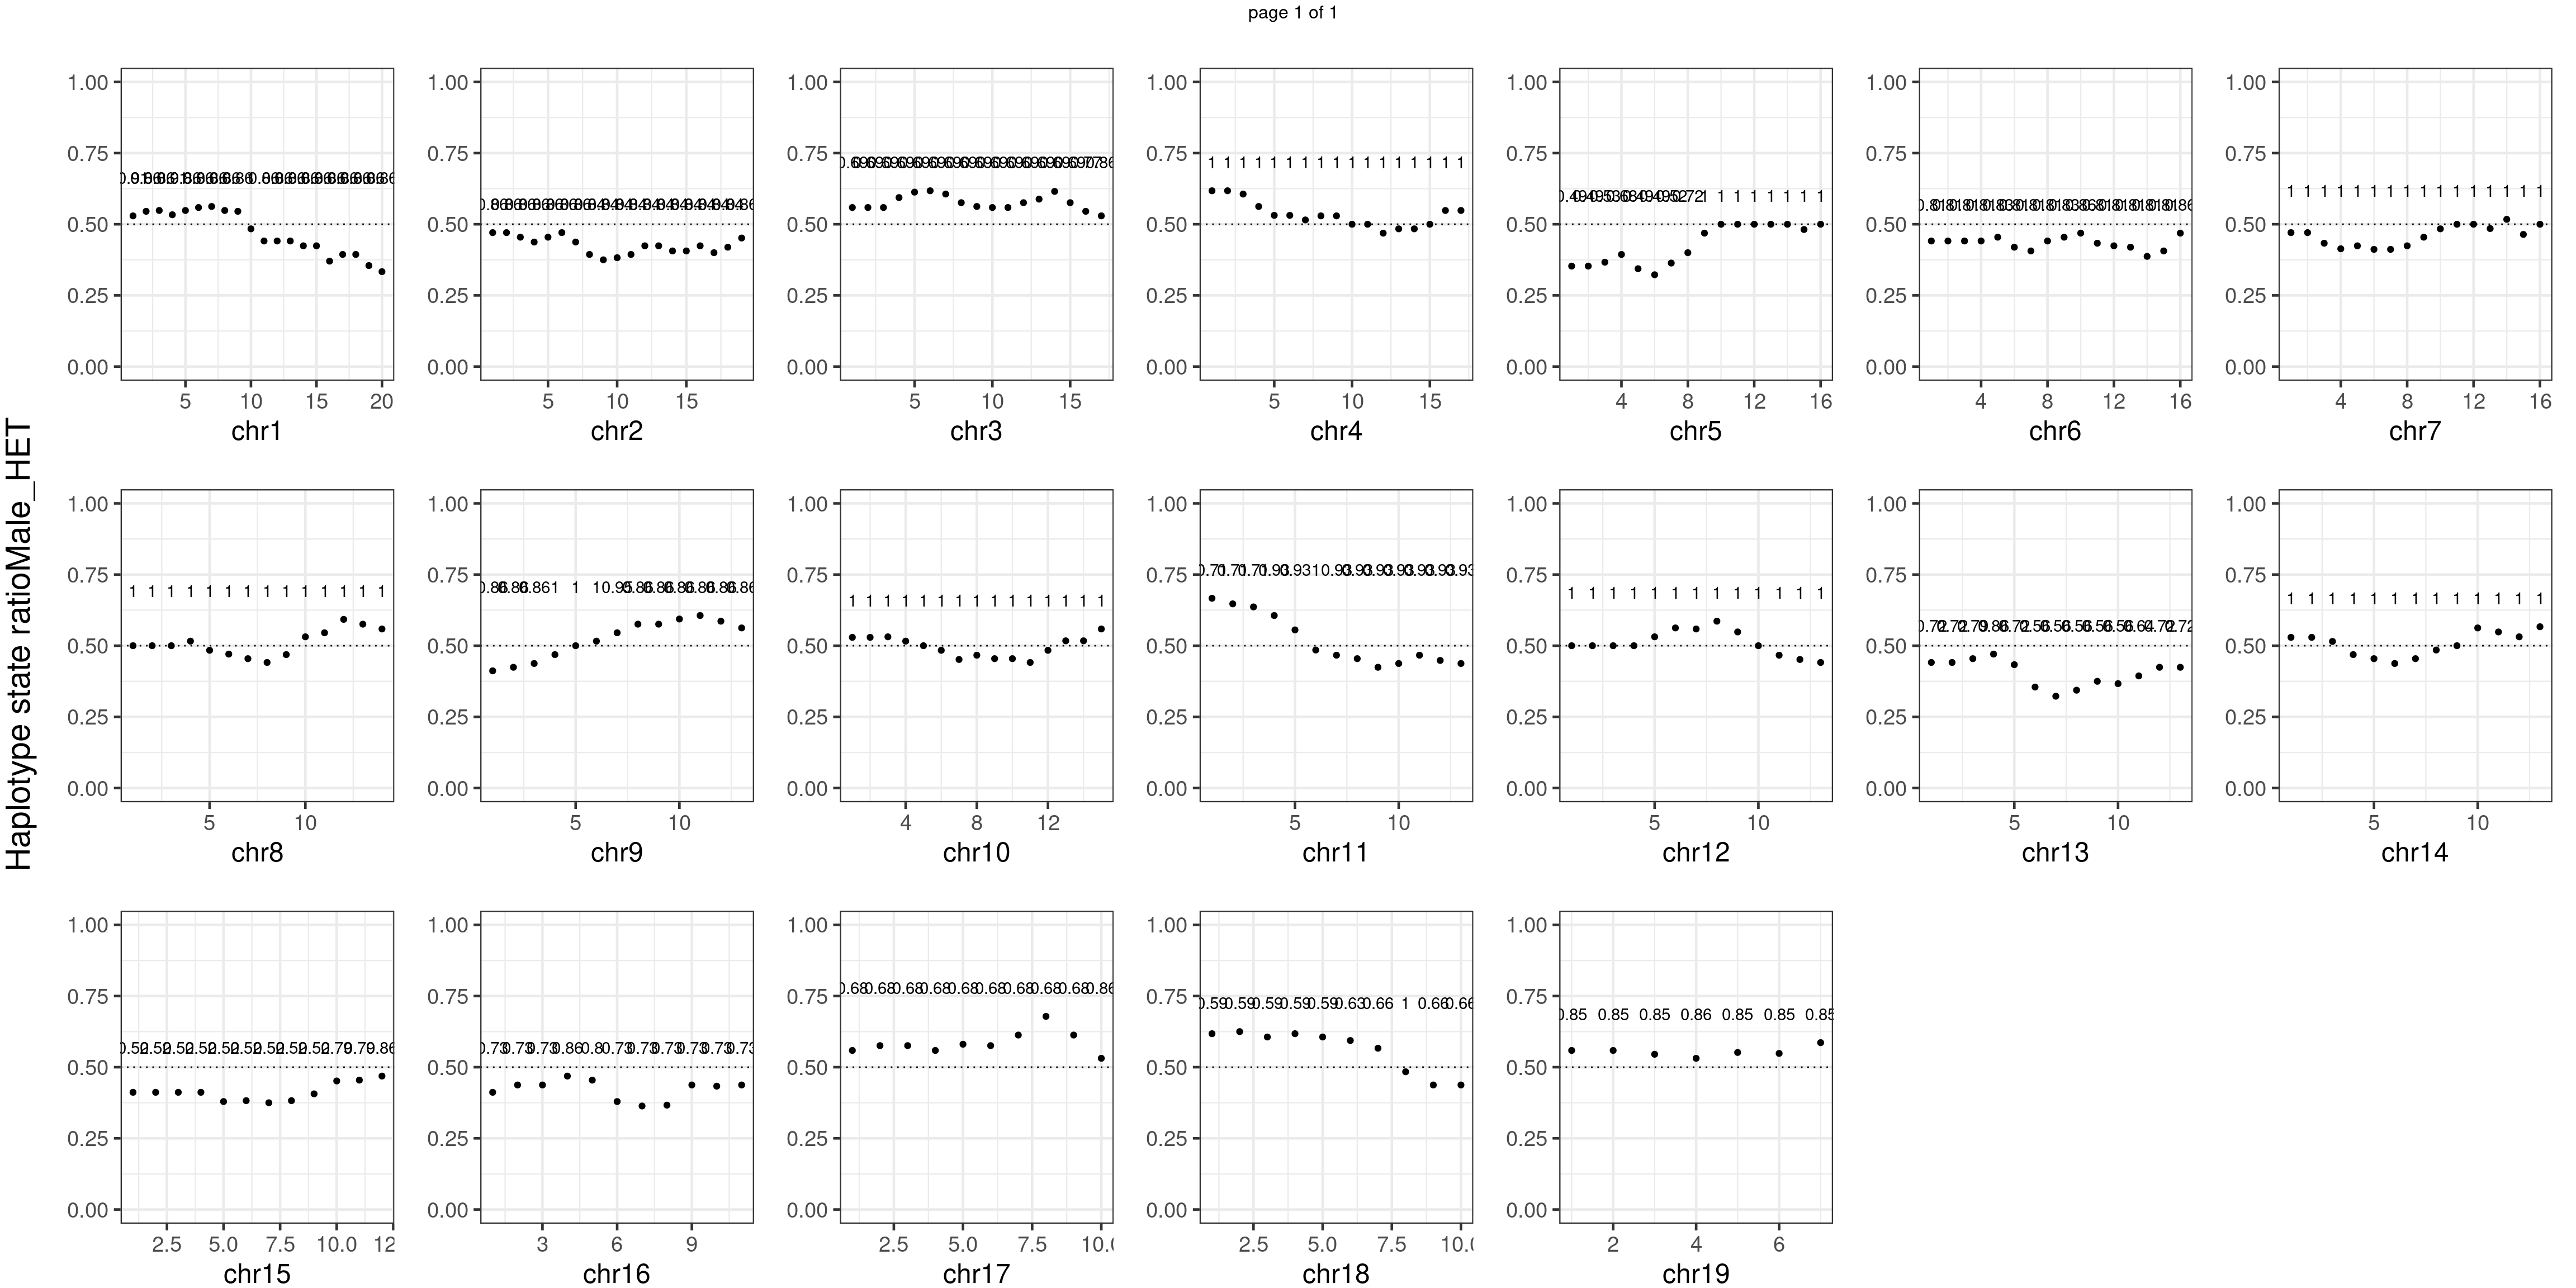
Conclusion
There is no apparent distorted segregation from the aggregated BC1F1 samples. Female_HET might worth having a closer look.
Mouse sex and genotype
The above grouping (Male_KO) was based on the genotype of BC1F1’s Fancm parent. Now we group by the mouse’s sex and genotype and check for female het specifically.
Find sex of the mice
devtools::session_info()─ Session info ───────────────────────────────────────────────────────────────
setting value
version R version 4.1.2 (2021-11-01)
os Rocky Linux 8.5 (Green Obsidian)
system x86_64, linux-gnu
ui X11
language (EN)
collate en_AU.UTF-8
ctype en_AU.UTF-8
tz Australia/Melbourne
date 2022-03-17
pandoc 2.11.4 @ /usr/lib/rstudio-server/bin/pandoc/ (via rmarkdown)
─ Packages ───────────────────────────────────────────────────────────────────
package * version date (UTC) lib source
AnnotationDbi 1.56.2 2021-11-09 [1] Bioconductor
AnnotationFilter 1.18.0 2021-10-26 [1] Bioconductor
assertthat 0.2.1 2019-03-21 [1] CRAN (R 4.1.2)
backports 1.4.1 2021-12-13 [1] CRAN (R 4.1.2)
base64enc 0.1-3 2015-07-28 [1] CRAN (R 4.1.2)
Biobase 2.54.0 2021-10-26 [1] Bioconductor
BiocFileCache 2.2.1 2022-01-23 [1] Bioconductor
BiocGenerics * 0.40.0 2021-10-26 [1] Bioconductor
BiocIO 1.4.0 2021-10-26 [1] Bioconductor
BiocParallel 1.28.3 2021-12-09 [1] Bioconductor
biomaRt 2.50.3 2022-02-03 [1] Bioconductor
Biostrings 2.62.0 2021-10-26 [1] Bioconductor
biovizBase 1.42.0 2021-10-26 [1] Bioconductor
bit 4.0.4 2020-08-04 [1] CRAN (R 4.1.2)
bit64 4.0.5 2020-08-30 [1] CRAN (R 4.1.2)
bitops 1.0-7 2021-04-24 [1] CRAN (R 4.1.2)
blob 1.2.2 2021-07-23 [1] CRAN (R 4.1.2)
brio 1.1.3 2021-11-30 [1] CRAN (R 4.1.0)
BSgenome 1.62.0 2021-10-26 [1] Bioconductor
cachem 1.0.6 2021-08-19 [1] CRAN (R 4.1.0)
callr 3.7.0 2021-04-20 [1] CRAN (R 4.1.2)
checkmate 2.0.0 2020-02-06 [1] CRAN (R 4.1.0)
circlize 0.4.13 2021-06-09 [1] CRAN (R 4.1.0)
cli 3.1.1 2022-01-20 [1] CRAN (R 4.1.2)
cluster 2.1.2 2021-04-17 [2] CRAN (R 4.1.2)
codetools 0.2-18 2020-11-04 [2] CRAN (R 4.1.2)
colorspace 2.0-2 2021-06-24 [1] CRAN (R 4.1.2)
comapr * 0.99.43 2022-03-09 [1] Github (ruqianl/comapr@915d97c)
crayon 1.4.2 2021-10-29 [1] CRAN (R 4.1.2)
curl 4.3.2 2021-06-23 [1] CRAN (R 4.1.2)
data.table 1.14.2 2021-09-27 [1] CRAN (R 4.1.2)
DBI 1.1.2 2021-12-20 [1] CRAN (R 4.1.2)
dbplyr 2.1.1 2021-04-06 [1] CRAN (R 4.1.2)
DelayedArray 0.20.0 2021-10-26 [1] Bioconductor
desc 1.4.0 2021-09-28 [1] CRAN (R 4.1.0)
devtools 2.4.3 2021-11-30 [1] CRAN (R 4.1.0)
dichromat 2.0-0 2013-01-24 [1] CRAN (R 4.1.0)
digest 0.6.29 2021-12-01 [1] CRAN (R 4.1.2)
dplyr * 1.0.7 2021-06-18 [1] CRAN (R 4.1.2)
ellipsis 0.3.2 2021-04-29 [1] CRAN (R 4.1.2)
ensembldb 2.18.3 2022-01-13 [1] Bioconductor
evaluate 0.14 2019-05-28 [1] CRAN (R 4.1.2)
fansi 1.0.2 2022-01-14 [1] CRAN (R 4.1.2)
farver 2.1.0 2021-02-28 [1] CRAN (R 4.1.2)
fastmap 1.1.0 2021-01-25 [1] CRAN (R 4.1.2)
filelock 1.0.2 2018-10-05 [1] CRAN (R 4.1.0)
foreach 1.5.2 2022-02-02 [1] CRAN (R 4.1.0)
foreign 0.8-81 2020-12-22 [2] CRAN (R 4.1.2)
Formula 1.2-4 2020-10-16 [1] CRAN (R 4.1.0)
fs 1.5.2 2021-12-08 [1] CRAN (R 4.1.2)
generics 0.1.1 2021-10-25 [1] CRAN (R 4.1.2)
GenomeInfoDb * 1.30.1 2022-01-30 [1] Bioconductor
GenomeInfoDbData 1.2.7 2022-01-28 [1] Bioconductor
GenomicAlignments 1.30.0 2021-10-26 [1] Bioconductor
GenomicFeatures 1.46.4 2022-01-20 [1] Bioconductor
GenomicRanges * 1.46.1 2021-11-18 [1] Bioconductor
ggplot2 * 3.3.5 2021-06-25 [1] CRAN (R 4.1.2)
git2r 0.29.0 2021-11-22 [1] CRAN (R 4.1.2)
GlobalOptions 0.1.2 2020-06-10 [1] CRAN (R 4.1.0)
glue 1.6.1 2022-01-22 [1] CRAN (R 4.1.2)
gridExtra * 2.3 2017-09-09 [1] CRAN (R 4.1.0)
gtable 0.3.0 2019-03-25 [1] CRAN (R 4.1.2)
Gviz 1.38.3 2022-01-23 [1] Bioconductor
highr 0.9 2021-04-16 [1] CRAN (R 4.1.2)
Hmisc 4.6-0 2021-10-07 [1] CRAN (R 4.1.0)
hms 1.1.1 2021-09-26 [1] CRAN (R 4.1.2)
htmlTable 2.4.0 2022-01-04 [1] CRAN (R 4.1.0)
htmltools 0.5.2 2021-08-25 [1] CRAN (R 4.1.2)
htmlwidgets 1.5.4 2021-09-08 [1] CRAN (R 4.1.0)
httpuv 1.6.5 2022-01-05 [1] CRAN (R 4.1.2)
httr 1.4.2 2020-07-20 [1] CRAN (R 4.1.2)
IRanges * 2.28.0 2021-10-26 [1] Bioconductor
iterators 1.0.14 2022-02-05 [1] CRAN (R 4.1.0)
jpeg 0.1-9 2021-07-24 [1] CRAN (R 4.1.0)
jquerylib 0.1.4 2021-04-26 [1] CRAN (R 4.1.2)
jsonlite 1.7.3 2022-01-17 [1] CRAN (R 4.1.2)
KEGGREST 1.34.0 2021-10-26 [1] Bioconductor
knitr 1.37 2021-12-16 [1] CRAN (R 4.1.0)
labeling 0.4.2 2020-10-20 [1] CRAN (R 4.1.2)
later 1.3.0 2021-08-18 [1] CRAN (R 4.1.0)
lattice 0.20-45 2021-09-22 [2] CRAN (R 4.1.2)
latticeExtra 0.6-29 2019-12-19 [1] CRAN (R 4.1.0)
lazyeval 0.2.2 2019-03-15 [1] CRAN (R 4.1.0)
lifecycle 1.0.1 2021-09-24 [1] CRAN (R 4.1.2)
magrittr 2.0.2 2022-01-26 [1] CRAN (R 4.1.2)
Matrix 1.4-0 2021-12-08 [1] CRAN (R 4.1.2)
MatrixGenerics 1.6.0 2021-10-26 [1] Bioconductor
matrixStats 0.61.0 2021-09-17 [1] CRAN (R 4.1.2)
memoise 2.0.1 2021-11-26 [1] CRAN (R 4.1.0)
munsell 0.5.0 2018-06-12 [1] CRAN (R 4.1.2)
nnet 7.3-16 2021-05-03 [2] CRAN (R 4.1.2)
pillar 1.6.5 2022-01-25 [1] CRAN (R 4.1.2)
pkgbuild 1.3.1 2021-12-20 [1] CRAN (R 4.1.0)
pkgconfig 2.0.3 2019-09-22 [1] CRAN (R 4.1.2)
pkgload 1.2.4 2021-11-30 [1] CRAN (R 4.1.0)
plotly 4.10.0 2021-10-09 [1] CRAN (R 4.1.0)
plyr 1.8.6 2020-03-03 [1] CRAN (R 4.1.0)
png 0.1-7 2013-12-03 [1] CRAN (R 4.1.0)
prettyunits 1.1.1 2020-01-24 [1] CRAN (R 4.1.2)
processx 3.5.2 2021-04-30 [1] CRAN (R 4.1.2)
progress 1.2.2 2019-05-16 [1] CRAN (R 4.1.2)
promises 1.2.0.1 2021-02-11 [1] CRAN (R 4.1.0)
ProtGenerics 1.26.0 2021-10-26 [1] Bioconductor
ps 1.6.0 2021-02-28 [1] CRAN (R 4.1.2)
purrr 0.3.4 2020-04-17 [1] CRAN (R 4.1.2)
R6 2.5.1 2021-08-19 [1] CRAN (R 4.1.2)
rappdirs 0.3.3 2021-01-31 [1] CRAN (R 4.1.2)
RColorBrewer 1.1-2 2014-12-07 [1] CRAN (R 4.1.2)
Rcpp 1.0.8 2022-01-13 [1] CRAN (R 4.1.2)
RCurl 1.98-1.5 2021-09-17 [1] CRAN (R 4.1.0)
remotes 2.4.2 2021-11-30 [1] CRAN (R 4.1.0)
reshape2 1.4.4 2020-04-09 [1] CRAN (R 4.1.0)
restfulr 0.0.13 2017-08-06 [1] CRAN (R 4.1.0)
rjson 0.2.21 2022-01-09 [1] CRAN (R 4.1.0)
rlang 1.0.0 2022-01-26 [1] CRAN (R 4.1.2)
rmarkdown 2.11 2021-09-14 [1] CRAN (R 4.1.2)
rpart 4.1-15 2019-04-12 [2] CRAN (R 4.1.2)
rprojroot 2.0.2 2020-11-15 [1] CRAN (R 4.1.0)
Rsamtools 2.10.0 2021-10-26 [1] Bioconductor
RSQLite 2.2.9 2021-12-06 [1] CRAN (R 4.1.0)
rstudioapi 0.13 2020-11-12 [1] CRAN (R 4.1.2)
rtracklayer 1.54.0 2021-10-26 [1] Bioconductor
S4Vectors * 0.32.3 2021-11-21 [1] Bioconductor
scales 1.1.1 2020-05-11 [1] CRAN (R 4.1.2)
sessioninfo 1.2.2 2021-12-06 [1] CRAN (R 4.1.0)
shape 1.4.6 2021-05-19 [1] CRAN (R 4.1.0)
stringi 1.7.6 2021-11-29 [1] CRAN (R 4.1.0)
stringr 1.4.0 2019-02-10 [1] CRAN (R 4.1.0)
SummarizedExperiment 1.24.0 2021-10-26 [1] Bioconductor
survival 3.2-13 2021-08-24 [2] CRAN (R 4.1.2)
testthat 3.1.2 2022-01-20 [1] CRAN (R 4.1.0)
tibble 3.1.6 2021-11-07 [1] CRAN (R 4.1.2)
tidyr 1.2.0 2022-02-01 [1] CRAN (R 4.1.0)
tidyselect 1.1.1 2021-04-30 [1] CRAN (R 4.1.2)
usethis 2.1.5 2021-12-09 [1] CRAN (R 4.1.0)
utf8 1.2.2 2021-07-24 [1] CRAN (R 4.1.2)
VariantAnnotation 1.40.0 2021-10-26 [1] Bioconductor
vctrs 0.3.8 2021-04-29 [1] CRAN (R 4.1.2)
viridisLite 0.4.0 2021-04-13 [1] CRAN (R 4.1.2)
withr 2.4.3 2021-11-30 [1] CRAN (R 4.1.2)
workflowr 1.7.0 2021-12-21 [1] CRAN (R 4.1.2)
xfun 0.29 2021-12-14 [1] CRAN (R 4.1.2)
XML 3.99-0.8 2021-09-17 [1] CRAN (R 4.1.0)
xml2 1.3.3 2021-11-30 [1] CRAN (R 4.1.0)
XVector 0.34.0 2021-10-26 [1] Bioconductor
yaml 2.2.2 2022-01-25 [1] CRAN (R 4.1.2)
zlibbioc 1.40.0 2021-10-26 [1] Bioconductor
[1] /mnt/beegfs/mccarthy/backed_up/general/rlyu/Software/Rlibs/4.1
[2] /opt/R/4.1.2/lib/R/library
──────────────────────────────────────────────────────────────────────────────