2022-03-22_FancmCrossoverOutlierChromosome
Ruqian Lyu
3/22/2022
Last updated: 2022-03-22
Checks: 5 1
Knit directory: yeln_2019_spermtyping/
This reproducible R Markdown analysis was created with workflowr (version 1.7.0). The Checks tab describes the reproducibility checks that were applied when the results were created. The Past versions tab lists the development history.
Great job! The global environment was empty. Objects defined in the global environment can affect the analysis in your R Markdown file in unknown ways. For reproduciblity it’s best to always run the code in an empty environment.
The command set.seed(20190102) was run prior to running the code in the R Markdown file. Setting a seed ensures that any results that rely on randomness, e.g. subsampling or permutations, are reproducible.
Great job! Recording the operating system, R version, and package versions is critical for reproducibility.
Nice! There were no cached chunks for this analysis, so you can be confident that you successfully produced the results during this run.
Great job! Using relative paths to the files within your workflowr project makes it easier to run your code on other machines.
Tracking code development and connecting the code version to the results is critical for reproducibility. To start using Git, open the Terminal and type git init in your project directory.
This project is not being versioned with Git. To obtain the full reproducibility benefits of using workflowr, please see ?wflow_start.
Introduction
In this set of analysis, we will fit a linear regression modele to predict the crossover density by chromosome sizes and/or origins of replications to reveal some outlier chromosomes eg. chr11.
Chromosome sizes were obtained from UCSC (mm10)
A linear regression with ploynomial fit (order 3) was fitted to the crossover density by chromosome sizes dataset. The predicted crossover densities were then obtained by supplying the chromosome sizes to the fitted model and the predicted crossover densities were compared with the observed crossover densities for BC1F1 bulk sequencing samples and the single sperm cells.
chrom_info <- GenomeInfoDb::getChromInfoFromUCSC("mm10")
## only for chr1-M
## chrom_info <- chrom_info[grep("_",chrom_info$chrom,invert = TRUE),]
chrom_info <- chrom_info[chrom_info$chrom %in% paste0("chr",1:19),]
BC1F1 samples
bc1f1_samples <- readRDS(file = "output/outputR/analysisRDS/all_rse_count_07-20.rds")


#table(bc1f1_samples$sampleGroup)
bc1f1_samples_male <- bc1f1_samples[,bc1f1_samples$sampleGroup %in% c( "Male_HET","Male_KO","Male_WT")]
bc1f1_samples_female <- bc1f1_samples[,bc1f1_samples$sampleGroup %in% c( "Female_HET","Female_KO","Female_WT")]

totalCOMalePerChrom <- sapply(chrom_info$chrom, function(chrom){
  colSums((as.matrix(assay(bc1f1_samples_male[as.character(seqnames(bc1f1_samples_male))==chrom,]))))
})
totalCOFemalePerChrom <- sapply(chrom_info$chrom, function(chrom){
  colSums((as.matrix(assay(bc1f1_samples_female[as.character(seqnames(bc1f1_samples_female))==chrom,]))))
})

totalCOBC1F1 <- rbind(totalCOMalePerChrom,totalCOFemalePerChrom)

totalCOBC1F1 <- data.frame(totalCOBC1F1) %>% tibble::rownames_to_column(var = "sid") %>%
  mutate(sampleGroup = plyr::mapvalues(sid, from = bc1f1_samples$Sid,
                                       to = bc1f1_samples$sampleGroup)) %>%
  tidyr::pivot_longer(cols = paste0("chr",1:19),
                      names_to = "chrom",
                      values_to = "count")
totalCOBC1F1CrossoverDensity <- totalCOBC1F1 %>% group_by(sampleGroup,chrom) %>%
  summarise(meanCO = mean(count),
            totalCO = sum(count))
`summarise()` has grouped output by 'sampleGroup'. You can override using the
`.groups` argument.totalCOBC1F1CrossoverDensity <- merge(totalCOBC1F1CrossoverDensity,chrom_info,
by = "chrom")
totalCOBC1F1CrossoverDensity$crossoverDensity <- totalCOBC1F1CrossoverDensity$meanCO/totalCOBC1F1CrossoverDensity$size*1e6Crossover density per chromosome is the mean crossovers per Mb across the samples examined.
fitLM <- function(plot_df){
  poly3 <- lm(formula = crossoverDensity ~ poly(size, 3) ,plot_df)

summary(poly3)

p <- ggplot(plot_df)+geom_point(mapping = aes(y = crossoverDensity , x = size ))+
  theme_bw(base_size = 16)+
  geom_smooth(mapping = aes(y = crossoverDensity , x = size),
              formula=y ~ poly(x, 3),
              method = "lm")+
   ggrepel::geom_text_repel(mapping = aes(y = crossoverDensity , x = size,label=chrom ))


p1 <- p + ggtitle(paste0(sampleType, " adj. R-squared ",
                         round(summary(poly3)$adj.r.squared,2)))

predictedDensity <- predict(poly3,plot_df)

p_o <- lm(formula = predictedDensity ~ plot_df$crossoverDensity)

summary(p_o)

p2 <- plot_df %>% mutate(densityPredict = predictedDensity) %>%
  ggplot()+geom_point(mapping = aes(x = crossoverDensity ,y = predictedDensity ))+
  theme_bw(base_size = 16)+
  geom_smooth(mapping = aes(y = predictedDensity , x = crossoverDensity),
              formula=y ~ x,method = "lm")+
   ggrepel::geom_text_repel(mapping = aes(x = crossoverDensity,
                                          y = predictedDensity, label=chrom ))+
  xlab("Crossover density observed")+  ylab("Crossover density predicted")+
  ggtitle(paste0(sampleType, " adj. R-squared ",round(summary(p_o)$adj.r.squared,2)))

return(list(p1,p2))
}
plots_own_data_bc1f1 <- list()
counter <- 1
for( sampleType in unique(totalCOBC1F1CrossoverDensity$sampleGroup)){
plot_df <- totalCOBC1F1CrossoverDensity[totalCOBC1F1CrossoverDensity$sampleGroup== sampleType,]
plots_own_data_bc1f1[[counter]] <- fitLM(plot_df)[[1]]
plots_own_data_bc1f1[[counter+1]] <- fitLM(plot_df)[[2]]
counter <- counter + 2
}Fit linear regression model that uses chromosome sizes to predict chromosome crossover density using our data
gridExtra::marrangeGrob(plots_own_data_bc1f1,nrow =2,ncol= 2,right=" ")Warning: ggrepel: 1 unlabeled data points (too many overlaps). Consider
increasing max.overlaps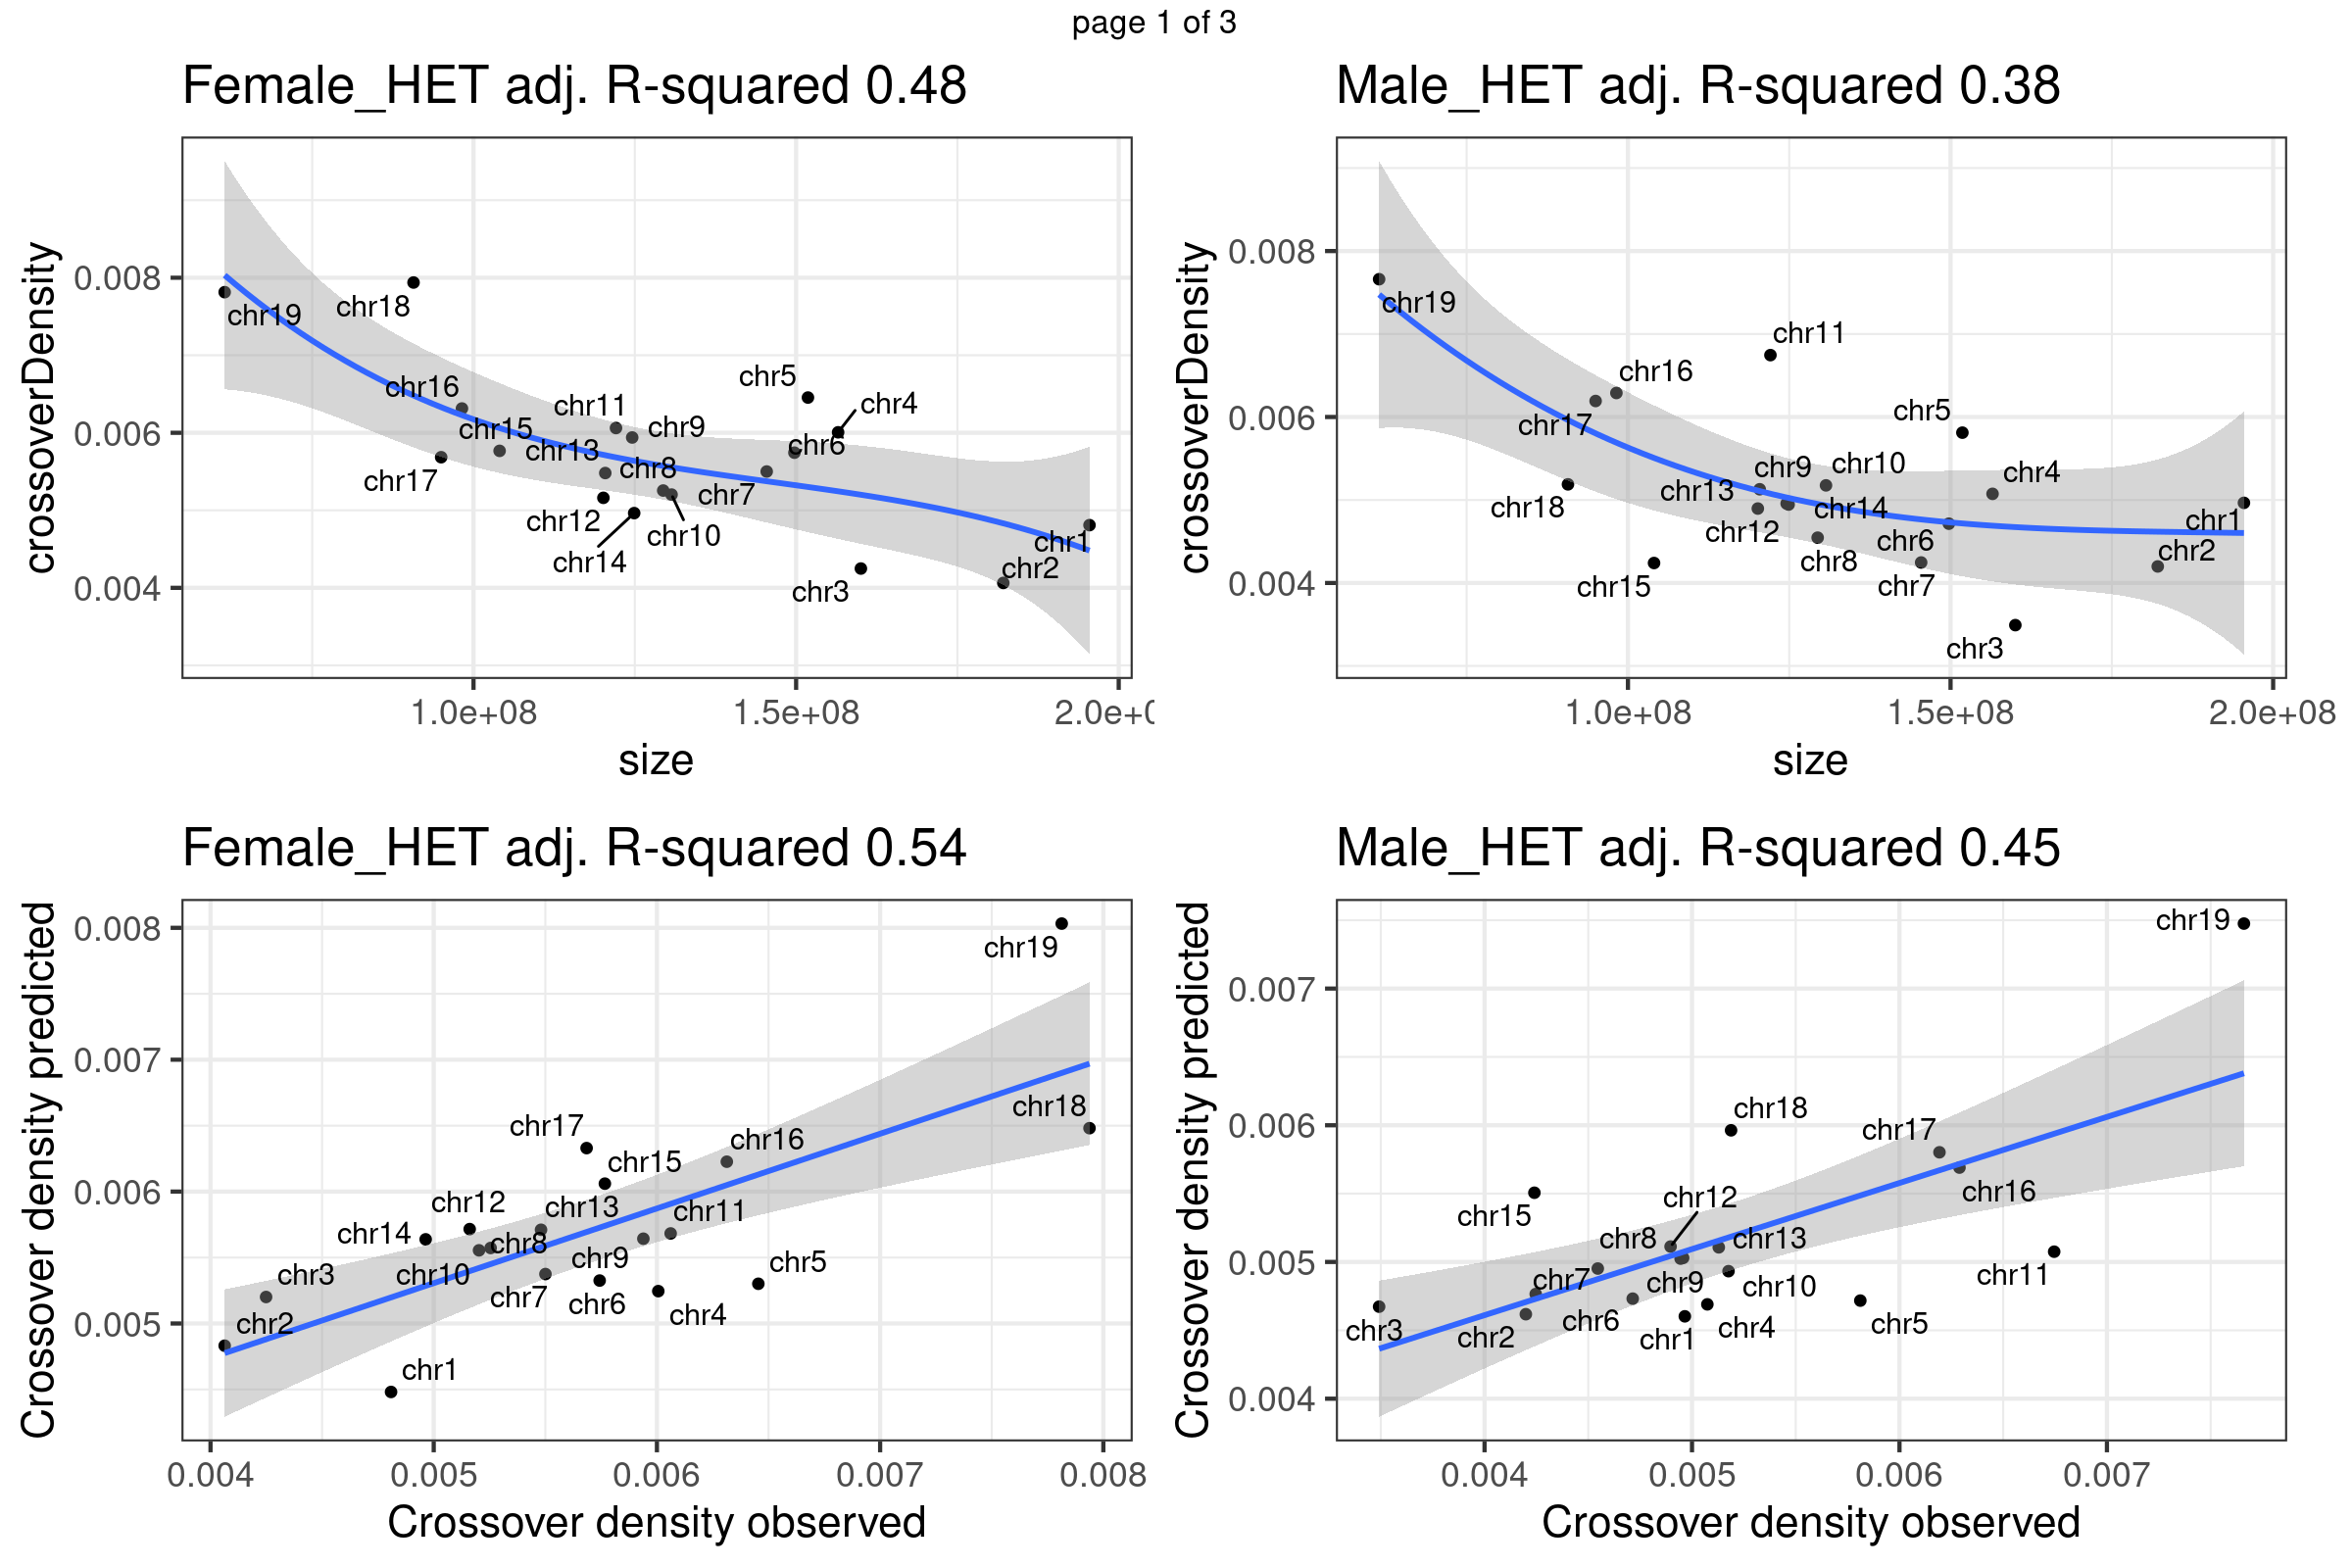
Warning: ggrepel: 3 unlabeled data points (too many overlaps). Consider
increasing max.overlaps
Warning: ggrepel: 6 unlabeled data points (too many overlaps). Consider
increasing max.overlaps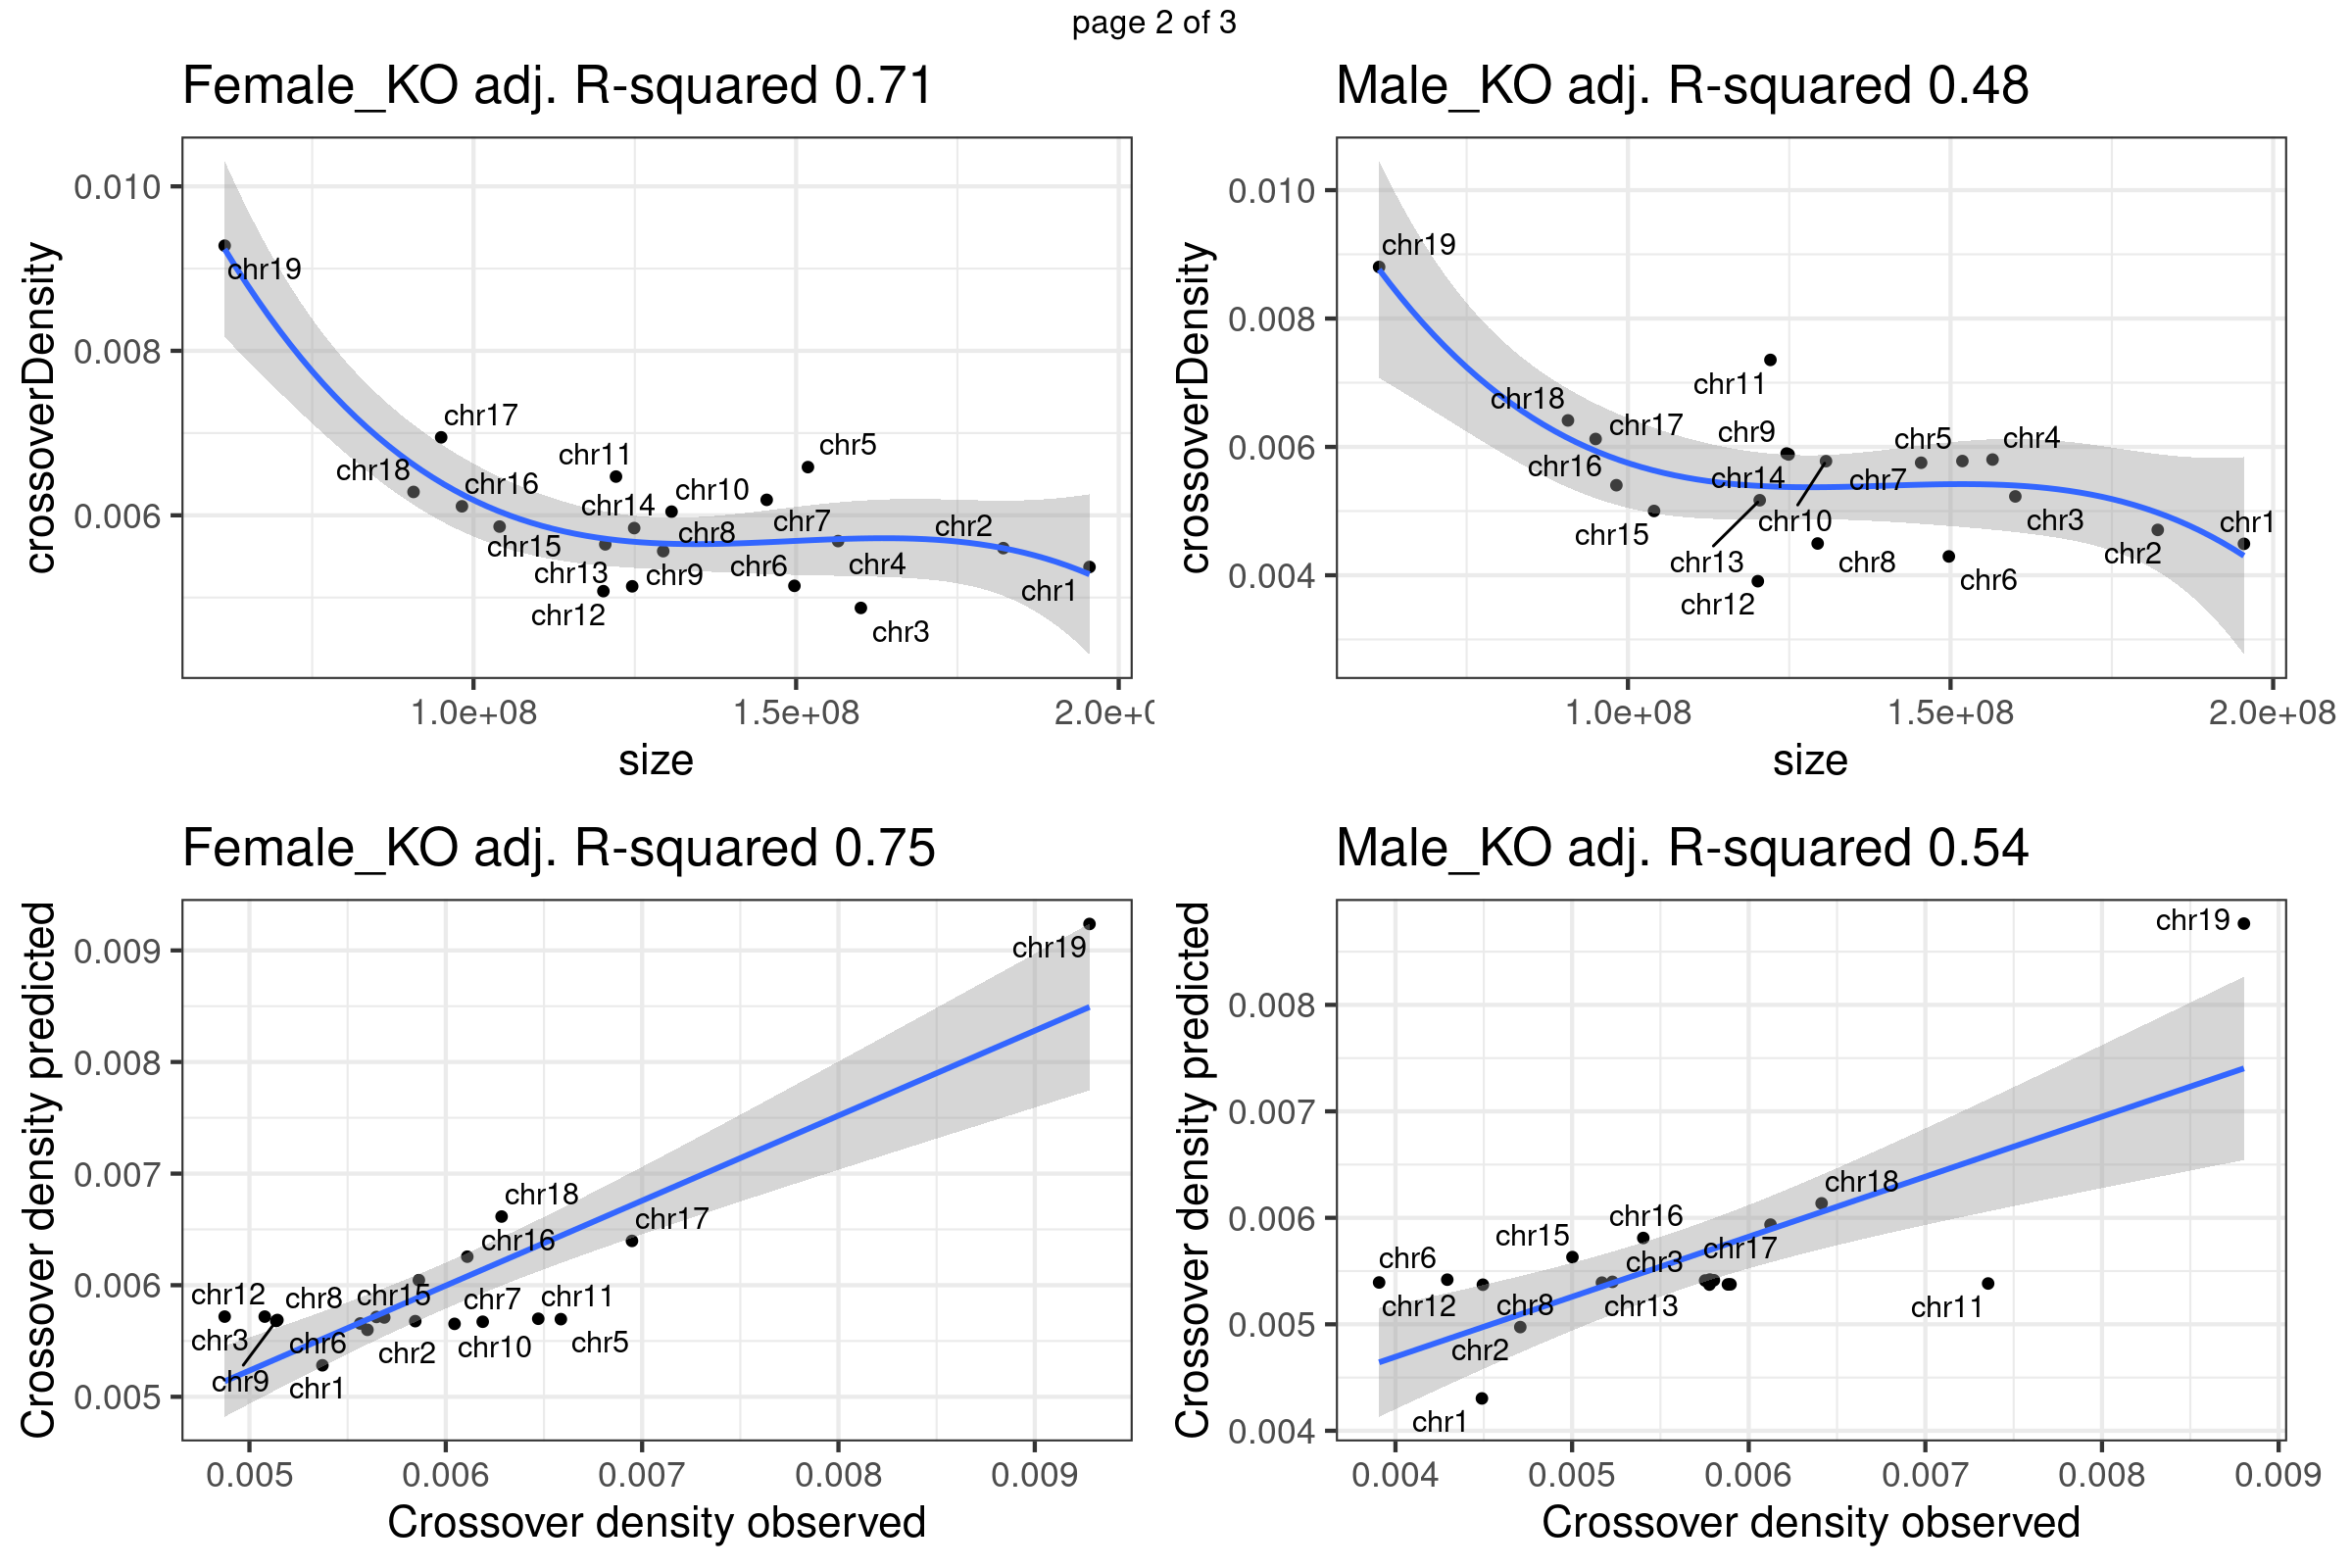
Warning: ggrepel: 7 unlabeled data points (too many overlaps). Consider
increasing max.overlaps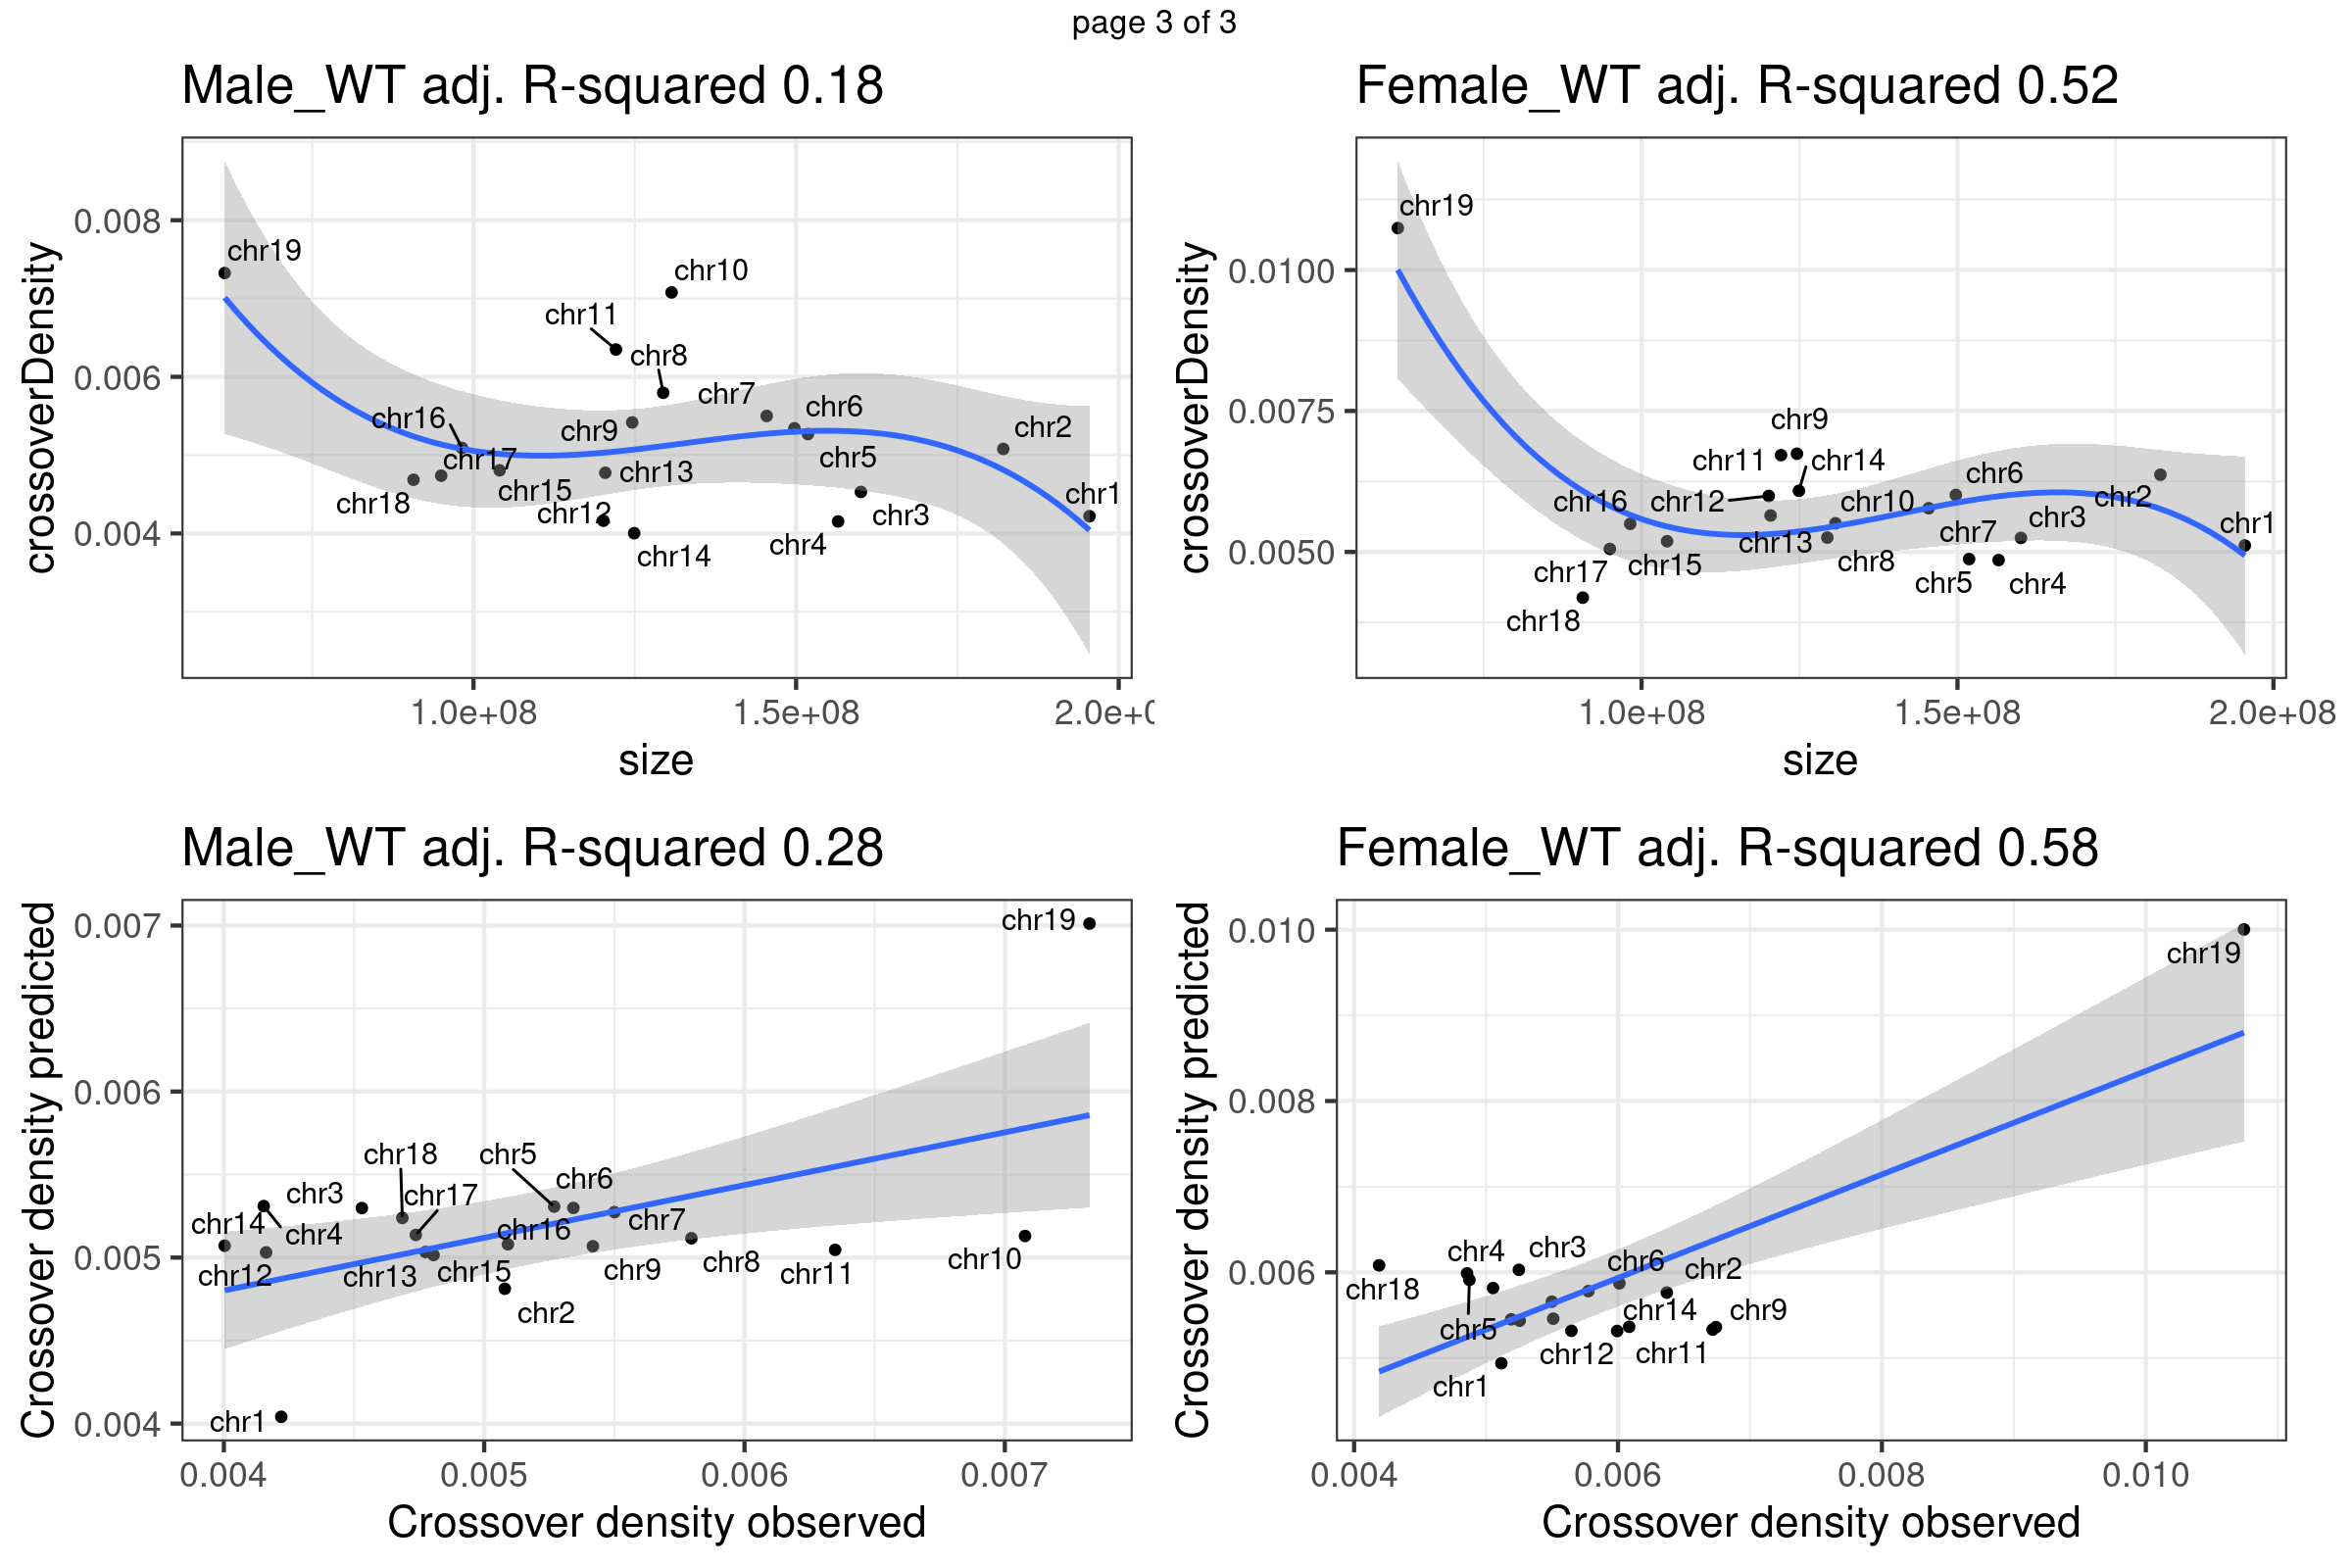
scCNV samples
# scCNV <-
#   readRDS(file  = "~/Projects/rejy_2020_single-sperm-co-calling/output/outputR/analysisRDS/allSamples.setting4.rds")

scCNV <-
  readRDS(file  = "~/Projects/rejy_2020_single-sperm-co-calling/output/outputR/analysisRDS/countsAll-settings4.3-scCNV-CO-counts_07-mar-2022.rds")
x <- c("mutant","mutant","wildtype","mutant",
                                           "wildtype","wildtype")
xx <- c("Fancm-/-","Fancm-/-","Fancm+/+","Fancm-/-",
                                           "Fancm+/+","Fancm+/+")
crossover_counts <- scCNV
crossover_counts$sampleType <- plyr::mapvalues(crossover_counts$sampleGroup,from = c("WC_522",
                                                               "WC_526",
                                                               "WC_CNV_42",
                                                               "WC_CNV_43",
                                                               "WC_CNV_44",
                                                               "WC_CNV_53"),
                                    to =x)
totalCOScCNVPerChrom <- sapply(chrom_info$chrom, function(chrom){
colSums((as.matrix(assay(crossover_counts[as.character(seqnames(crossover_counts))==chrom,]))))
})
totalCOScCNV <- data.frame(totalCOScCNVPerChrom) %>% tibble::rownames_to_column(var = "barcode") %>%
mutate(sampleGroup = plyr::mapvalues(barcode, from = crossover_counts$barcodes,
to = crossover_counts$sampleType)) %>% tidyr::pivot_longer(cols = paste0("chr",1:19),
names_to = "chrom",
values_to = "count")
totalCOScCNVCrossoverDensity <- totalCOScCNV %>% group_by(sampleGroup,chrom) %>%
summarise(meanCO = mean(count),
totalCO = sum(count))`summarise()` has grouped output by 'sampleGroup'. You can override using the
`.groups` argument.totalCOScCNVCrossoverDensity <- merge(totalCOScCNVCrossoverDensity,chrom_info,
by = "chrom")
totalCOScCNVCrossoverDensity$crossoverDensity <- totalCOScCNVCrossoverDensity$meanCO/totalCOScCNVCrossoverDensity$size*1e6plots_own_data_scCNV <- list()
counter <- 1
for( sampleType in unique(totalCOScCNVCrossoverDensity$sampleGroup)){
plot_df <- totalCOScCNVCrossoverDensity[totalCOScCNVCrossoverDensity$sampleGroup== sampleType,]
plots_own_data_scCNV[[counter]] <- fitLM(plot_df)[[1]]
plots_own_data_scCNV[[counter+1]] <- fitLM(plot_df)[[2]]
counter <- counter + 2
}Fit linear regression model using chromosome sizes to predict chromosome crossover density using our data
gridExtra::marrangeGrob(plots_own_data_scCNV,nrow =2,ncol= 2,right = " ")Warning: ggrepel: 5 unlabeled data points (too many overlaps). Consider
increasing max.overlaps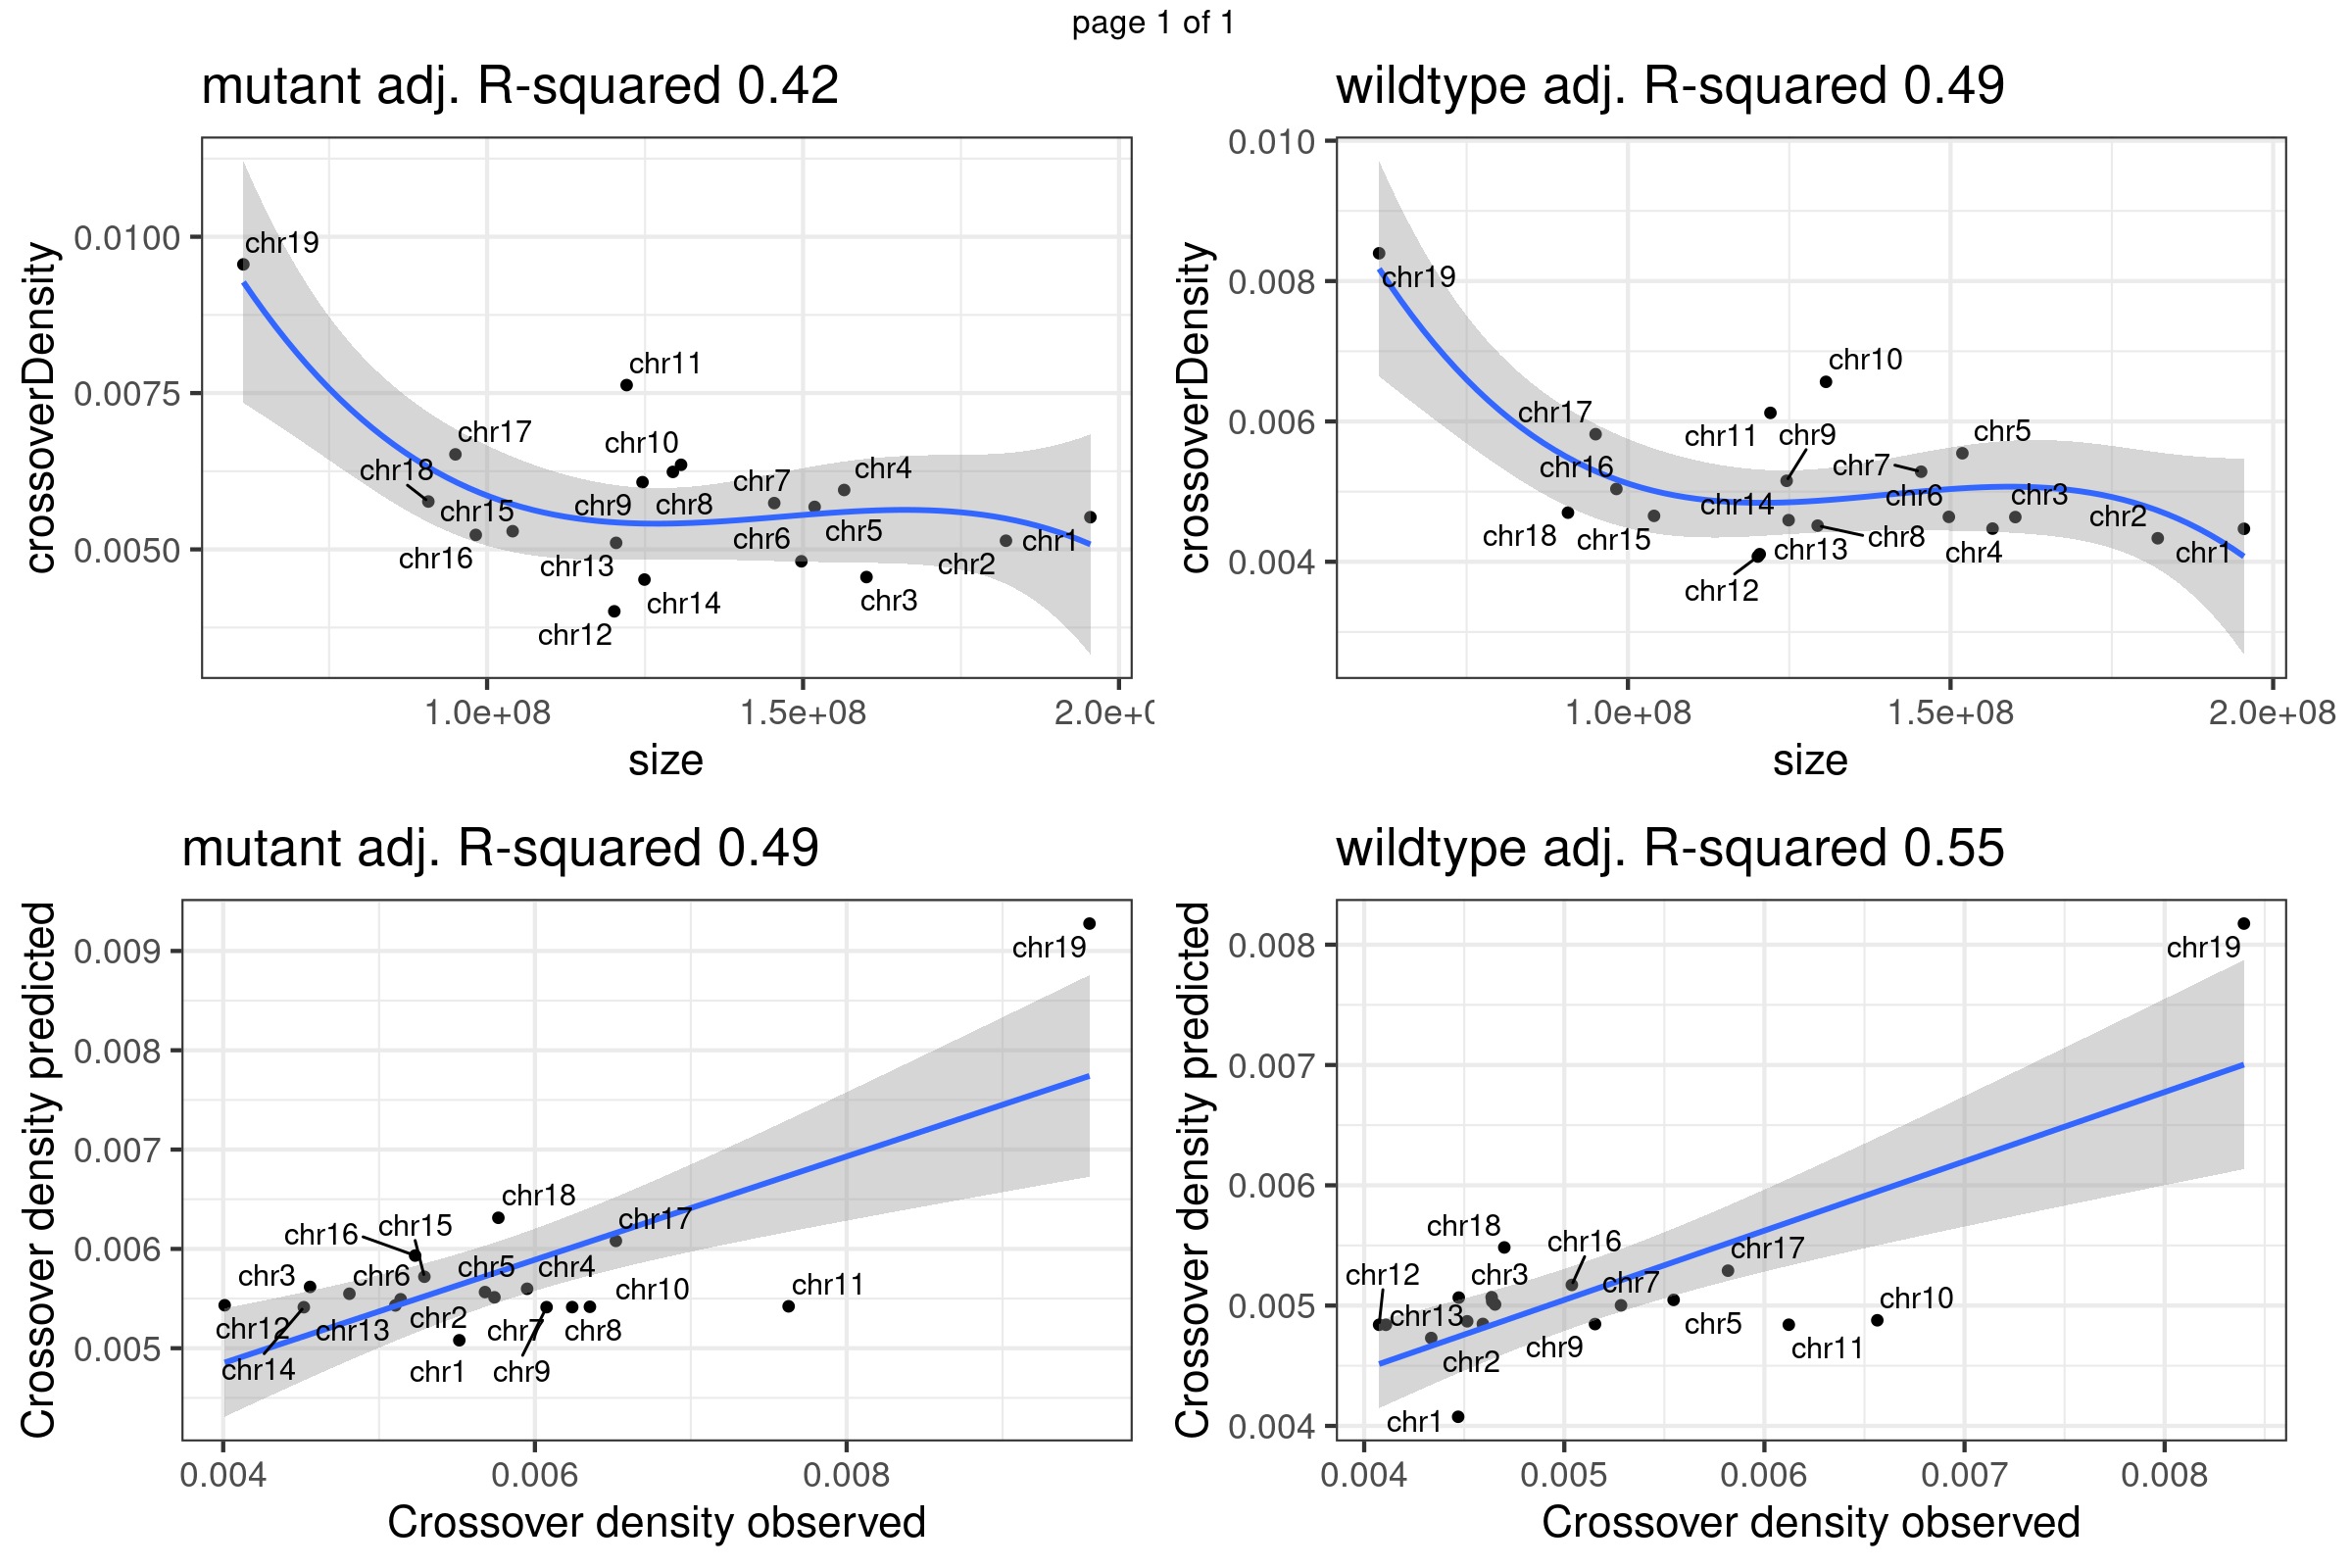
Summary
Chr11 does show as a outlier chromosome in the relation of chromosome size and crossover density (Per Mb) among all autosomes. There is observed difference in the relation of chromosome size versus crossover density in sample groups. More investigation may be helpful.
Using published data from Yin Yi 2019
As the published study Pratto et al showed (Figure6 A C D) that chromosome sizes or replication speed does not provide sufficient information for modeling chromosome level crossover density. On the other hand, the multivariate linear regression model using chromosome sizes, replication speed and DSBs determins the chromosome crossover densities.
Load crossover breakpoint table TableS3
Two strains were tested from Yi et al, B6_CAST and B6_Spret.
suppressPackageStartupMessages({
  library(readxl)
})
suppressWarnings(TableS3_Yin_Yi_science_direct_2019 <- read_excel("data/public_dataset/TableS3_Yin-Yi_science-direct-2019.xls",
skip = 1))
New names:
* `` -> ...2
* `` -> ...3
* `` -> ...4
* `` -> ...5
* `` -> ...6
* ...# View(TableS3_Yin_Yi_science_direct_2019)
spret_rowIndex <- grep("Spret",TableS3_Yin_Yi_science_direct_2019$`Strain: B6 x Spret 1C cells`)
cast_rowIndex <- grep("Cast",TableS3_Yin_Yi_science_direct_2019$`Strain: B6 x Spret 1C cells`)b6_cast_1cCells <- TableS3_Yin_Yi_science_direct_2019[cast_rowIndex:nrow(TableS3_Yin_Yi_science_direct_2019),]
b6_cast_1cCells[,7] <- NULL
colnames(b6_cast_1cCells) <- b6_cast_1cCells[2,]
b6_cast_1cCells <- b6_cast_1cCells[c(-1,-2),]
b6_spret_1cCells <- TableS3_Yin_Yi_science_direct_2019[1:(spret_rowIndex-1),]
b6_spret_1cCells[,7] <- NULL
colnames(b6_spret_1cCells) <- b6_spret_1cCells[1,]
b6_spret_1cCells <- b6_spret_1cCells[c(-1),]
head(b6_spret_1cCells)# A tibble: 6 × 6
CELL_ID CHROM START END SCORE DISTANCE
<chr> <chr> <chr> <chr> <chr> <chr>
1 yi186_AGGATG.CCATGGAACAAGCTC chr1 72032891 72519028 1 486137
2 yi186_AGGATG.CCATGGAACAAGCTC chr3 34455045 34715218 1 260173
3 yi186_AGGATG.CCATGGAACAAGCTC chr4 102674910 102783454 1 108544
4 yi186_AGGATG.CCATGGAACAAGCTC chr7 138199462 139468548 1 1269086
5 yi186_AGGATG.CCATGGAACAAGCTC chr8 48528200 48874306 1 346106
6 yi186_AGGATG.CCATGGAACAAGCTC chr9 47163155 47258921 1 95766 all_1cCells <- rbind(b6_spret_1cCells,b6_cast_1cCells)n_cast <- length(unique(b6_cast_1cCells$CELL_ID))
n_spret <- length(unique(b6_spret_1cCells$CELL_ID))
b6_cast_1cCells <- b6_cast_1cCells %>% filter(!is.na(CHROM),!CHROM %in% c("chrX","chrY")) %>% group_by(CHROM) %>% summarise(crossover_count = n()) %>% left_join(chrom_info,by =c("CHROM" ="chrom" )) %>%
mutate(strain = "b6_cast",crossoverDensity = crossover_count/size*1e6/n_cast)
b6_spret_1cCells <- b6_spret_1cCells %>% filter(!is.na(CHROM),!CHROM %in% c("chrX","chrY")) %>% group_by(CHROM) %>% summarise(crossover_count = n()) %>% left_join(chrom_info,by =c("CHROM" ="chrom" )) %>%
mutate(strain = "b6_spret",crossoverDensity = crossover_count/size*1e6/n_spret)
all_1cCells <- all_1cCells %>% filter(!is.na(CHROM),!CHROM %in% c("chrX","chrY")) %>% group_by(CHROM) %>% summarise(crossover_count = n()) %>% left_join(chrom_info,by =c("CHROM" ="chrom" )) %>%
mutate(strain = "both",crossoverDensity = crossover_count/size*1e6/(n_spret+n_cast))Fit linear regression with Polynomial model to crossover dataset from Yin Yi el al
Correlation of our crossover distribution with (two strains) Yi et al:
totalCrossoverDensity <- rbind(b6_cast_1cCells,b6_spret_1cCells)
totalCrossoverDensity$chrom <- totalCrossoverDensity$CHROM
b6_cast_1cCells$chrom <- b6_cast_1cCells$CHROM
all_1cCells$chrom <- all_1cCells$CHROM
totalCOBC1F1CrossoverDensity %>% left_join(all_1cCells, by ="chrom",
                                           suffix=c(".BC1F1",".Yi")) %>%
  ggplot()+geom_point(mapping = aes(x = crossoverDensity.BC1F1,
                                    y = crossoverDensity.Yi))+facet_wrap(.~sampleGroup)+
  theme_bw(base_size = 18)+geom_smooth(mapping = aes(x = crossoverDensity.BC1F1,
                                    y = crossoverDensity.Yi),formula=y ~ x,method = "lm")+
  geom_abline(slope = 1,linetype  = 2,size = 1.2,color = "grey")
plots <- list()
counter <- 1

for( sampleType in unique(totalCrossoverDensity$strain)){
 plot_df <- totalCrossoverDensity[totalCrossoverDensity$strain== sampleType,]
 plots[[counter]] <- fitLM(plot_df)[[1]]
 plots[[counter+1]] <- fitLM(plot_df)[[2]]+xlab(paste0("Crossover density ",sampleType," 1C cells"))
 counter <- counter + 2

}
Linear regression on Yi et al crossover dataset (two strains)
gridExtra::marrangeGrob(plots,nrow =2,ncol= 2,right = " ")Warning: ggrepel: 3 unlabeled data points (too many overlaps). Consider
increasing max.overlaps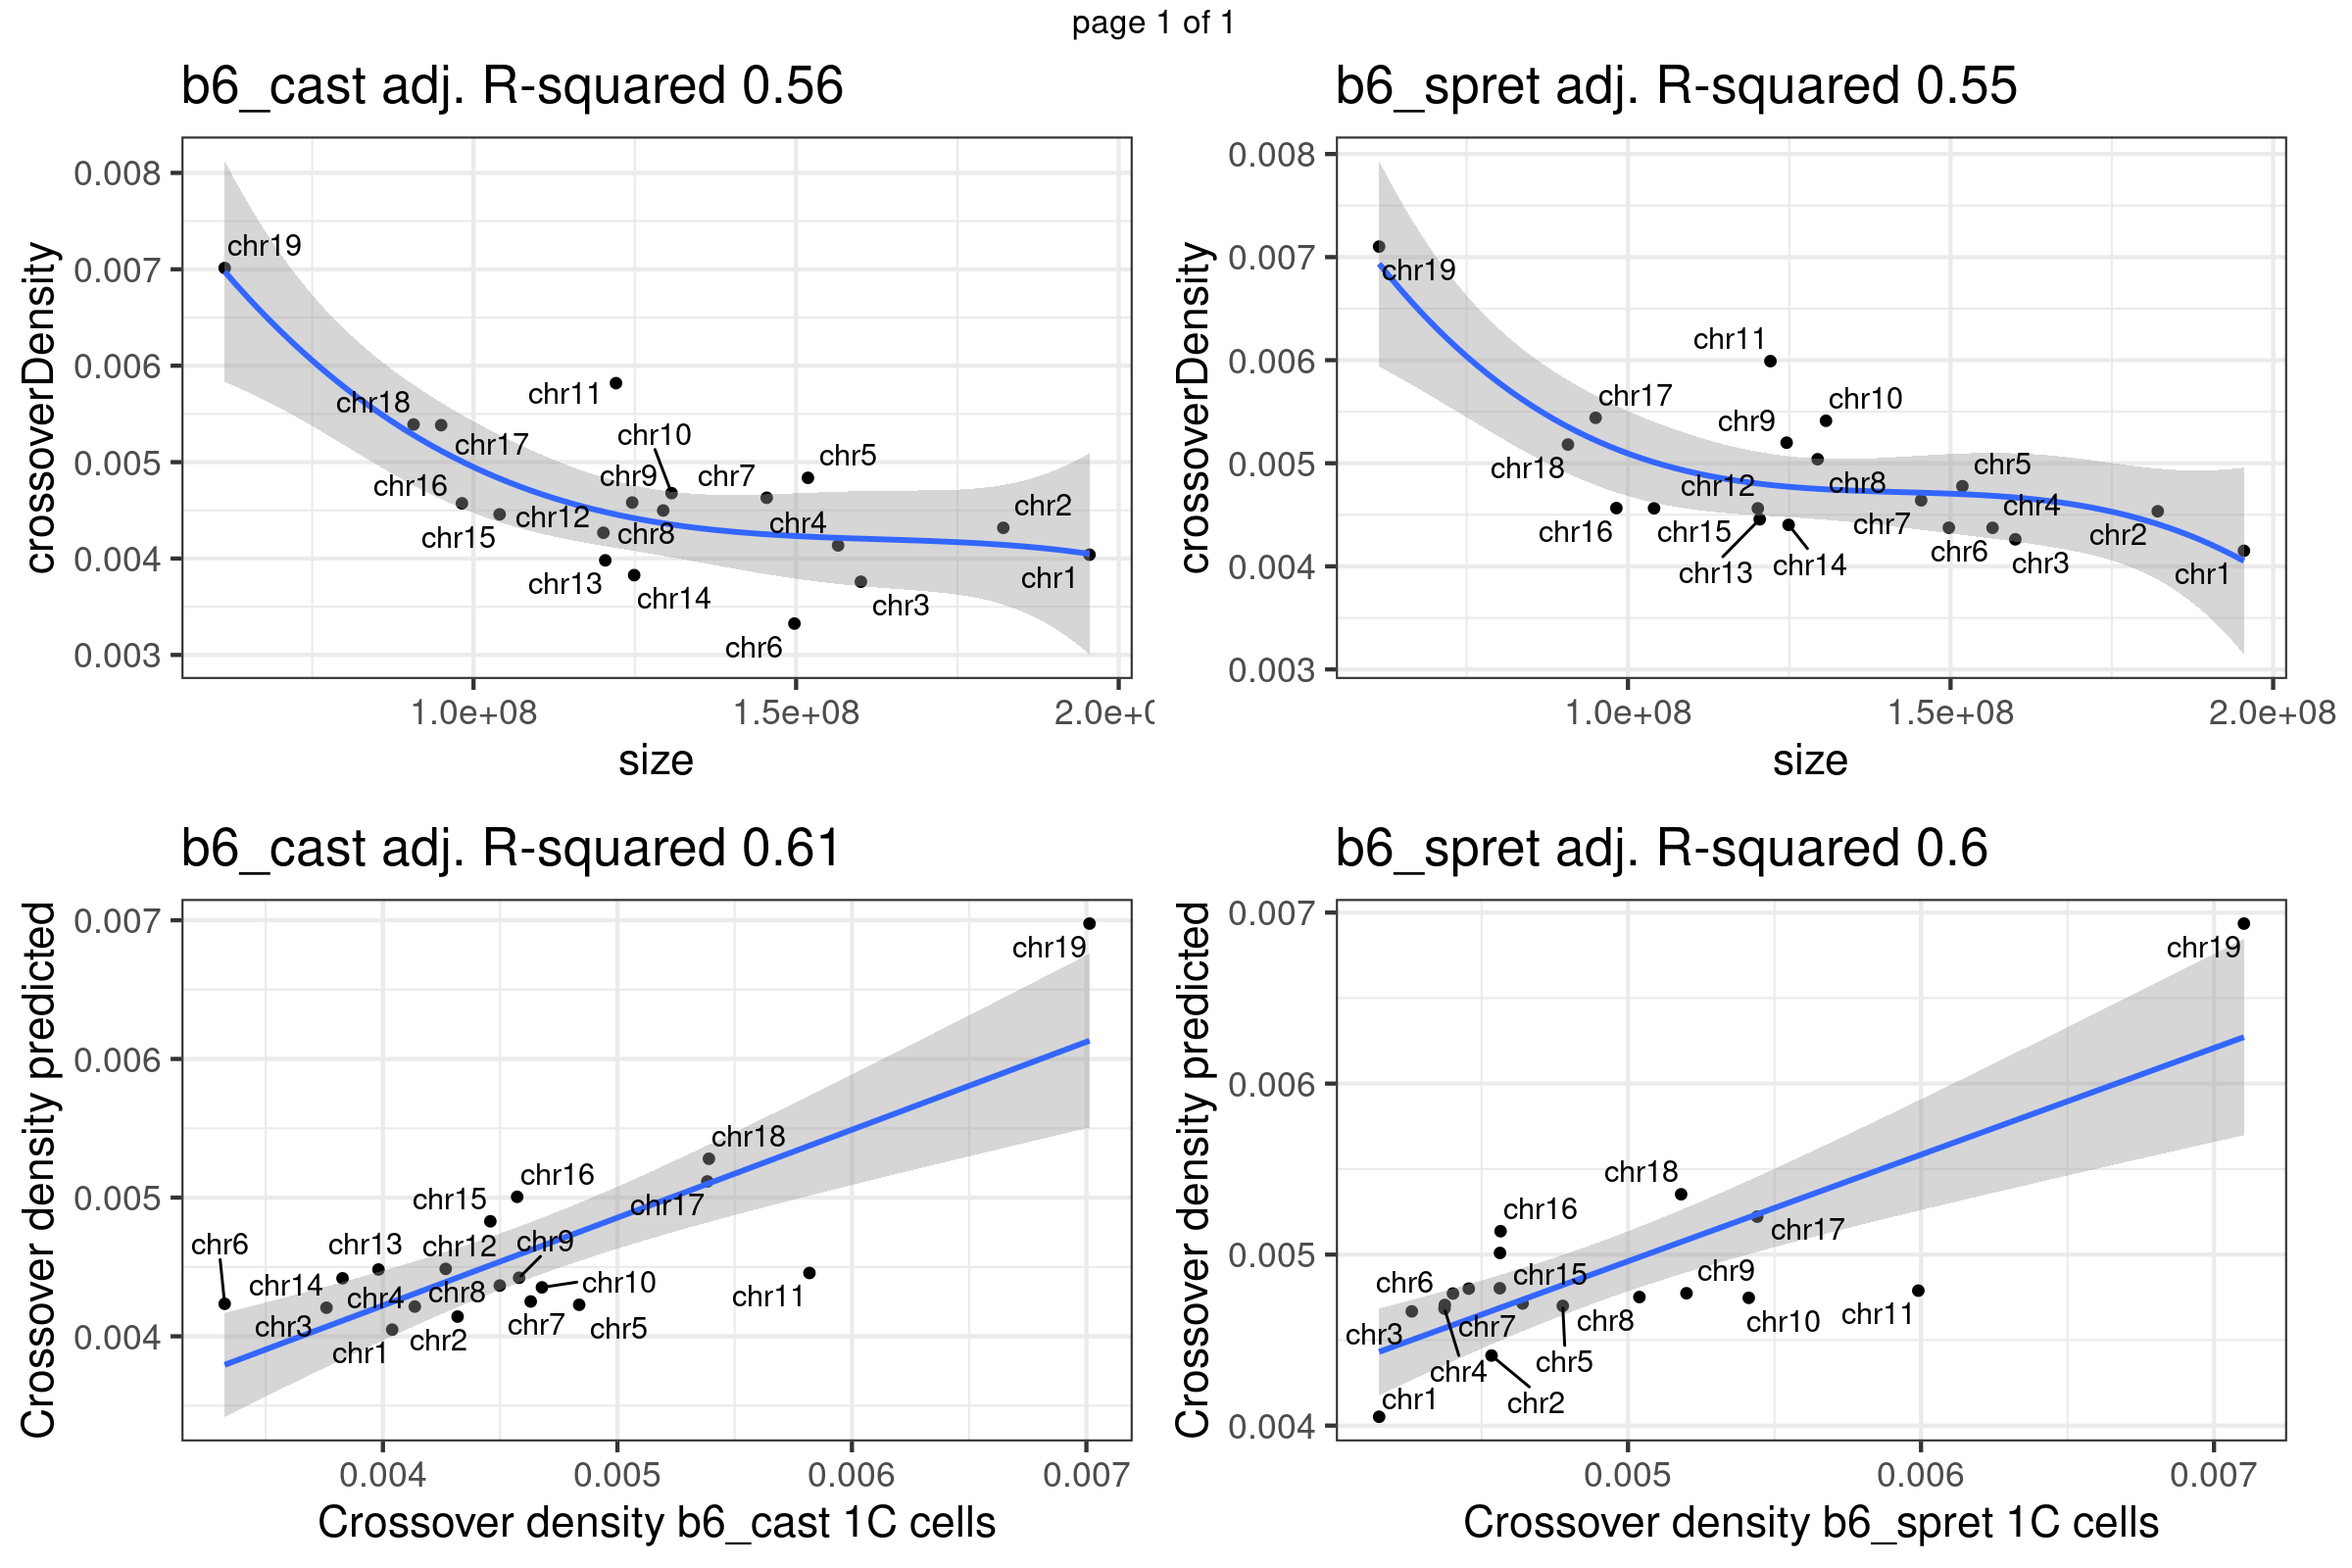
Combining crossovers from two strains:
sampleType <- "both"

all_1cCells$chrom <- all_1cCells$CHROM
fitLM(all_1cCells)[[1]]
fitLM(all_1cCells)[[2]]+xlab(paste0("Crossover density ",sampleType," 1C cells"))
Using fitted model (B6_CAST) from public data to compare with our crossover distribution
The predicted crossover densities are the predictions from using the fitted linear regression model (crossover density by chromosome size) on the B6_CAST data from Yi et al.
The observed crossover densities are from our datasets.
poly3_size <- lm(formula = crossoverDensity ~ poly(size, 3), b6_cast_1cCells)

fitMD_perSampleType <- function(plot_df,poly3 = poly3_size){

  predictedDensity <- predict(poly3,plot_df)

  p_o <- lm(formula = predictedDensity ~ plot_df[,"crossoverDensity"])

  # summary(p_o)
  titleSample <- sampleType
  if(sampleType=="Male_KO"){
  titleSample <-   "Bulk BC1F1 Fancm-/-"
  } else if (sampleType=="Male_WT"){
   titleSample <-  "Bulk BC1F1 Fancm+/+"
  } else if (sampleType=="Male_HET"){
   titleSample <-  "Bulk BC1F1 Fancm+/-"
  }


  p2 <- plot_df%>% mutate(densityPredict = predictedDensity) %>%
    ggplot()+geom_point(mapping = aes(x = crossoverDensity ,y = predictedDensity ))+theme_bw(base_size = 16)+
    geom_smooth(mapping = aes(y = predictedDensity , x = crossoverDensity),formula=y ~ x,method = "lm")+
     ggrepel::geom_text_repel(mapping = aes(x = crossoverDensity   , y = predictedDensity, label=chrom ))+
    xlab("Crossover density observed")+  ylab("Crossover density predicted")+
    ggtitle(paste0(titleSample, " adj. R-squared ",round(summary(p_o)$adj.r.squared,2)))

  p2+geom_abline(slope = 1,linetype  = 2,size = 1.2,color = "grey")
}


fitMD_perCellType <- function(plot_df,poly3 = poly3_size){

  predictedDensity <- predict(poly3,plot_df)

  p_o <- lm(formula = predictedDensity ~ plot_df[,"crossoverDensity"])

  # summary(p_o)
  title <- ifelse(sampleType=="mutant",  "F1 sperm Fancm-/-", "F1 sperm Fancm+/+")
  p2 <- plot_df %>% mutate(densityPredict = predictedDensity) %>%
    ggplot()+geom_point(mapping = aes(x = crossoverDensity ,y = predictedDensity ))+theme_bw(base_size = 16)+
    geom_smooth(mapping = aes(y = predictedDensity , x = crossoverDensity),formula=y ~ x,method = "lm")+
    ggrepel::geom_text_repel(mapping = aes(x = crossoverDensity   , y = predictedDensity, label=chrom ))+
    xlab("Crossover density observed")+  ylab("Crossover density predicted")+
    ggtitle(paste0(title, " adj. R-squared ",round(summary(p_o)$adj.r.squared,2)))

  p2+geom_abline(slope = 1,linetype  = 2,size = 1.2,color = "grey")
}
plots_compareTofitted <- list()
counter <- 1
for( sampleType in unique(totalCOBC1F1CrossoverDensity$sampleGroup)){
plot_df <- totalCOBC1F1CrossoverDensity[totalCOBC1F1CrossoverDensity$sampleGroup== sampleType,]
plots_compareTofitted[[counter]] <- fitMD_perSampleType(plot_df=plot_df,poly3=poly3_size)
counter <- counter + 1
}Predicted crossover density using fitted model (poly(size,3)) from using Yi et al data
bc1f1_plist <- lapply(plots_compareTofitted, function(pl){
  pl+theme(axis.title.x = element_blank(),
           plot.margin = margin(t=10,r=17,b = 15))})


gridExtra::marrangeGrob(bc1f1_plist[c(1,3,6)],nrow = 2,ncol=2,left = " ", right = " ")
Warning: ggrepel: 3 unlabeled data points (too many overlaps). Consider
increasing max.overlaps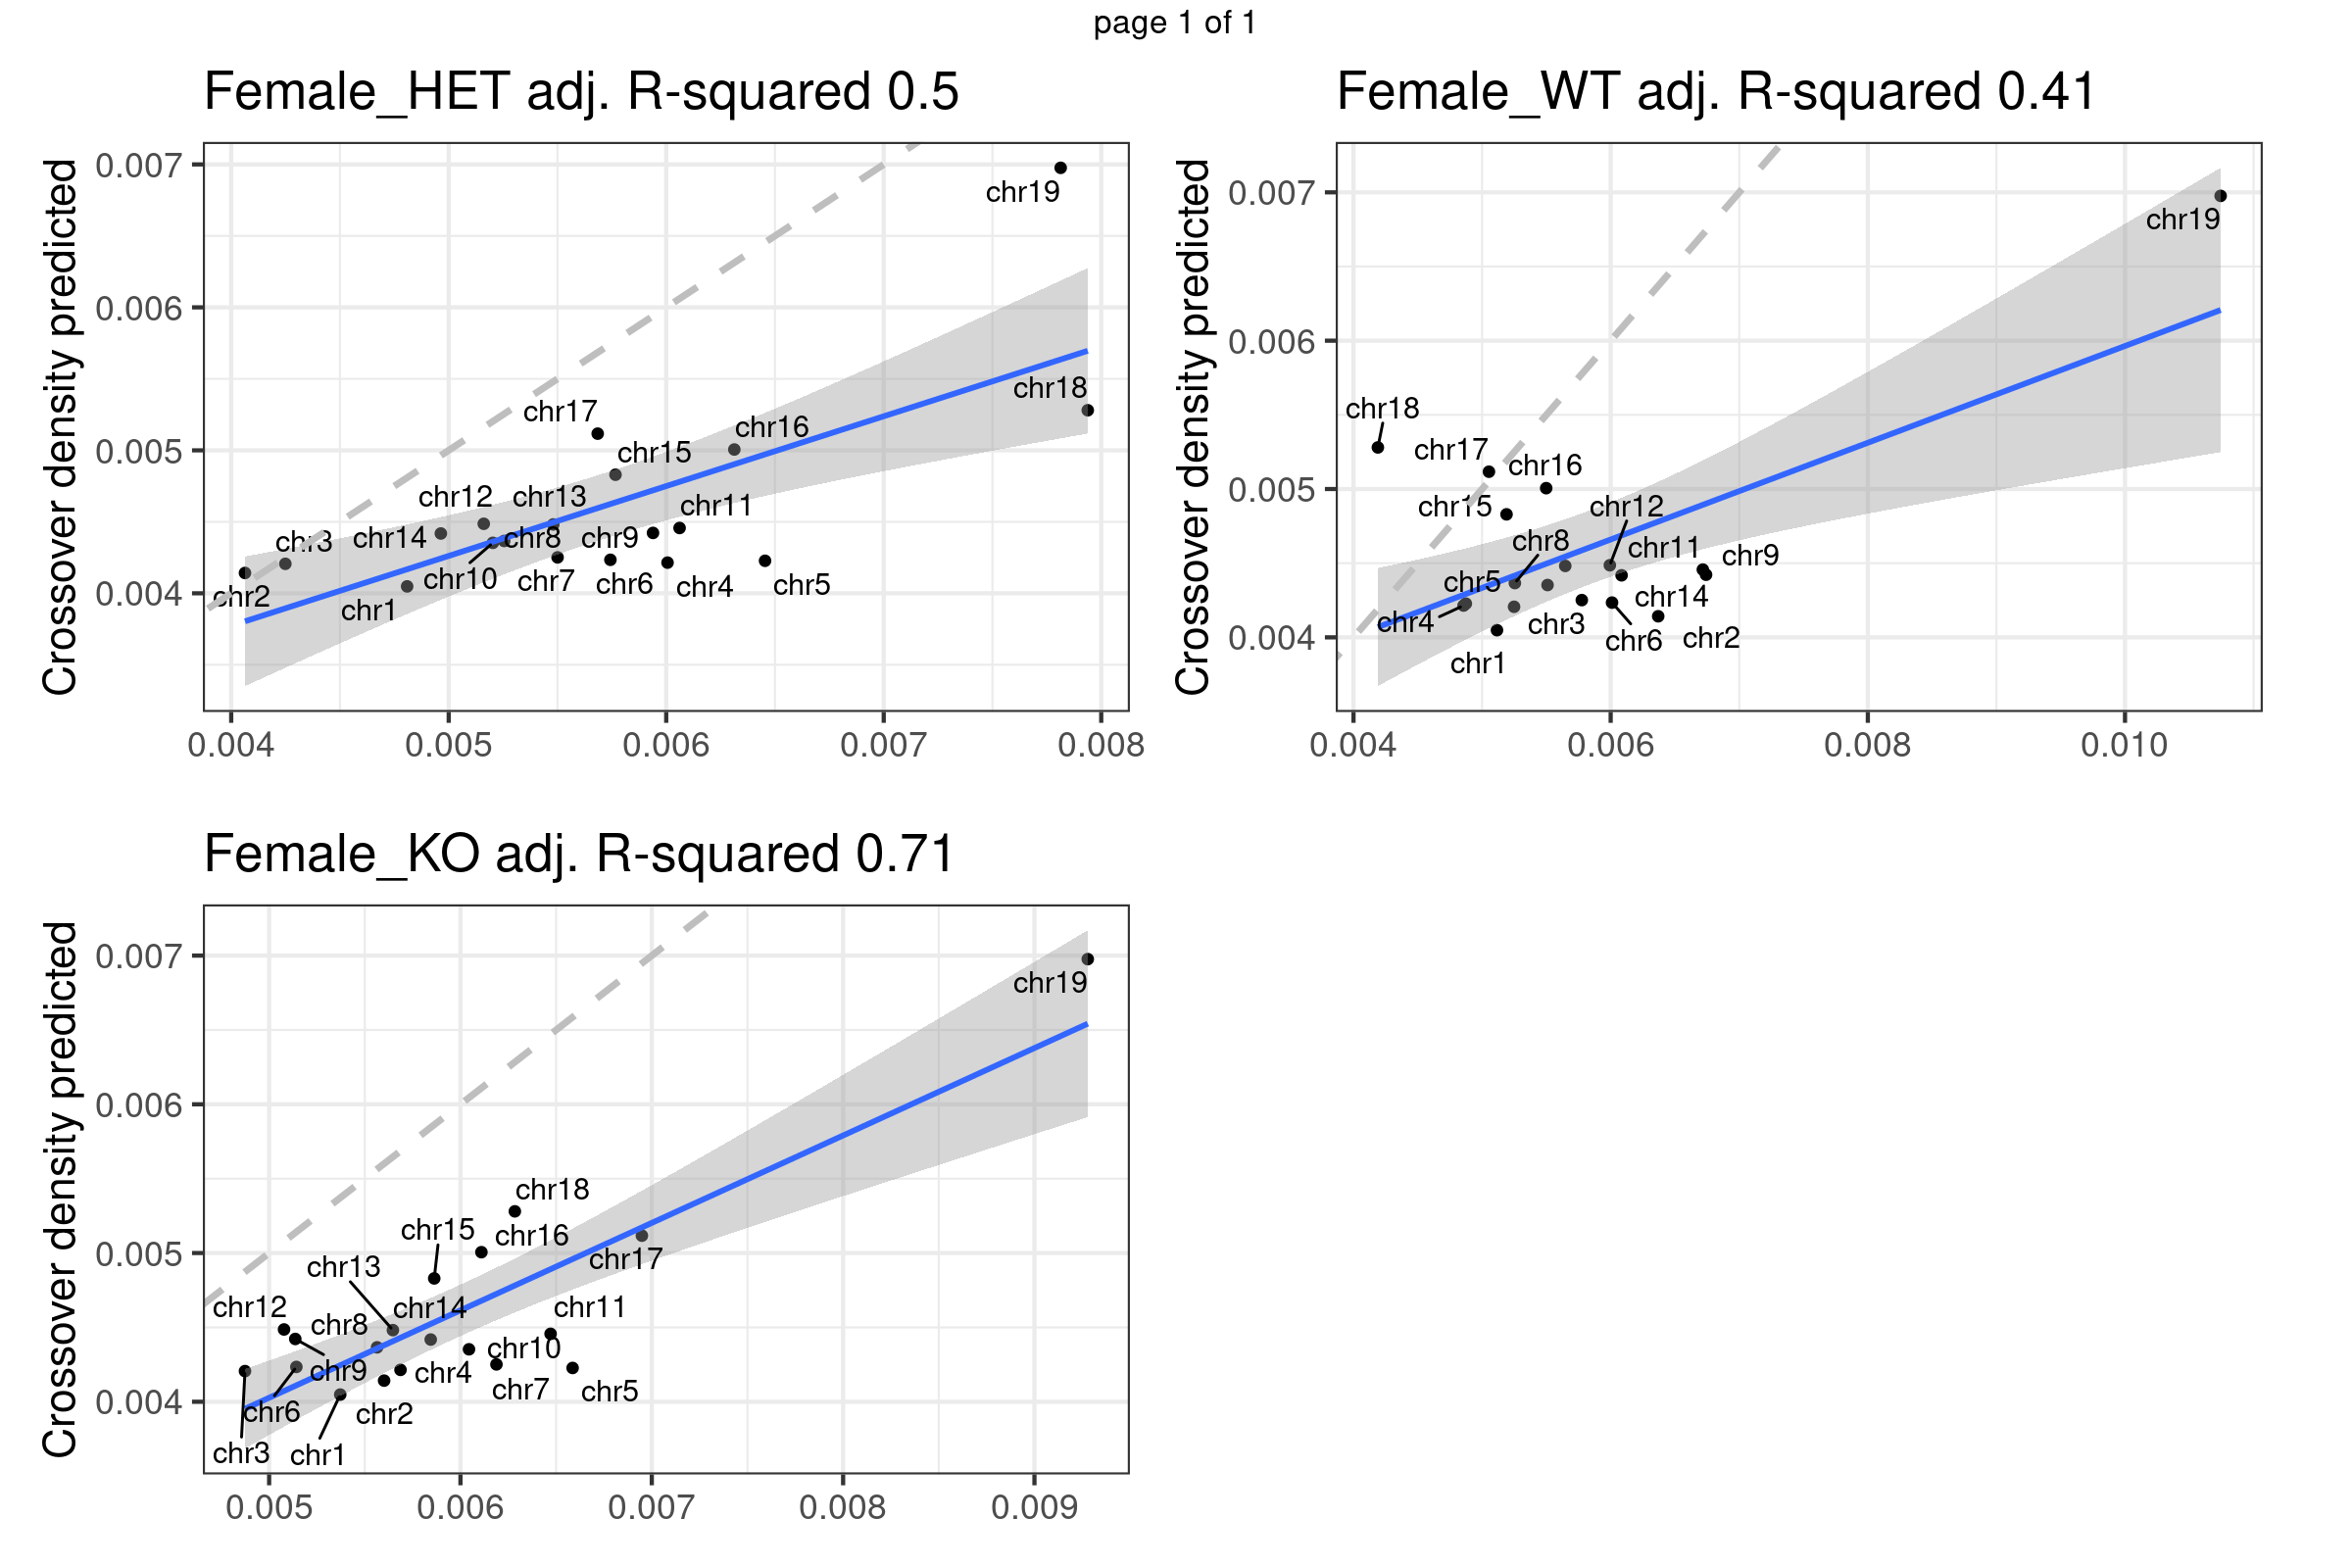
gridExtra::marrangeGrob(bc1f1_plist[c(2,4,5)],nrow = 2,ncol=2,left = " ", right = " ")Warning: ggrepel: 3 unlabeled data points (too many overlaps). Consider
increasing max.overlapsWarning: ggrepel: 1 unlabeled data points (too many overlaps). Consider
increasing max.overlaps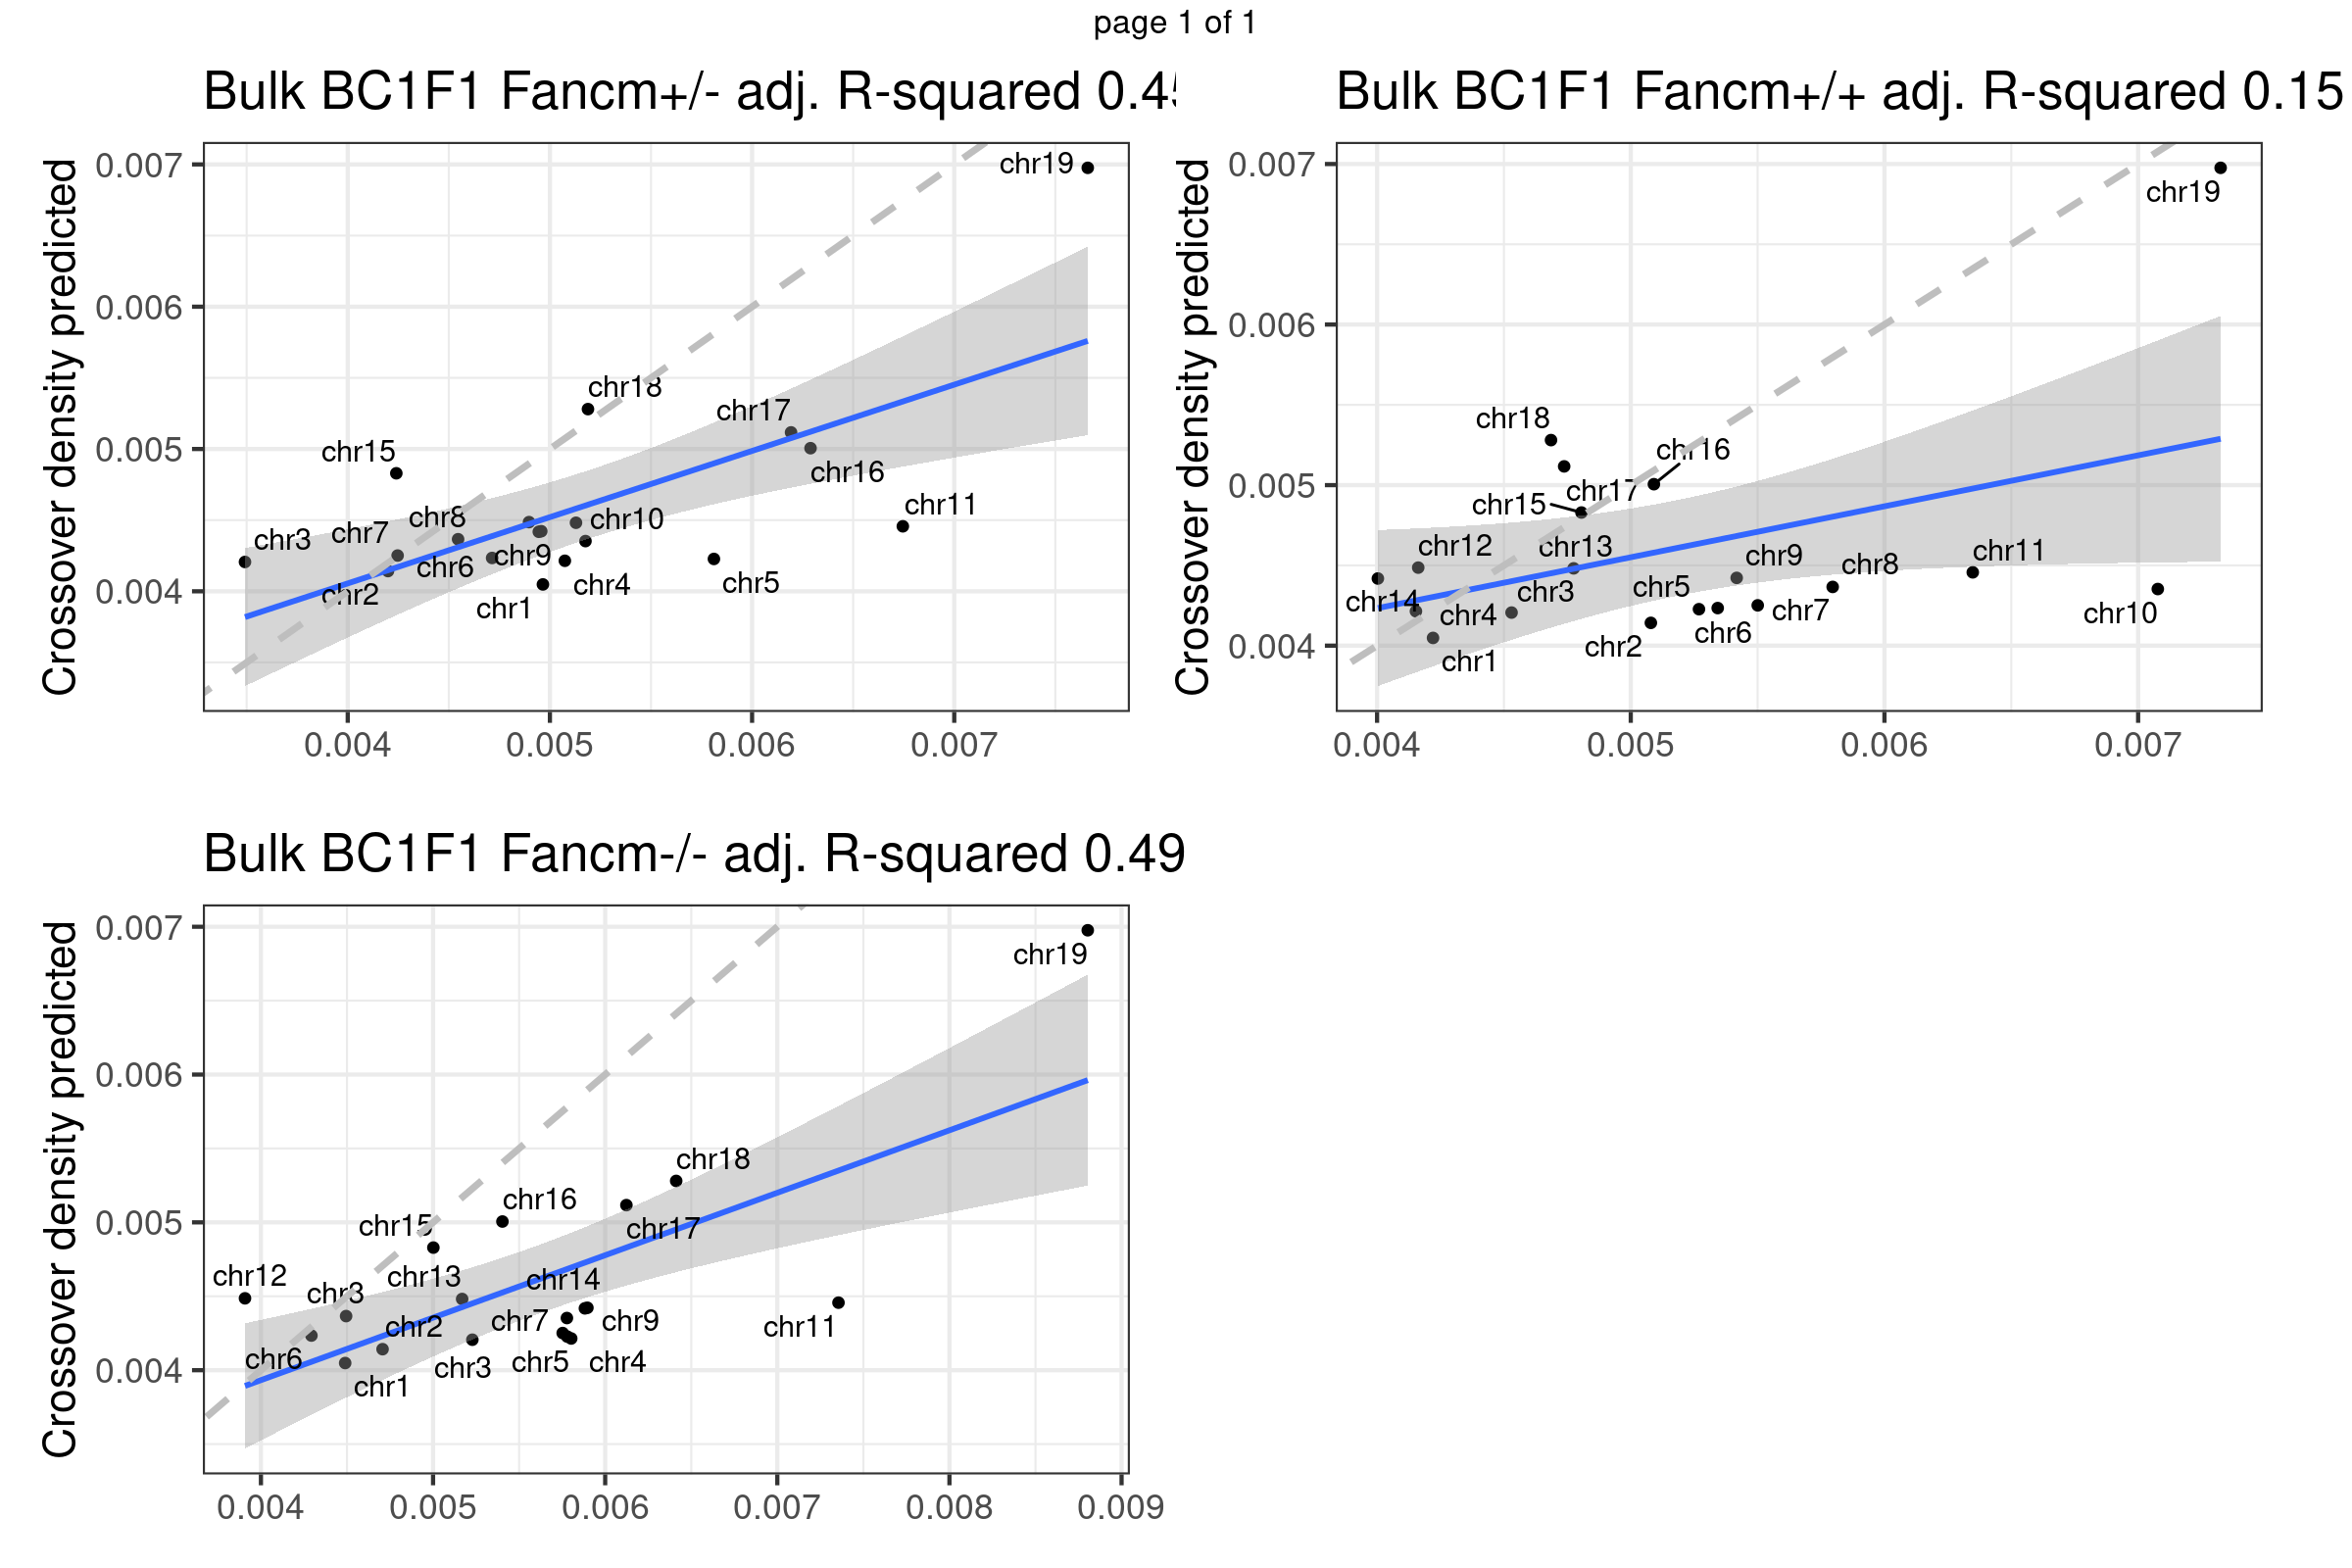
plots_compareTofittedscCNV <- list()
counter <- 1
for( sampleType in unique(totalCOScCNVCrossoverDensity$sampleGroup)){
 plot_df <- totalCOScCNVCrossoverDensity[totalCOScCNVCrossoverDensity$sampleGroup== sampleType,]
 plots_compareTofittedscCNV[[counter]] <- fitMD_perCellType(plot_df = plot_df,poly3=poly3_size)
 counter <- counter + 1

}
arg_mchrs <- arrangeGrob(plots_compareTofittedscCNV[[1]]+theme(axis.title.x = element_blank(),
plot.margin = margin(t=10,r=15,b = 15))+ylab(""),
plots_compareTofittedscCNV[[2]]+theme(axis.title.x = element_blank(),
plot.margin = margin(t=10,r=15,b = 15))+ylab(""),
layout_matrix = matrix(c(1,2,3,4),nrow = 2),
bc1f1_plist[[4]]+theme(axis.title.x = element_blank(),
plot.margin = margin(t=10,r=22,b = 15))+ylab(""),
bc1f1_plist[[5]]+theme(axis.title.x = element_blank(),
plot.margin = margin(t=10,r=22,b = 15))+ylab(""))
grid.arrange(arg_mchrs, bottom = textGrob("Crossover density observed",rot = 0,
gp = gpar(fontsize=18)),
left = textGrob("Crossover density predicted",rot = 90,
gp = gpar(fontsize=18)),
right = " ")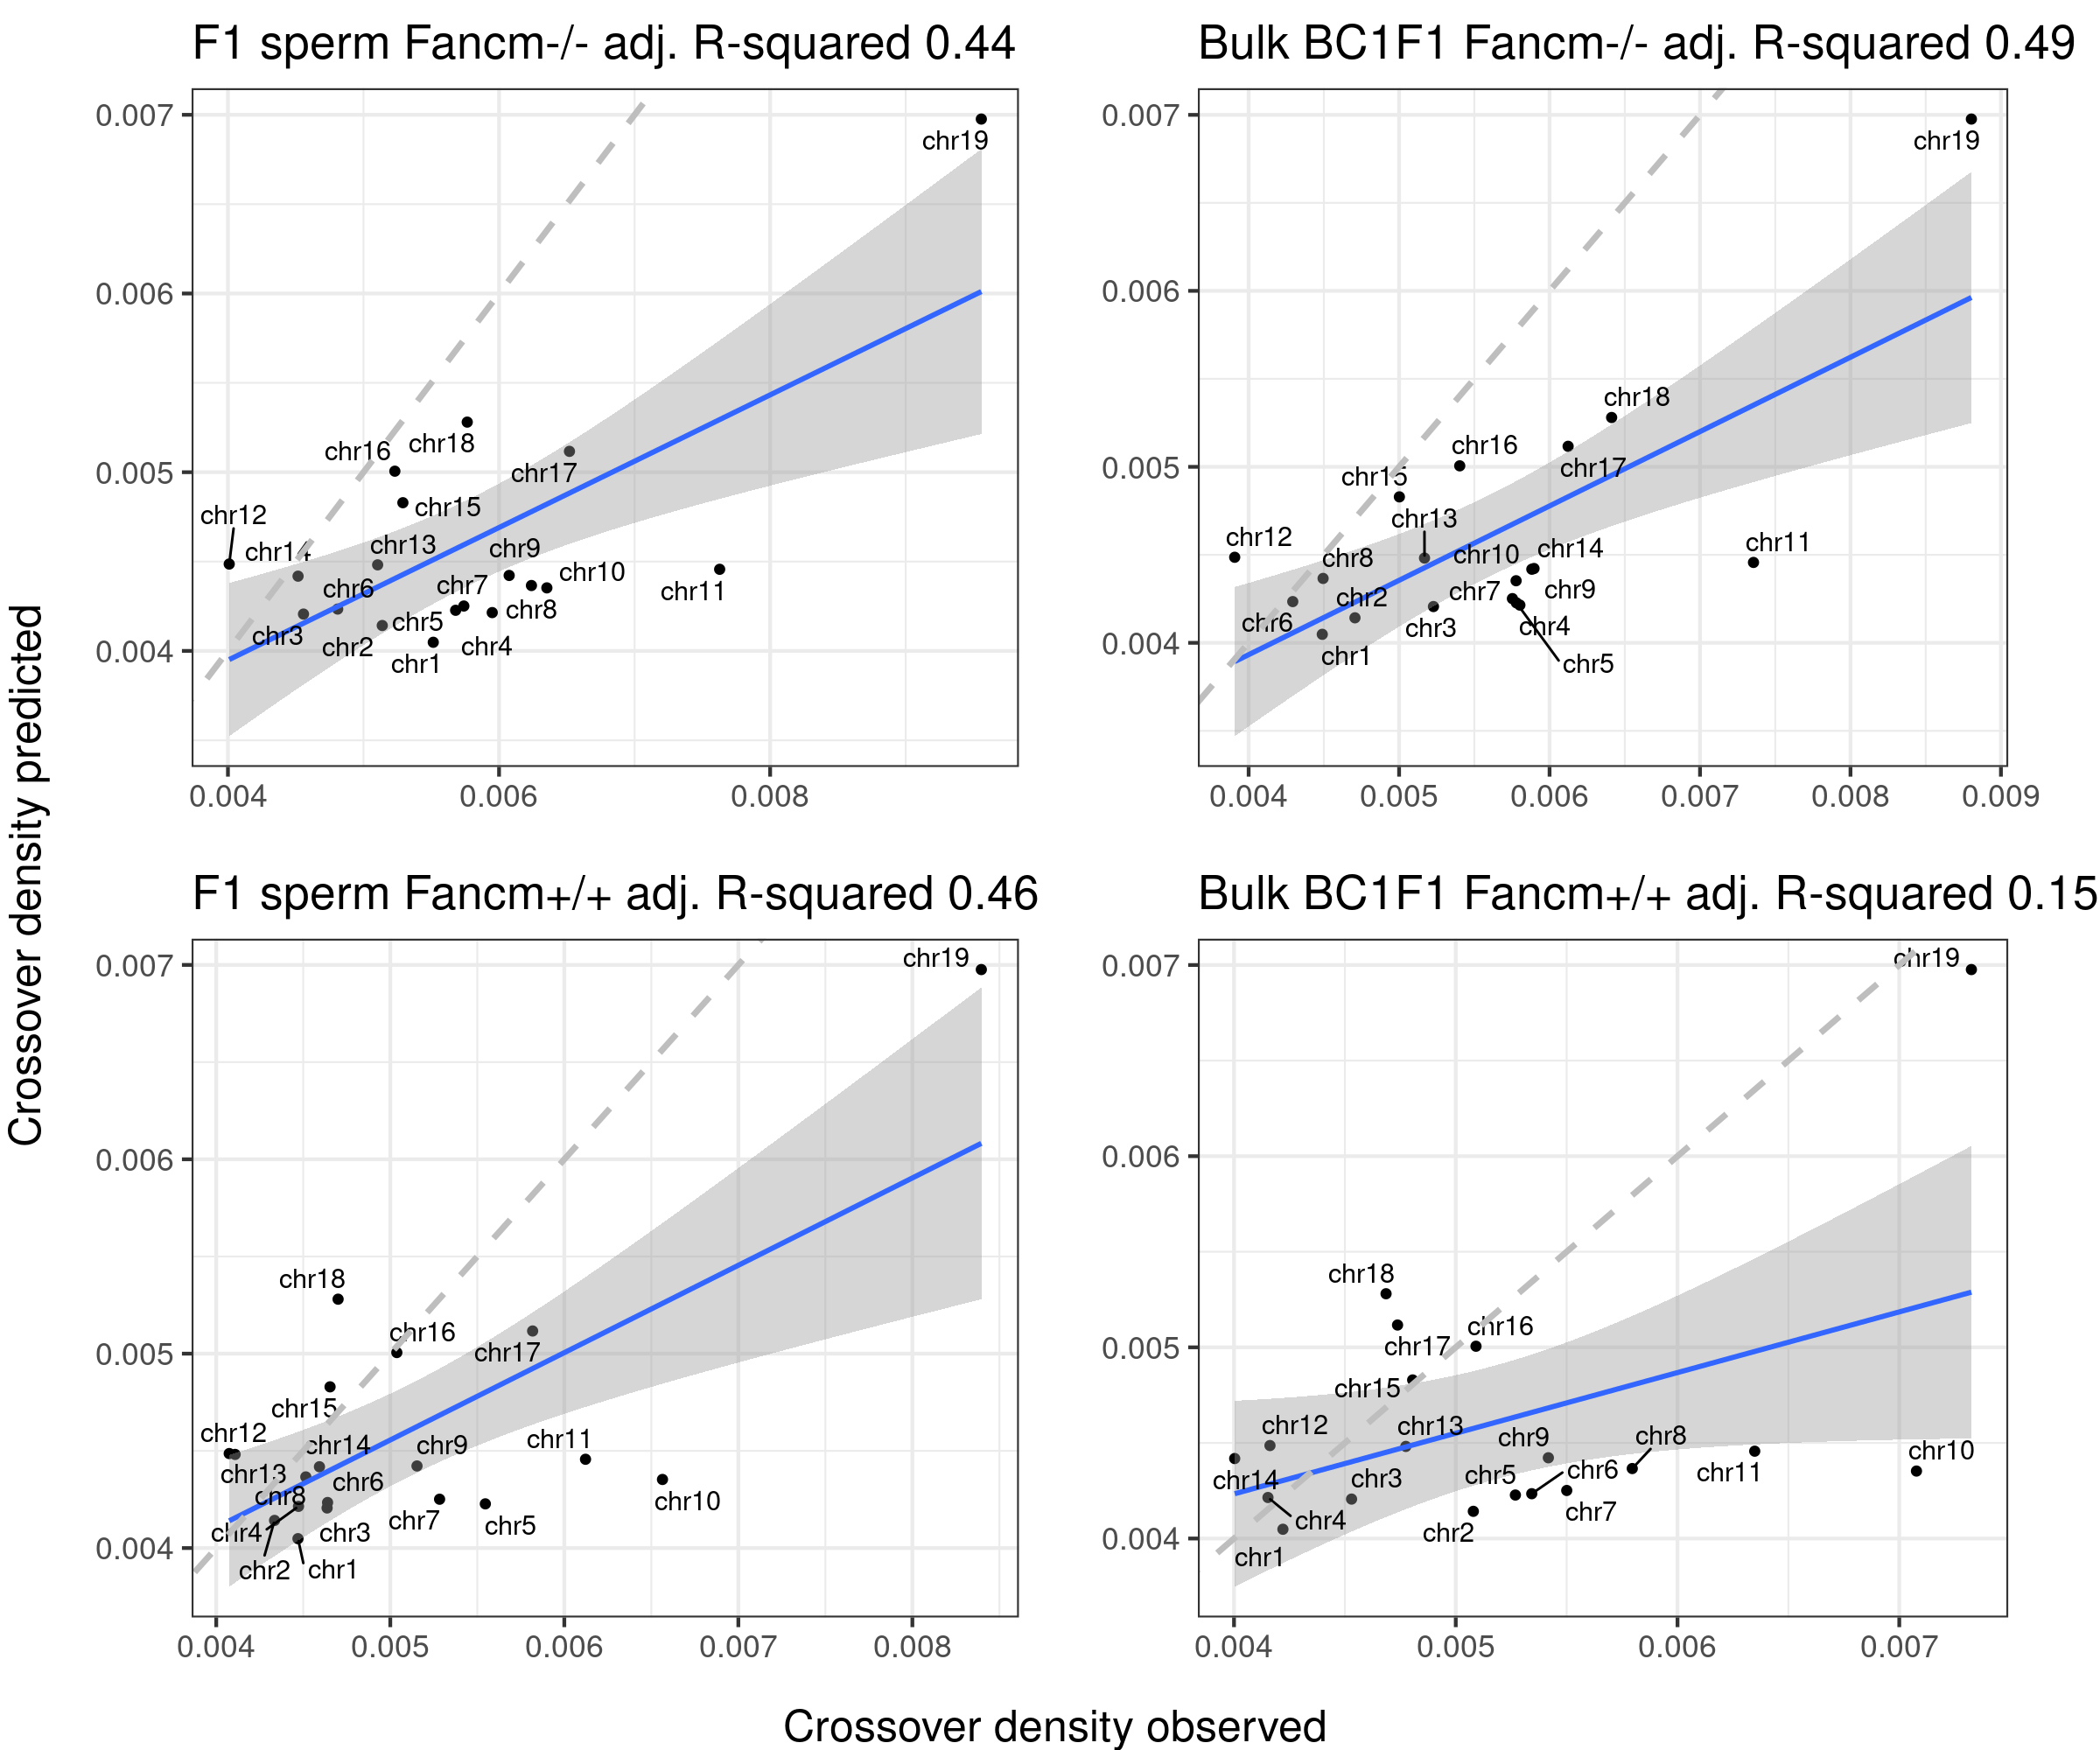
##n col col::marrangeGrob(bc1f1_plist,nrow = 2,ncol=2)Add replication speed as covariate
# mm5 <- read.table(file ="data/public_dataset/mmc5.1-3.108.txt",
#                   header =TRUE)
# head(mm5)
# chrom_origins <- mm5 %>% group_by(cs) %>% summarise(orgins_chr = sum(origins))
# chrom_origins


rep_speed <- read.table(file = "data/public_dataset/replication_speed_mouse_testis.txt",
                        header  =TRUE)
rep_speed <- rep_speed[grep("75",rep_speed$lbl),]
rep_speed <- rep_speed %>% group_by(cs) %>% summarise(mean_time = mean(time)) %>% mutate(cs = paste0("chr",cs))

b6_cast_1cCells <- b6_cast_1cCells %>% left_join(rep_speed,
                                                 by = c("CHROM" = "cs" ))

b6_cast_1cCells %>% ggplot() + geom_point(mapping = aes(x = mean_time, y = crossoverDensity))+
  theme_bw(base_size = 18)
Add DSBs as covariate
dsbs <- read.table(file = "data/public_dataset/forWayne/GSM1954839_B6fXCASTm_hotspots.tab.gz",col.names = c("cs","from","to","DSBs"))
dsbs  <-  dsbs %>% group_by(cs) %>% summarise(DSBs  = sum(DSBs))
b6_cast_1cCells <- b6_cast_1cCells %>% left_join(dsbs,
                                                 by = c("CHROM" = "cs" ))
b6_cast_1cCells$DSBs_perMb <- b6_cast_1cCells$DSBs/b6_cast_1cCells$size*1e6
Predict B6_CAST CO density using model poly3_size
b6_cast_1cCells %>% ggplot() + geom_point(mapping = aes(x = DSBs_perMb, y = crossoverDensity))+
  theme_bw(base_size = 18)
poly3_size <- lm(formula = crossoverDensity ~ poly(size, 3) ,b6_cast_1cCells)

plot_df <- b6_cast_1cCells

predictedDensity <- predict(poly3_size,plot_df)

p_o <- lm(formula = predictedDensity ~ plot_df[,"crossoverDensity",drop =TRUE])


p1 <- plot_df %>% mutate(densityPredict = predictedDensity) %>%
  ggplot()+geom_point(mapping = aes(x = crossoverDensity ,y = predictedDensity ))+theme_bw(base_size = 16)+
  geom_smooth(mapping = aes(y = predictedDensity , x = crossoverDensity),formula=y ~ x,method = "lm")+
   ggrepel::geom_text_repel(mapping = aes(x = crossoverDensity   , y = predictedDensity, label=CHROM ))+
  ylab("Crossover density predicted")+xlab("crossover density b6_cast observed ")+
  ggtitle(paste0("b6_cast size", " adj. R-squared ",
                 round(summary(p_o)$adj.r.squared,2)))+
  geom_abline(slope = 1,linetype  = 2,size = 1.2,color = "grey")

p1
Predict B6_CAST CO density using model lm_repSpeed
lm_repSpeed <- lm(formula = crossoverDensity ~ mean_time,b6_cast_1cCells)

summary(lm_repSpeed)
Call:
lm(formula = crossoverDensity ~ mean_time, data = b6_cast_1cCells)

Residuals:
       Min         1Q     Median         3Q        Max
-1.002e-03 -3.962e-04  2.300e-07  2.975e-04  1.544e-03

Coefficients:
              Estimate Std. Error t value Pr(>|t|)
(Intercept)  9.770e-03  1.332e-03   7.334 1.17e-06 ***
mean_time   -1.688e-05  4.330e-06  -3.899  0.00115 **
---
Signif. codes:  0 '***' 0.001 '**' 0.01 '*' 0.05 '.' 0.1 ' ' 1

Residual standard error: 0.0006273 on 17 degrees of freedom
Multiple R-squared:  0.4721,    Adjusted R-squared:  0.4411
F-statistic:  15.2 on 1 and 17 DF,  p-value: 0.001154
p <- ggplot(b6_cast_1cCells)+geom_point(mapping = aes(y = crossoverDensity , x = mean_time ))+theme_bw(base_size = 16)+
geom_smooth(mapping = aes(y = crossoverDensity , x = mean_time),
formula=y ~ x,
method = "lm")+
ggrepel::geom_text_repel(mapping = aes(y = crossoverDensity , x = mean_time,label=chrom ))
p + ggtitle(paste0( " b6_cast replication speed adj. R-squared ",
round(summary(lm_repSpeed)$adj.r.squared,2)))
predictedDensity <- predict(lm_repSpeed,plot_df)

p_o <- lm(formula = predictedDensity ~ plot_df[,"crossoverDensity",drop =TRUE])

p2 <- plot_df %>% mutate(densityPredict = predictedDensity) %>%
  ggplot()+geom_point(mapping = aes(x = crossoverDensity ,y = predictedDensity ))+theme_bw(base_size = 16)+
  geom_smooth(mapping = aes(y = predictedDensity , x = crossoverDensity),formula=y ~ x,method = "lm")+
   ggrepel::geom_text_repel(mapping = aes(x = crossoverDensity   , y = predictedDensity, label=CHROM ))+
  xlab("Crossover density b6_cast observed")+  ylab("Crossover density predicted")+
  ggtitle(paste0("b6_cast replication speed", " adj. R-squared ",
                 round(summary(p_o)$adj.r.squared,2)))+geom_abline(slope = 1,
                                                                   linetype  = 2,size = 1.2,color = "grey")

p2
Predict B6_CAST CO density using model lm_DSBs
lm_DSBs <- lm(formula = crossoverDensity ~ DSBs, b6_cast_1cCells)

summary(lm_DSBs)
Call:
lm(formula = crossoverDensity ~ DSBs, data = b6_cast_1cCells)

Residuals:
       Min         1Q     Median         3Q        Max
-1.324e-03 -3.696e-04 -7.860e-06  2.631e-04  1.338e-03

Coefficients:
              Estimate Std. Error t value Pr(>|t|)
(Intercept)  6.915e-03  7.531e-04   9.182 5.33e-08 ***
DSBs        -1.347e-07  4.297e-08  -3.135  0.00603 **
---
Signif. codes:  0 '***' 0.001 '**' 0.01 '*' 0.05 '.' 0.1 ' ' 1

Residual standard error: 0.0006873 on 17 degrees of freedom
Multiple R-squared:  0.3664,    Adjusted R-squared:  0.3291
F-statistic: 9.829 on 1 and 17 DF,  p-value: 0.006033
p <- ggplot(b6_cast_1cCells)+geom_point(mapping = aes(y = crossoverDensity , x = DSBs ))+theme_bw(base_size = 16)+
geom_smooth(mapping = aes(y = crossoverDensity , x = DSBs),
formula=y ~ x,
method = "lm")+
ggrepel::geom_text_repel(mapping = aes(y = crossoverDensity , x = DSBs,label=chrom ))
p + ggtitle(paste0( " b6_cast DSBs adj. R-squared ",
round(summary(lm_DSBs)$adj.r.squared,2)))
predictedDensity <- predict(lm_DSBs,plot_df)

p_o <- lm(formula = predictedDensity ~ plot_df[,"crossoverDensity",drop =TRUE])

p2.2 <- plot_df %>% mutate(densityPredict = predictedDensity) %>%
  ggplot()+geom_point(mapping = aes(x = crossoverDensity ,y = predictedDensity ))+theme_bw(base_size = 16)+
  geom_smooth(mapping = aes(y = predictedDensity , x = crossoverDensity),formula=y ~ x,method = "lm")+
   ggrepel::geom_text_repel(mapping = aes(x = crossoverDensity   , y = predictedDensity, label=CHROM ))+
  xlab("Crossover density b6_cast observed")+  ylab("Crossover density predicted")+
  ggtitle(paste0("b6_cast DSBs", " adj. R-squared ",
                 round(summary(p_o)$adj.r.squared,2)))+geom_abline(slope = 1,
                                                                   linetype  = 2,size = 1.2,color = "grey")

p2.2
Predict B6_CAST CO density using model poly3_size + repSpeed
poly3_size_repSpeed <- lm(formula = crossoverDensity ~ poly(size,3) + mean_time,
                         b6_cast_1cCells)
summary(poly3_size_repSpeed)
Call:
lm(formula = crossoverDensity ~ poly(size, 3) + mean_time, data = b6_cast_1cCells)

Residuals:
       Min         1Q     Median         3Q        Max
-6.091e-04 -1.229e-04 -8.470e-06  1.114e-04  5.262e-04

Coefficients:
                 Estimate Std. Error t value Pr(>|t|)
(Intercept)     8.753e-03  7.384e-04  11.855 1.09e-08 ***
poly(size, 3)1 -1.955e-03  3.254e-04  -6.010 3.20e-05 ***
poly(size, 3)2  1.292e-03  3.202e-04   4.036  0.00123 **
poly(size, 3)3  1.099e-04  3.393e-04   0.324  0.75088
mean_time      -1.356e-05  2.402e-06  -5.644 6.05e-05 ***
---
Signif. codes:  0 '***' 0.001 '**' 0.01 '*' 0.05 '.' 0.1 ' ' 1

Residual standard error: 0.0003181 on 14 degrees of freedom
Multiple R-squared:  0.8882,    Adjusted R-squared:  0.8563
F-statistic: 27.81 on 4 and 14 DF,  p-value: 1.575e-06
predictedDensity <- predict(poly3_size_repSpeed,plot_df)
p_o <- lm(formula = predictedDensity ~ plot_df[,"crossoverDensity",drop =TRUE])
p3 <- plot_df %>% mutate(densityPredict = predictedDensity) %>%
ggplot()+geom_point(mapping = aes(x = crossoverDensity ,y = predictedDensity ))+theme_bw(base_size = 16)+
geom_smooth(mapping = aes(y = predictedDensity , x = crossoverDensity),
formula=y ~ x,method = "lm")+
ggrepel::geom_text_repel(mapping = aes(x = crossoverDensity, y = predictedDensity, label=chrom ))+
xlab("Crossover density b6_cast observed")+ ylab("Crossover density predicted")+
ggtitle(paste0("size + rep speed", " adj. R-squared ",
round(summary(p_o)$adj.r.squared,2)))+
geom_abline(slope = 1,linetype = 2,size = 1.2,color = "grey")
p3
Predicted densities from using models fitted from public data (poly3(size)+repSpeed+DSBs) versus our observed crossover densities
lm_size_repSpeed_DSBs <- lm(formula = crossoverDensity ~ (poly(size,3)+mean_time+DSBs_perMb),
                         b6_cast_1cCells)
summary(lm_size_repSpeed_DSBs)
Call:
lm(formula = crossoverDensity ~ (poly(size, 3) + mean_time +
    DSBs_perMb), data = b6_cast_1cCells)

Residuals:
       Min         1Q     Median         3Q        Max
-3.085e-04 -1.368e-04 -2.810e-05  7.138e-05  5.114e-04

Coefficients:
                 Estimate Std. Error t value Pr(>|t|)
(Intercept)     7.570e-03  6.926e-04  10.930 6.35e-08 ***
poly(size, 3)1 -1.425e-03  3.068e-04  -4.645 0.000459 ***
poly(size, 3)2  1.372e-03  2.526e-04   5.432 0.000115 ***
poly(size, 3)3  2.791e-04  2.718e-04   1.027 0.323229
mean_time      -1.562e-05  1.998e-06  -7.818 2.87e-06 ***
DSBs_perMb      1.352e-05  4.334e-06   3.118 0.008151 **
---
Signif. codes:  0 '***' 0.001 '**' 0.01 '*' 0.05 '.' 0.1 ' ' 1

Residual standard error: 0.0002497 on 13 degrees of freedom
Multiple R-squared:  0.936, Adjusted R-squared:  0.9115
F-statistic: 38.06 on 5 and 13 DF,  p-value: 2.574e-07
predictedDensity <- predict(lm_size_repSpeed_DSBs,plot_df)
p_o <- lm(formula = predictedDensity ~ plot_df[,"crossoverDensity",drop =TRUE])
p4 <- plot_df %>% mutate(densityPredict = predictedDensity) %>%
ggplot()+geom_point(mapping = aes(x = crossoverDensity ,y = predictedDensity ))+theme_bw(base_size = 16)+
geom_smooth(mapping = aes(y = predictedDensity , x = crossoverDensity),
formula=y ~ x,method = "lm")+
ggrepel::geom_text_repel(mapping = aes(x = crossoverDensity, y = predictedDensity, label=chrom ))+
xlab("Crossover density b6_cast observed")+ ylab("Crossover density predicted")+
ggtitle(paste0("size + rep speed + DSBs", " adj. R-squared ",
round(summary(p_o)$adj.r.squared,2)))+
geom_abline(slope = 1,linetype = 2,size = 1.2,color = "grey")
p4
plots_compareTofitted_size <- list()
counter <- 1


for( sampleType in unique(totalCOBC1F1CrossoverDensity$sampleGroup)){
 plot_df <- totalCOBC1F1CrossoverDensity %>% filter(sampleGroup == sampleType) %>% left_join(rep_speed, by = c("chrom" = "cs" )) %>%
   left_join(dsbs, by = c("chrom" = "cs" )) %>% mutate(DSBs_perMb = DSBs/size*1e6)

 plots_compareTofitted_size[[counter]] <- fitMD_perSampleType(plot_df = plot_df,
                                                                      poly3=lm_size_repSpeed_DSBs)
 counter <- counter + 1

}

plots_compareTofittedscCNV_size <- list()
counter <- 1

for( sampleType in unique(totalCOScCNVCrossoverDensity$sampleGroup)){
 plot_df <- totalCOScCNVCrossoverDensity %>% filter(sampleGroup == sampleType) %>% left_join(rep_speed, by = c("chrom" = "cs" )) %>%
   left_join(dsbs, by = c("chrom" = "cs" )) %>% mutate(DSBs_perMb = DSBs/size*1e6)
 plots_compareTofittedscCNV_size[[counter]] <- fitMD_perCellType(plot_df = plot_df,poly3=lm_size_repSpeed_DSBs)
 counter <- counter + 1

}
arg_mchrs1 <- arrangeGrob(plots_compareTofitted_size[[1]]+theme(axis.title.x = element_blank(),
plot.margin = margin(t=10,r=15,b = 15))+ylab(""),
plots_compareTofitted_size[[2]]+theme(axis.title.x = element_blank(),
plot.margin = margin(t=10,r=15,b = 15))+ylab(""),
plots_compareTofitted_size[[6]]+theme(axis.title.x = element_blank(),
plot.margin = margin(t=10,r=22,b = 15))+ylab(""))
arg_mchrs2 <- arrangeGrob(plots_compareTofitted_size[[4]]+theme(axis.title.x = element_blank(),
plot.margin = margin(t=10,r=22,b = 15))+ylab(""),
plots_compareTofitted_size[[5]]+theme(axis.title.x = element_blank(),
plot.margin = margin(t=10,r=22,b = 15))+ylab(""),
plots_compareTofittedscCNV_size[[1]]+theme(axis.title.x = element_blank(),
plot.margin = margin(t=10,r=22,b = 15))+ylab(""),
plots_compareTofittedscCNV_size[[2]]+theme(axis.title.x = element_blank(),
plot.margin = margin(t=10,r=22,b = 15))+ylab("") )
plot1 <- grid.arrange(arg_mchrs2,bottom = textGrob("Crossover density observed",rot = 0,
gp = gpar(fontsize=18)), left = textGrob("Crossover density predicted",rot = 90,
gp = gpar(fontsize=18)),right = " ")
grid.arrange(arg_mchrs2,bottom =  textGrob("Crossover density observed",rot = 0,
                                gp = gpar(fontsize=18)), left =  textGrob("Crossover density predicted",rot = 90,
                                gp = gpar(fontsize=18)),right = " ")
ggsave("output/outputR/analysisRDS/figures/LM_fit-scCNV-bc1f1-rsqured.png",dpi = 300,
          height = 10, width = 12,units = "in",plot= plot1)

grid.arrange(arg_mchrs1,ncol=2,bottom =  textGrob("Crossover density observed",rot = 0,
                                gp = gpar(fontsize=18)), left =  textGrob("Crossover density predicted",rot = 90,
                                gp = gpar(fontsize=18)),right = " ")
Warning: ggrepel: 3 unlabeled data points (too many overlaps). Consider increasing max.overlaps
ggrepel: 3 unlabeled data points (too many overlaps). Consider increasing max.overlaps
arg_mchrs2 <- arrangeGrob(plots_compareTofitted_size[[4]]+theme(axis.title.x = element_blank(),
                                             plot.margin = margin(t=10,r=22,b = 15))+ylab("")+ggtitle(""),
                          plots_compareTofitted_size[[5]]+theme(axis.title.x = element_blank(),
                                             plot.margin = margin(t=10,r=22,b = 15))+ylab("")+ggtitle(""),
                          plots_compareTofittedscCNV_size[[1]]+theme(axis.title.x = element_blank(),
                                             plot.margin = margin(t=10,r=22,b = 15))+ylab("")+ggtitle(""),
                          plots_compareTofittedscCNV_size[[2]]+theme(axis.title.x = element_blank(),
                                             plot.margin = margin(t=10,r=22,b = 15))+ylab("")+ggtitle("") )
plot2 <- grid.arrange(arg_mchrs2,bottom =  textGrob("Crossover density observed",rot = 0,
                                gp = gpar(fontsize=18)), left =  textGrob("Crossover density predicted",rot = 90,
                                gp = gpar(fontsize=18)),right = " ")
grid.arrange(arg_mchrs2,bottom =  textGrob("Crossover density observed",rot = 0,
                                gp = gpar(fontsize=18)), left =  textGrob("Crossover density predicted",rot = 90,
                                gp = gpar(fontsize=18)),right = " ")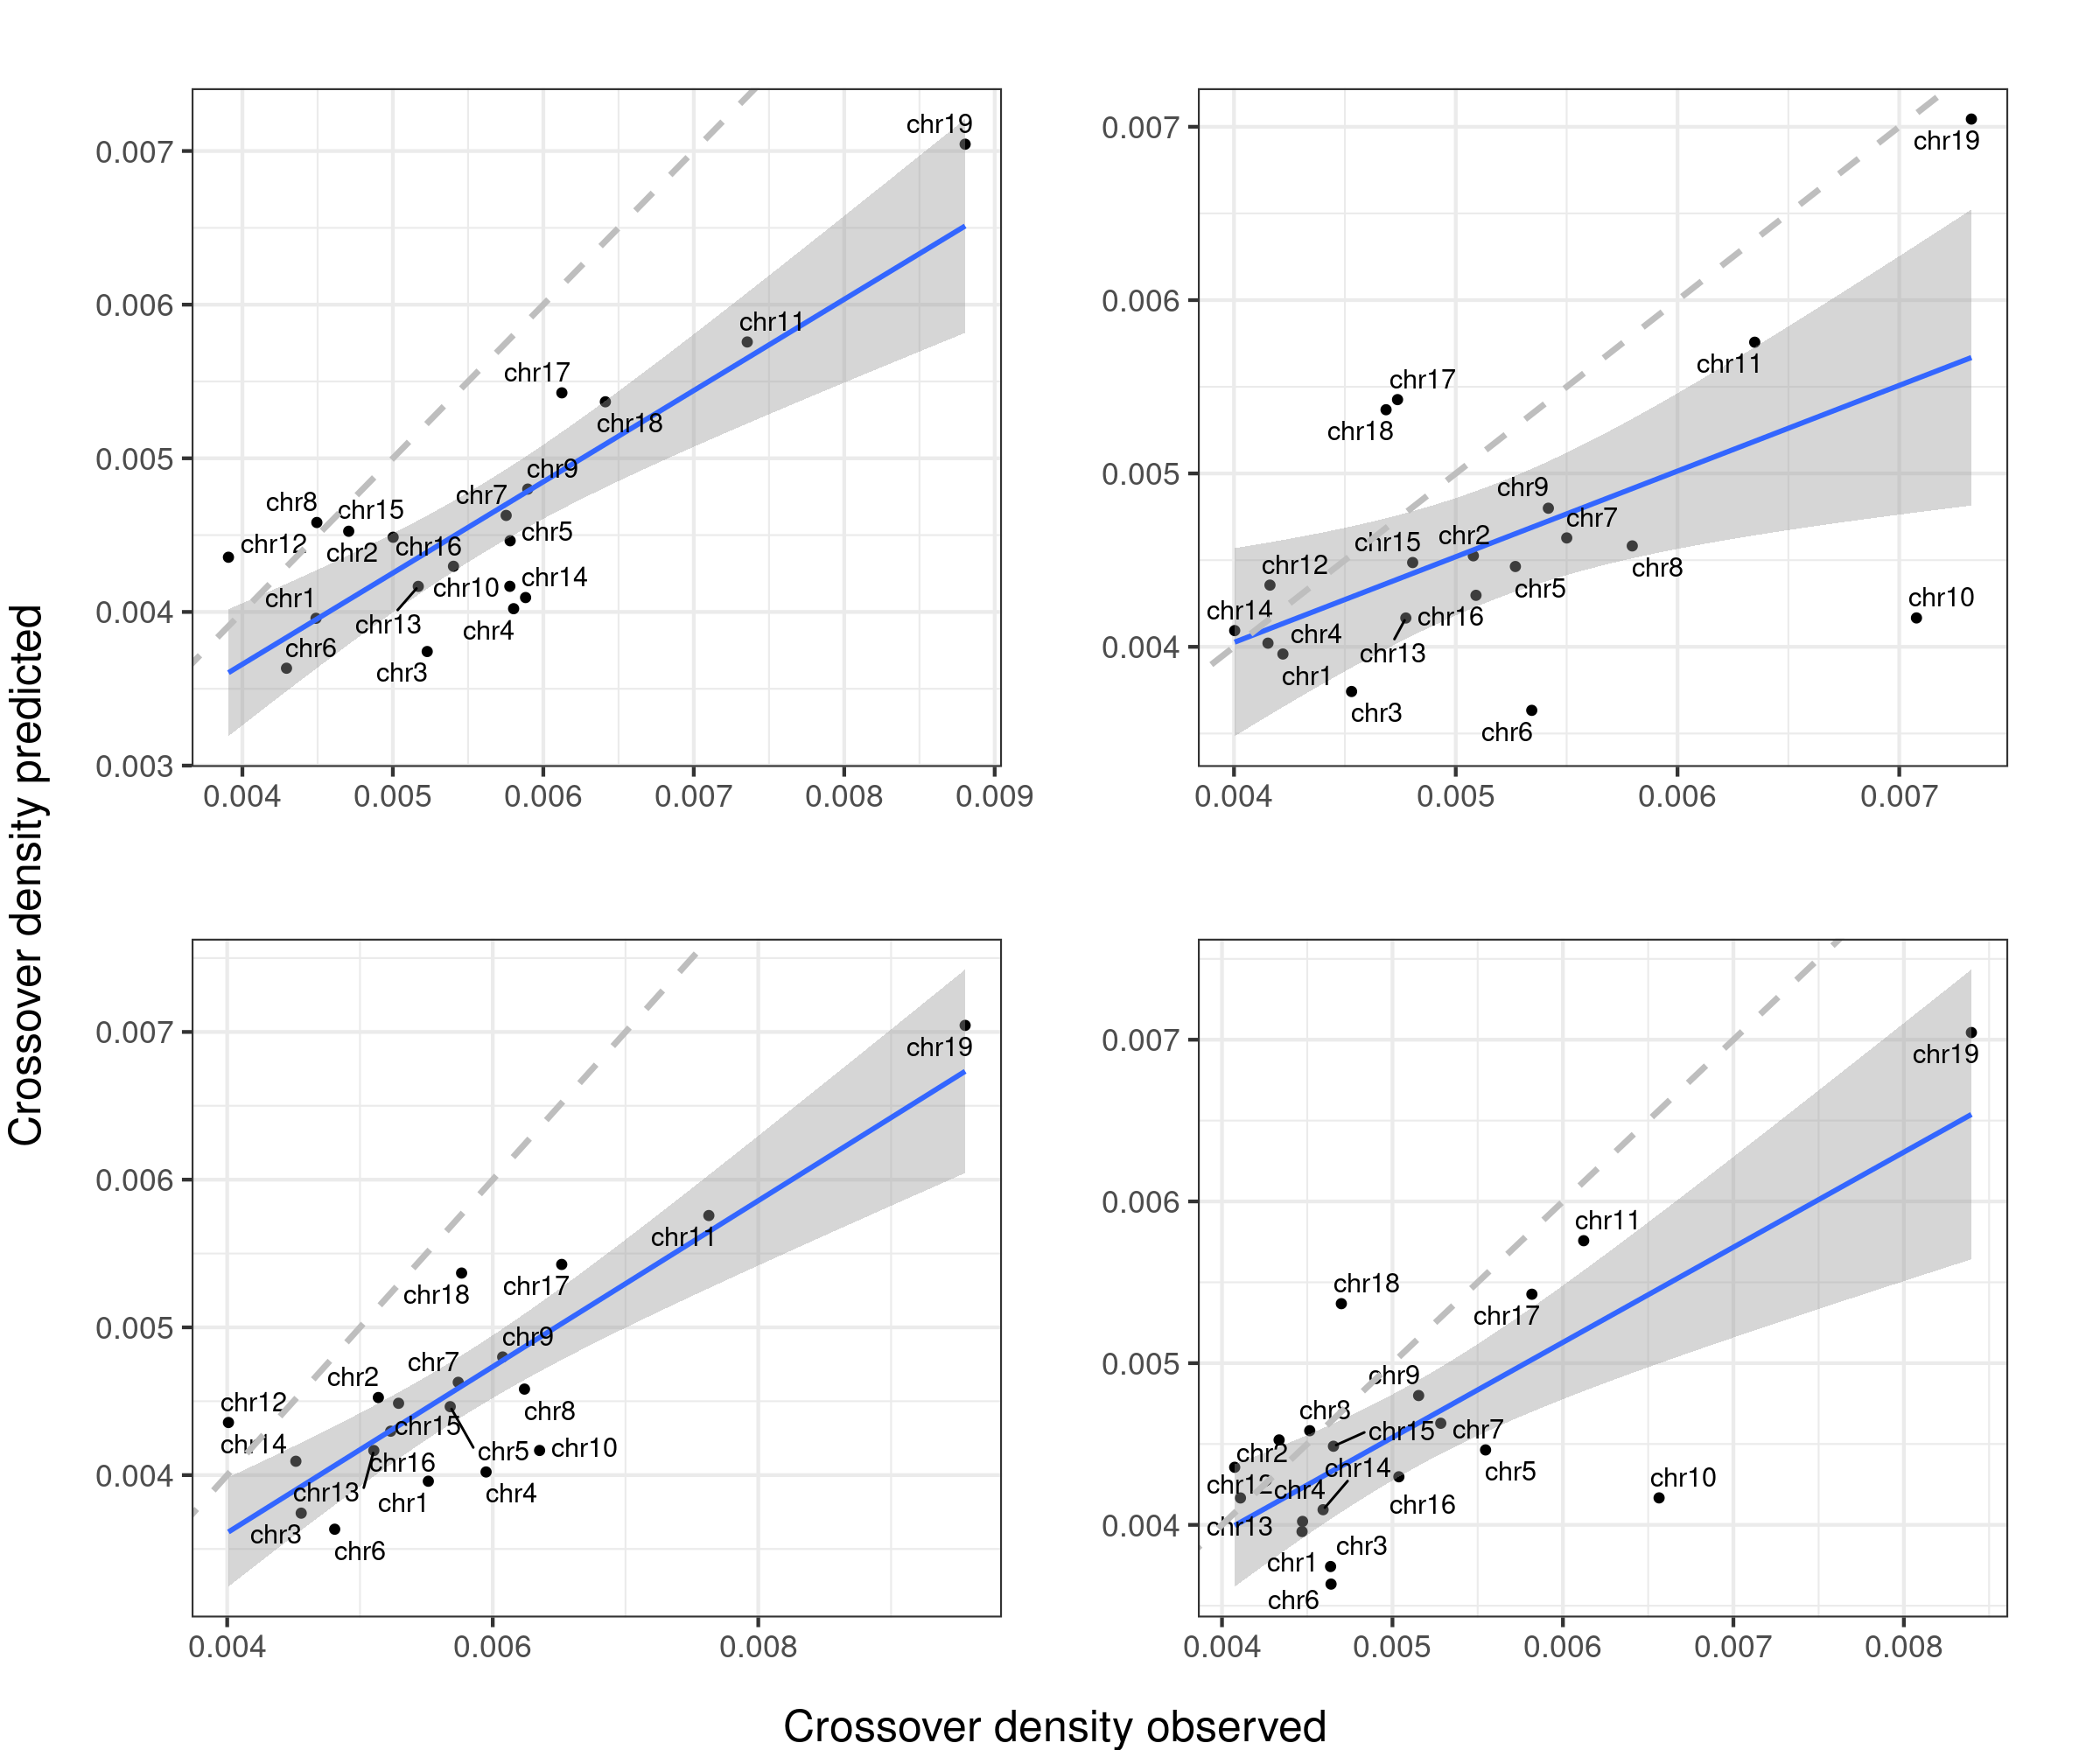
ggsave("output/outputR/analysisRDS/figures/LM_fit-scCNV-bc1f1-notext.png",dpi = 300,
          height = 10, width = 12,units = "in",plot = plot2)
Predicted densities from using models fitted from public data (size+ rep speed+DSBs) versus our observed crossover densities
plots_compareTofitted_size_origins <- list()
counter <- 1


for( sampleType in unique(totalCOBC1F1CrossoverDensity$sampleGroup)){
 plot_df <- totalCOBC1F1CrossoverDensity %>% filter(sampleGroup == sampleType) %>% left_join(rep_speed, by = c("chrom" = "cs" ))

 plots_compareTofitted_size_origins[[counter]] <- fitMD_perSampleType(plot_df= plot_df,
                                                                      poly3=poly3_size_repSpeed)
 counter <- counter + 1

}

plots_compareTofittedscCNV_size_origins <- list()
counter <- 1

for( sampleType in unique(totalCOScCNVCrossoverDensity$sampleGroup)){
 plot_df <- totalCOScCNVCrossoverDensity %>% filter(sampleGroup == sampleType) %>% left_join(rep_speed, by = c("chrom" = "cs" ))
 plots_compareTofittedscCNV_size_origins[[counter]] <- fitMD_perCellType(plot_df = plot_df,poly3=poly3_size_repSpeed)
 counter <- counter + 1

}
arg_mchrs1 <- arrangeGrob(plots_compareTofitted_size_origins[[1]]+theme(axis.title.x = element_blank(),
plot.margin = margin(t=10,r=15,b = 15))+ylab(""),
plots_compareTofitted_size_origins[[2]]+theme(axis.title.x = element_blank(),
plot.margin = margin(t=10,r=15,b = 15))+ylab(""),
plots_compareTofitted_size_origins[[6]]+theme(axis.title.x = element_blank(),
plot.margin = margin(t=10,r=22,b = 15))+ylab(""))
arg_mchrs2 <- arrangeGrob(plots_compareTofitted_size_origins[[4]]+theme(axis.title.x = element_blank(),
plot.margin = margin(t=10,r=22,b = 15))+ylab(""),
plots_compareTofitted_size_origins[[5]]+theme(axis.title.x = element_blank(),
plot.margin = margin(t=10,r=22,b = 15))+ylab(""),
plots_compareTofittedscCNV_size_origins[[1]]+theme(axis.title.x = element_blank(),
plot.margin = margin(t=10,r=22,b = 15))+ylab(""),
plots_compareTofittedscCNV_size_origins[[2]]+theme(axis.title.x = element_blank(),
plot.margin = margin(t=10,r=22,b = 15))+ylab("") )
grid.arrange(arg_mchrs2,bottom = textGrob("Crossover density observed",rot = 0,
gp = gpar(fontsize=18)), left = textGrob("Crossover density predicted",rot = 90,
gp = gpar(fontsize=18)), right = " ")
grid.arrange(arg_mchrs1,ncol=2,bottom =  textGrob("Crossover density observed",rot = 0,
                                gp = gpar(fontsize=18)), left =  textGrob("Crossover density predicted",rot = 90,
                                gp = gpar(fontsize=18)), right = " ")
Warning: ggrepel: 3 unlabeled data points (too many overlaps). Consider
increasing max.overlaps
Conclusion
The column 108 that is the density of replication origins does not improve the model fitting. Referring the main text of the study Pratto et al, a more complexed model was used to predict/simulate the replication speed per chromosome, which was not found as any columns in the DataS1 file.
Session info
sessionInfo()R version 4.1.2 (2021-11-01)
Platform: x86_64-pc-linux-gnu (64-bit)
Running under: Rocky Linux 8.5 (Green Obsidian)
Matrix products: default
BLAS/LAPACK: /usr/lib64/libopenblasp-r0.3.12.so
locale:
[1] LC_CTYPE=en_AU.UTF-8 LC_NUMERIC=C
[3] LC_TIME=en_AU.UTF-8 LC_COLLATE=en_AU.UTF-8
[5] LC_MONETARY=en_AU.UTF-8 LC_MESSAGES=en_AU.UTF-8
[7] LC_PAPER=en_AU.UTF-8 LC_NAME=C
[9] LC_ADDRESS=C LC_TELEPHONE=C
[11] LC_MEASUREMENT=en_AU.UTF-8 LC_IDENTIFICATION=C
attached base packages:
[1] stats4 grid stats graphics grDevices utils datasets
[8] methods base
other attached packages:
[1] readxl_1.3.1 tidyr_1.2.0
[3] SummarizedExperiment_1.24.0 Biobase_2.54.0
[5] GenomicRanges_1.46.1 MatrixGenerics_1.6.0
[7] matrixStats_0.61.0 GenomeInfoDb_1.30.1
[9] IRanges_2.28.0 S4Vectors_0.32.3
[11] BiocGenerics_0.40.0 gridExtra_2.3
[13] ggplot2_3.3.5 dplyr_1.0.7
[15] Matrix_1.4-0
loaded via a namespace (and not attached):
[1] ggrepel_0.9.1 Rcpp_1.0.8 lattice_0.20-45
[4] assertthat_0.2.1 rprojroot_2.0.2 digest_0.6.29
[7] utf8_1.2.2 cellranger_1.1.0 R6_2.5.1
[10] plyr_1.8.6 evaluate_0.14 highr_0.9
[13] pillar_1.6.5 zlibbioc_1.40.0 rlang_1.0.0
[16] rstudioapi_0.13 jquerylib_0.1.4 rmarkdown_2.11
[19] labeling_0.4.2 splines_4.1.2 stringr_1.4.0
[22] RCurl_1.98-1.5 munsell_0.5.0 DelayedArray_0.20.0
[25] compiler_4.1.2 httpuv_1.6.5 xfun_0.29
[28] pkgconfig_2.0.3 mgcv_1.8-38 htmltools_0.5.2
[31] tidyselect_1.1.1 tibble_3.1.6 GenomeInfoDbData_1.2.7
[34] workflowr_1.7.0 fansi_1.0.2 crayon_1.4.2
[37] withr_2.4.3 later_1.3.0 bitops_1.0-7
[40] nlme_3.1-153 gtable_0.3.0 lifecycle_1.0.1
[43] DBI_1.1.2 git2r_0.29.0 magrittr_2.0.2
[46] scales_1.1.1 cli_3.1.1 stringi_1.7.6
[49] farver_2.1.0 XVector_0.34.0 fs_1.5.2
[52] promises_1.2.0.1 ellipsis_0.3.2 generics_0.1.1
[55] vctrs_0.3.8 tools_4.1.2 glue_1.6.1
[58] purrr_0.3.4 fastmap_1.1.0 yaml_2.2.2
[61] colorspace_2.0-2 knitr_1.37
devtools::session_info()─ Session info ───────────────────────────────────────────────────────────────
setting value
version R version 4.1.2 (2021-11-01)
os Rocky Linux 8.5 (Green Obsidian)
system x86_64, linux-gnu
ui X11
language (EN)
collate en_AU.UTF-8
ctype en_AU.UTF-8
tz Australia/Melbourne
date 2022-03-22
pandoc 2.11.4 @ /usr/lib/rstudio-server/bin/pandoc/ (via rmarkdown)
─ Packages ───────────────────────────────────────────────────────────────────
package * version date (UTC) lib source
assertthat 0.2.1 2019-03-21 [1] CRAN (R 4.1.2)
Biobase * 2.54.0 2021-10-26 [1] Bioconductor
BiocGenerics * 0.40.0 2021-10-26 [1] Bioconductor
bitops 1.0-7 2021-04-24 [1] CRAN (R 4.1.2)
brio 1.1.3 2021-11-30 [1] CRAN (R 4.1.0)
cachem 1.0.6 2021-08-19 [1] CRAN (R 4.1.0)
callr 3.7.0 2021-04-20 [1] CRAN (R 4.1.2)
cellranger 1.1.0 2016-07-27 [1] CRAN (R 4.1.2)
cli 3.1.1 2022-01-20 [1] CRAN (R 4.1.2)
colorspace 2.0-2 2021-06-24 [1] CRAN (R 4.1.2)
crayon 1.4.2 2021-10-29 [1] CRAN (R 4.1.2)
DBI 1.1.2 2021-12-20 [1] CRAN (R 4.1.2)
DelayedArray 0.20.0 2021-10-26 [1] Bioconductor
desc 1.4.0 2021-09-28 [1] CRAN (R 4.1.0)
devtools 2.4.3 2021-11-30 [1] CRAN (R 4.1.0)
digest 0.6.29 2021-12-01 [1] CRAN (R 4.1.2)
dplyr * 1.0.7 2021-06-18 [1] CRAN (R 4.1.2)
ellipsis 0.3.2 2021-04-29 [1] CRAN (R 4.1.2)
evaluate 0.14 2019-05-28 [1] CRAN (R 4.1.2)
fansi 1.0.2 2022-01-14 [1] CRAN (R 4.1.2)
farver 2.1.0 2021-02-28 [1] CRAN (R 4.1.2)
fastmap 1.1.0 2021-01-25 [1] CRAN (R 4.1.2)
fs 1.5.2 2021-12-08 [1] CRAN (R 4.1.2)
generics 0.1.1 2021-10-25 [1] CRAN (R 4.1.2)
GenomeInfoDb * 1.30.1 2022-01-30 [1] Bioconductor
GenomeInfoDbData 1.2.7 2022-01-28 [1] Bioconductor
GenomicRanges * 1.46.1 2021-11-18 [1] Bioconductor
ggplot2 * 3.3.5 2021-06-25 [1] CRAN (R 4.1.2)
ggrepel 0.9.1 2021-01-15 [1] CRAN (R 4.1.2)
git2r 0.29.0 2021-11-22 [1] CRAN (R 4.1.2)
glue 1.6.1 2022-01-22 [1] CRAN (R 4.1.2)
gridExtra * 2.3 2017-09-09 [1] CRAN (R 4.1.0)
gtable 0.3.0 2019-03-25 [1] CRAN (R 4.1.2)
highr 0.9 2021-04-16 [1] CRAN (R 4.1.2)
htmltools 0.5.2 2021-08-25 [1] CRAN (R 4.1.2)
httpuv 1.6.5 2022-01-05 [1] CRAN (R 4.1.2)
IRanges * 2.28.0 2021-10-26 [1] Bioconductor
jquerylib 0.1.4 2021-04-26 [1] CRAN (R 4.1.2)
knitr 1.37 2021-12-16 [1] CRAN (R 4.1.0)
labeling 0.4.2 2020-10-20 [1] CRAN (R 4.1.2)
later 1.3.0 2021-08-18 [1] CRAN (R 4.1.0)
lattice 0.20-45 2021-09-22 [2] CRAN (R 4.1.2)
lifecycle 1.0.1 2021-09-24 [1] CRAN (R 4.1.2)
magrittr 2.0.2 2022-01-26 [1] CRAN (R 4.1.2)
Matrix * 1.4-0 2021-12-08 [1] CRAN (R 4.1.2)
MatrixGenerics * 1.6.0 2021-10-26 [1] Bioconductor
matrixStats * 0.61.0 2021-09-17 [1] CRAN (R 4.1.2)
memoise 2.0.1 2021-11-26 [1] CRAN (R 4.1.0)
mgcv 1.8-38 2021-10-06 [2] CRAN (R 4.1.2)
munsell 0.5.0 2018-06-12 [1] CRAN (R 4.1.2)
nlme 3.1-153 2021-09-07 [2] CRAN (R 4.1.2)
pillar 1.6.5 2022-01-25 [1] CRAN (R 4.1.2)
pkgbuild 1.3.1 2021-12-20 [1] CRAN (R 4.1.0)
pkgconfig 2.0.3 2019-09-22 [1] CRAN (R 4.1.2)
pkgload 1.2.4 2021-11-30 [1] CRAN (R 4.1.0)
plyr 1.8.6 2020-03-03 [1] CRAN (R 4.1.0)
prettyunits 1.1.1 2020-01-24 [1] CRAN (R 4.1.2)
processx 3.5.2 2021-04-30 [1] CRAN (R 4.1.2)
promises 1.2.0.1 2021-02-11 [1] CRAN (R 4.1.0)
ps 1.6.0 2021-02-28 [1] CRAN (R 4.1.2)
purrr 0.3.4 2020-04-17 [1] CRAN (R 4.1.2)
R6 2.5.1 2021-08-19 [1] CRAN (R 4.1.2)
Rcpp 1.0.8 2022-01-13 [1] CRAN (R 4.1.2)
RCurl 1.98-1.5 2021-09-17 [1] CRAN (R 4.1.0)
readxl * 1.3.1 2019-03-13 [1] CRAN (R 4.1.2)
remotes 2.4.2 2021-11-30 [1] CRAN (R 4.1.0)
rlang 1.0.0 2022-01-26 [1] CRAN (R 4.1.2)
rmarkdown 2.11 2021-09-14 [1] CRAN (R 4.1.2)
rprojroot 2.0.2 2020-11-15 [1] CRAN (R 4.1.0)
rstudioapi 0.13 2020-11-12 [1] CRAN (R 4.1.2)
S4Vectors * 0.32.3 2021-11-21 [1] Bioconductor
scales 1.1.1 2020-05-11 [1] CRAN (R 4.1.2)
sessioninfo 1.2.2 2021-12-06 [1] CRAN (R 4.1.0)
stringi 1.7.6 2021-11-29 [1] CRAN (R 4.1.0)
stringr 1.4.0 2019-02-10 [1] CRAN (R 4.1.0)
SummarizedExperiment * 1.24.0 2021-10-26 [1] Bioconductor
testthat 3.1.2 2022-01-20 [1] CRAN (R 4.1.0)
tibble 3.1.6 2021-11-07 [1] CRAN (R 4.1.2)
tidyr * 1.2.0 2022-02-01 [1] CRAN (R 4.1.0)
tidyselect 1.1.1 2021-04-30 [1] CRAN (R 4.1.2)
usethis 2.1.5 2021-12-09 [1] CRAN (R 4.1.0)
utf8 1.2.2 2021-07-24 [1] CRAN (R 4.1.2)
vctrs 0.3.8 2021-04-29 [1] CRAN (R 4.1.2)
withr 2.4.3 2021-11-30 [1] CRAN (R 4.1.2)
workflowr 1.7.0 2021-12-21 [1] CRAN (R 4.1.2)
xfun 0.29 2021-12-14 [1] CRAN (R 4.1.2)
XVector 0.34.0 2021-10-26 [1] Bioconductor
yaml 2.2.2 2022-01-25 [1] CRAN (R 4.1.2)
zlibbioc 1.40.0 2021-10-26 [1] Bioconductor
[1] /mnt/beegfs/mccarthy/backed_up/general/rlyu/Software/Rlibs/4.1
[2] /opt/R/4.1.2/lib/R/library
──────────────────────────────────────────────────────────────────────────────