2022-Mar-14_Fancm-ms-Overview-sample-counts-four-datasets
Ruqian Lyu
3/14/2022
Last updated: 2022-03-14
Checks: 5 1
Knit directory: yeln_2019_spermtyping/
This reproducible R Markdown analysis was created with workflowr (version 1.7.0). The Checks tab describes the reproducibility checks that were applied when the results were created. The Past versions tab lists the development history.
Great job! The global environment was empty. Objects defined in the global environment can affect the analysis in your R Markdown file in unknown ways. For reproduciblity it’s best to always run the code in an empty environment.
The command set.seed(20190102) was run prior to running the code in the R Markdown file. Setting a seed ensures that any results that rely on randomness, e.g. subsampling or permutations, are reproducible.
Great job! Recording the operating system, R version, and package versions is critical for reproducibility.
Nice! There were no cached chunks for this analysis, so you can be confident that you successfully produced the results during this run.
Great job! Using relative paths to the files within your workflowr project makes it easier to run your code on other machines.
Tracking code development and connecting the code version to the results is critical for reproducibility. To start using Git, open the Terminal and type git init in your project directory.
This project is not being versioned with Git. To obtain the full reproducibility benefits of using workflowr, please see ?wflow_start.
An updated summary analysis over four datasets.
Old version from ‘analysis/20212021-07-23_FANCM-manuscript-figures.Rmd’
Figure 1
AGRF dataset
A quick revisit
Load genotype results
all_pcr <- list()
plots_data <- data.frame(counts=0,type="b",group="y")
all_pcr_rse <- list()
for(sheets in c("mutant_25-6-19_informative","mutant_30-08-2019_informative","wildtype_2-5-19_informative","wt_30-08-2019_informative"))
{
  pcr_result_mutant_June <- readxl::read_excel(path = "data/All_data_May_to_August_2019.xlsx",
                           sheet = sheets)
  pcr_result_mutant_June_gr <- GRanges(seqnames = pcr_result_mutant_June$CHR,
                                       ranges = IRanges(start = pcr_result_mutant_June$POS, width = 1))

  mcols(pcr_result_mutant_June_gr) <- pcr_result_mutant_June[,6:ncol(pcr_result_mutant_June)]

  corrected_geno_mutant_June <- correctGT(gt_matrix = mcols(pcr_result_mutant_June_gr),
                              ref = pcr_result_mutant_June$`C57BL/6J`,
                              alt = pcr_result_mutant_June$`FVB/NJ [i]`,
                              fail = "Fail",
                              wrong_label = "Homo_ref")


  mcols(pcr_result_mutant_June_gr) <- corrected_geno_mutant_June
  all_pcr <- c(all_pcr,pcr_result_mutant_June_gr)

  genotype_counts <- countGT(mcols(pcr_result_mutant_June_gr))
  tmp <- genotype_counts$plot$data
  tmp$group <- sheets
  plots_data <- rbind(plots_data,tmp)
  rse <- SummarizedExperiment(assay = mcols(pcr_result_mutant_June_gr),
                                    colData = data.frame(sampleName=colnames(mcols(pcr_result_mutant_June_gr)),
                                                         group = sheets),
                                    rowRanges = GRanges(pcr_result_mutant_June_gr))
  all_pcr_rse <- c(all_pcr_rse,rse)
}
plots_data <- plots_data[2:nrow(plots_data),]
ggplot(plots_data)+geom_boxplot(mapping = aes(x = type, y =counts))+facet_wrap(.~type+group,
scales = "free")+
theme_bw()
Not all markers have calls across all samples. There are a couple samples that have slightly fewer sample coverage, we don’t filter them out now.
Construct the merged RangedSummarizedExperiment
To align with the Viterbi states in scCNV and BC1F1 samples, we convert the “Home_alt” to state 1 and Het to state2
all_pcr_rse_vi <- list()
for (rse in all_pcr_rse){
  tmp <- apply(assay(rse),2,function(x){ifelse(x =="Homo_alt",1,2)})
  tmp <- as.matrix(tmp)
  tmp[is.na(tmp)] <- 0
  assays(rse) <- list("vi_state" = tmp)
  all_pcr_rse_vi <- c(all_pcr_rse_vi,rse)
}
combine1 <- comapr::combineHapState(all_pcr_rse_vi[[1]],all_pcr_rse_vi[[2]])
combine2 <- comapr::combineHapState(all_pcr_rse_vi[[3]],all_pcr_rse_vi[[4]])
all_rse_pcr <- combineHapState(combine1,combine2)
all_rse_pcrclass: RangedSummarizedExperiment
dim: 271 58
metadata(0):
assays(1): vi_state
rownames: NULL
rowData names(58): X92 X93 ... X163 X164
colnames(58): 92 93 ... 163 164
colData names(2): sampleName groupCount crossovers
all_rse_pcr$barcodes <-  all_rse_pcr$sampleName
all_rse_pcr_cos <-  countCOs(all_rse_pcr)
#options(digits=2)
plotCount(all_rse_pcr_cos,by_chr = T,plot_type = "hist")+theme_bw()`stat_bin()` using `bins = 30`. Pick better value with `binwidth`.
plotCount(all_rse_pcr_cos,by_chr = T,group_by = "group")+theme_bw()
Chromosome 11 is weird.
all_rse_pcr_cos_chr11 <- all_rse_pcr_cos[seqnames(all_rse_pcr_cos)=="11",]

colSums(as.matrix(assay(all_rse_pcr_cos_chr11)))
92 93 94 95 96 97 98 99 100 101 102 103 104 105 106 107 108 109 110 111
3 1 0 0 0 2 3 3 2 3 1 3 1 1 0 0 4 2 2 3
112 113 206 208 209 210 211 212 214 215 216 217 222 56 57 58 59 60 61 62
1 1 1 3 1 2 5 1 1 0 0 0 1 0 1 0 0 0 3 2
63 64 65 76 77 78 79 80 152 153 154 155 156 160 161 162 163 164
0 0 1 1 0 0 0 2 0 1 1 2 1 1 1 0 2 0 Perhaps we should exclude sample 108 and sample 211
all_rse_pcr <- all_rse_pcr[,!all_rse_pcr$sampleName %in% c("108","211")]
all_rse_pcr_cos <-  countCOs(all_rse_pcr)
plotCount(all_rse_pcr_cos,by_chr = T,plot_type = "hist")+theme_bw()
`stat_bin()` using `bins = 30`. Pick better value with `binwidth`.
plotCount(all_rse_pcr_cos,by_chr = T,group_by = "group")+theme_bw()
all_rse_pcr_cos$sampleType <- plyr::mapvalues(all_rse_pcr_cos$group,
                                              from = c( "mutant_25-6-19_informative",
                                                        "mutant_30-08-2019_informative",
                                                        "wildtype_2-5-19_informative",
                                                        "wt_30-08-2019_informative"),
to = c("Fancm-/-","Fancm-/-","Fancm+/+","Fancm+/+"))plotCount(all_rse_pcr_cos,by_chr = T,group_by = "sampleType")+theme_bw(base_size = 18)+guides(color="none")
plotCount(all_rse_pcr_cos,by_chr = F,group_by = "sampleType")+
  theme_bw(base_size = 18)+guides(color="none")+
  scale_color_manual(values = c("Fancm-/-" = "cornflowerblue",
                                "Fancm+/+" = "tan1"))
Scale for 'colour' is already present. Adding another scale for 'colour',
which will replace the existing scale.
AGRF PCR Genetic Map
## figure saving function

savePNG <- function(plot_p, saveToFile, dpi=300, fig.width = 14,
                    fig.height =10,
                    bothPngPDF= FALSE){
    png(saveToFile, width = fig.width,
          height = fig.height, units = "in",
          pointsize = 12, res = dpi)
      print(plot_p)
      dev.off()


}
#all_rse_pcr_map <- calGeneticDist(all_rse_pcr_cos,group_by = "sampleType")
#saveRDS(all_rse_pcr_map, file ="output/outputR/analysisRDS/all_rse_pcr_map.rds")
all_rse_pcr_map <- readRDS(file ="output/outputR/analysisRDS/all_rse_pcr_map.rds")colSums(rowData(all_rse_pcr_map)$kosambi)Fancm-/- Fancm+/+
1304.705 1030.478 map_gr <- rowRanges(all_rse_pcr_map)
mcols(map_gr) <- rowData(all_rse_pcr_map)$kosambi
#plotGeneticDist(map_gr,chr = "1")plotWholeGenomeCustmise <- function (gr)
{
end <- chr_len <- tot <- all_of <- x_tick <- bin_dist <- SampleGroup <- NULL
BPcum <- NULL
GenomicRanges::mcols(gr) <- apply(mcols(gr), 2, function(x) {
temp_df <- data.frame(x = x) %>% dplyr::mutate(cum = cumsum(x))
temp_df$cum
})
gr_df <- data.frame(gr, check.names = FALSE)
col_to_plot <- gsub("\\|", ".", colnames(GenomicRanges::mcols(gr)))
don <- gr_df %>% dplyr::group_by(seqnames) %>% dplyr::summarise(chr_len = max(end)) %>%
dplyr::mutate(tot = cumsum(as.numeric(chr_len)) - chr_len) %>%
dplyr::select(-chr_len) %>% dplyr::left_join(gr_df,
., by = c(seqnames = "seqnames")) %>% dplyr::mutate(BPcum = end +
tot, x_tick = (0.5 * (start + end) + tot))
plot_df <- don %>% tidyr::pivot_longer(cols = all_of(col_to_plot),
names_to = "SampleGroup", values_to = "bin_dist") %>%
mutate(SampleGroup = factor(SampleGroup, levels = c("Male_WT","Male_HET","Male_KO",
"Female_WT","Female_HET","Female_KO",
"mutant","wildtype",
"WC_522", "WC_526",
"WC_CNV_43","WC_CNV_42",
"WC_CNV_44","WC_CNV_53")))
p <- plot_df %>% ggplot() + geom_step(mapping = aes(x = x_tick,
y = bin_dist, color = SampleGroup), size = 3)
axisdf <- don %>% dplyr::group_by(seqnames) %>%
dplyr::summarize(center = (max(BPcum) + min(BPcum))/2,
end_chr = max(BPcum))
axisdf$bg_color <- factor(ifelse(seq(19) %% 2 == 0, 1, 0))
p <- p +scale_x_continuous(labels = axisdf$seqnames, breaks = axisdf$center,
expand = c(0,0))+
geom_rect(data = axisdf, aes(xmax = end_chr, xmin = c(0,axisdf$end_chr[-nrow(axisdf)]),
ymin = 0, ymax = Inf,
fill = bg_color), alpha = 0.2)+
xlab("Chromosome positions \n cumulative whole genome")+
ylab("Cumulative centiMorgans")+scale_fill_manual(values = c("ivory","pink"))
p+scale_y_continuous(expand = c(0, 0),breaks = c(0,250,500,750,1000,1250,1500),
limits = c(0,1500))+
theme(axis.text = element_text(size = 22),
strip.text = element_blank(),
panel.grid.minor.x = element_blank(),
panel.grid.major = element_blank(),
panel.grid.major.x = element_blank())
}colnames(mcols(map_gr)) <- c("mutant","wildtype")
p <- plotWholeGenomeCustmise(map_gr)+theme_bw(base_size = 18)+
scale_color_manual(labels = c("mutant"= "Fancm-/-", "wildtype"="Fancm+/+"),
values = c("mutant" = "cornflowerblue",
"wildtype" = "tan1"))+
theme(legend.position = c(0.8, 0.2),
legend.title = element_blank())
#p
end_labels <- apply(mcols(map_gr),2,cumsum)[nrow(mcols(map_gr)),]
end_x_pos <- ggplot_build(p)$data[[1]][,"x"][nrow(ggplot_build(p)$data[[1]])]Warning: Use of `axisdf$end_chr` is discouraged. Use `end_chr` instead.
Use of `axisdf$end_chr` is discouraged. Use `end_chr` instead.end_y_pos <- apply(mcols(map_gr),2,cumsum)[nrow(mcols(map_gr)),]
end_y_pos mutant wildtype
1304.705 1030.478 p_pcr <- p + guides(fill = "none",color = "none")+ggtitle("BC1F1 PCR pups male")
p_pcr +
guides(color = "none")+ggtitle("BC1F1 PCR pups male")+
theme(strip.text = element_blank(),
panel.grid.minor.x = element_blank(),
panel.grid.major = element_blank(),
panel.grid.major.x = element_blank())Warning: Use of `axisdf$end_chr` is discouraged. Use `end_chr` instead.
Sample counts from AGRF PCR-based method
table(all_rse_pcr_map$sampleType)
Fancm-/- Fancm+/+
31 25 table(all_rse_pcr_map$group)
   mutant_25-6-19_informative mutant_30-08-2019_informative
                           21                            10
  wildtype_2-5-19_informative     wt_30-08-2019_informative
                           15                            10
Bulk bc1f1
bc1f1_samples <- readRDS(file = "output/outputR/analysisRDS/all_rse_count_07-20.rds")
table(bc1f1_samples$sampleGroup)
Female_HET  Female_KO  Female_WT   Male_HET    Male_KO    Male_WT
50 100 50 34 98 40 plotCount(bc1f1_samples[,bc1f1_samples$sampleGroup %in%
c("Male_HET","Male_WT","Male_KO")],
by_chr =TRUE,
group_by = "sampleGroup")+guides(color = "none")+
theme(axis.text.x = element_text(angle=90))
plotCount(bc1f1_samples[,bc1f1_samples$sampleGroup %in%
                          c("Male_HET","Male_WT","Male_KO")],
          by_chr =F,
          group_by = "sampleGroup")+guides(color = "none")+
  scale_color_manual(labels = c("Male_KO"="Fancm-/-",
                                "Male_HET"="Fancm+/-",
                                "Male_WT"="Fancm+/+"),
                     values = c("Male_KO" = "cornflowerblue",
                                "Male_WT" = "tan1",
                                "Male_HET" = "grey50"))
Scale for 'colour' is already present. Adding another scale for 'colour',
which will replace the existing scale.
plotCount(bc1f1_samples[,bc1f1_samples$sampleGroup %in%
                          c("Female_HET","Female_WT","Female_KO")],
          by_chr =TRUE,
          group_by = "sampleGroup")+guides(color = "none")+
  theme(axis.text.x = element_text(angle=90))
plotCount(bc1f1_samples[,bc1f1_samples$sampleGroup %in%
                          c("Female_HET","Female_WT","Female_KO")],
          by_chr =F,
          group_by = "sampleGroup")+guides(color = "none")+theme_classic(base_size = 18)+
  scale_color_manual(labels = c("Female_KO"="Fancm-/-", "Female_HET"="Fancm+/-",
                                "Female_WT"="Fancm+/+"),
                     values = c("Female_KO" = "cornflowerblue",
                                "Female_WT" = "tan1",
                                "Female_HET" = "grey50"))
Scale for 'colour' is already present. Adding another scale for 'colour',
which will replace the existing scale.
bc1f1_samples_dist <- calGeneticDist(bc1f1_samples,group_by = "sampleGroup"  )
bc1f1_samples_dist_male <- calGeneticDist(bc1f1_samples[,bc1f1_samples$sampleGroup %in%
                                                          c("Male_HET","Male_WT","Male_KO")],
                                          group_by = "sampleGroup"  )

bc1f1_samples_dist_female <- calGeneticDist(bc1f1_samples[,bc1f1_samples$sampleGroup %in%
                                                          c("Female_HET","Female_WT","Female_KO")],group_by = "sampleGroup"  )
BC1F1 bulk seq sample count
table(bc1f1_samples$sampleGroup)
Female_HET  Female_KO  Female_WT   Male_HET    Male_KO    Male_WT
50 100 50 34 98 40 colSums(rowData(bc1f1_samples_dist)$kosambi) Male_KO Female_KO Female_WT Female_HET Male_WT Male_HET
1339.082 1438.272 1406.645 1364.624 1255.786 1242.336 BC1F1 bulk sequencing genetic distance cumulative plot
bc1f1_samples_dist_gr <- rowRanges(bc1f1_samples_dist_male)
mcols(bc1f1_samples_dist_gr) <- rowData(bc1f1_samples_dist_male)$kosambi

# plotWholeGenome(bc1f1_samples_dist_gr)+theme_bw(base_size = 18)+
#   scale_color_manual(labels = c("Male_KO"="Fancm-/-", "Male_HET"="Fancm+/-",
#                                 "Male_WT"="Fancm+/+"),
#                      values = c("Male_KO" = "cornflowerblue",
#                                 "Male_WT" = "tan1",
#                                 "Male_HET" = "grey"))+
#  theme(legend.position = c(0.8, 0.3),
#        axis.text.x = element_text(angle = 90))

p <- plotWholeGenomeCustmise(bc1f1_samples_dist_gr)+theme_bw(base_size = 18)+
  scale_color_manual(labels = c("Male_KO"="Fancm-/-", "Male_HET"="Fancm+/-",
                                "Male_WT"="Fancm+/+"),
                     values = c("Male_KO" = "cornflowerblue",
                                "Male_WT" = "tan1",
                                "Male_HET" = "grey50"))
 # theme(legend.position = c(0.8, 0.3),
 #       axis.text.x = element_text(angle = 90),
 #       legend.title = element_blank())+guides(color = guide_legend(override.aes = list(size = 2)))
 #

p_bulk_male <- p +  guides(color = "none", fill = "none")+ggtitle("BC1F1 bulk sequencing pups male")

p_bulk_male +
    theme(strip.text = element_blank(),
             panel.grid.minor.x = element_blank(),
             panel.grid.major = element_blank(),
          panel.grid.major.x = element_blank())
Warning: Use of `axisdf$end_chr` is discouraged. Use `end_chr` instead.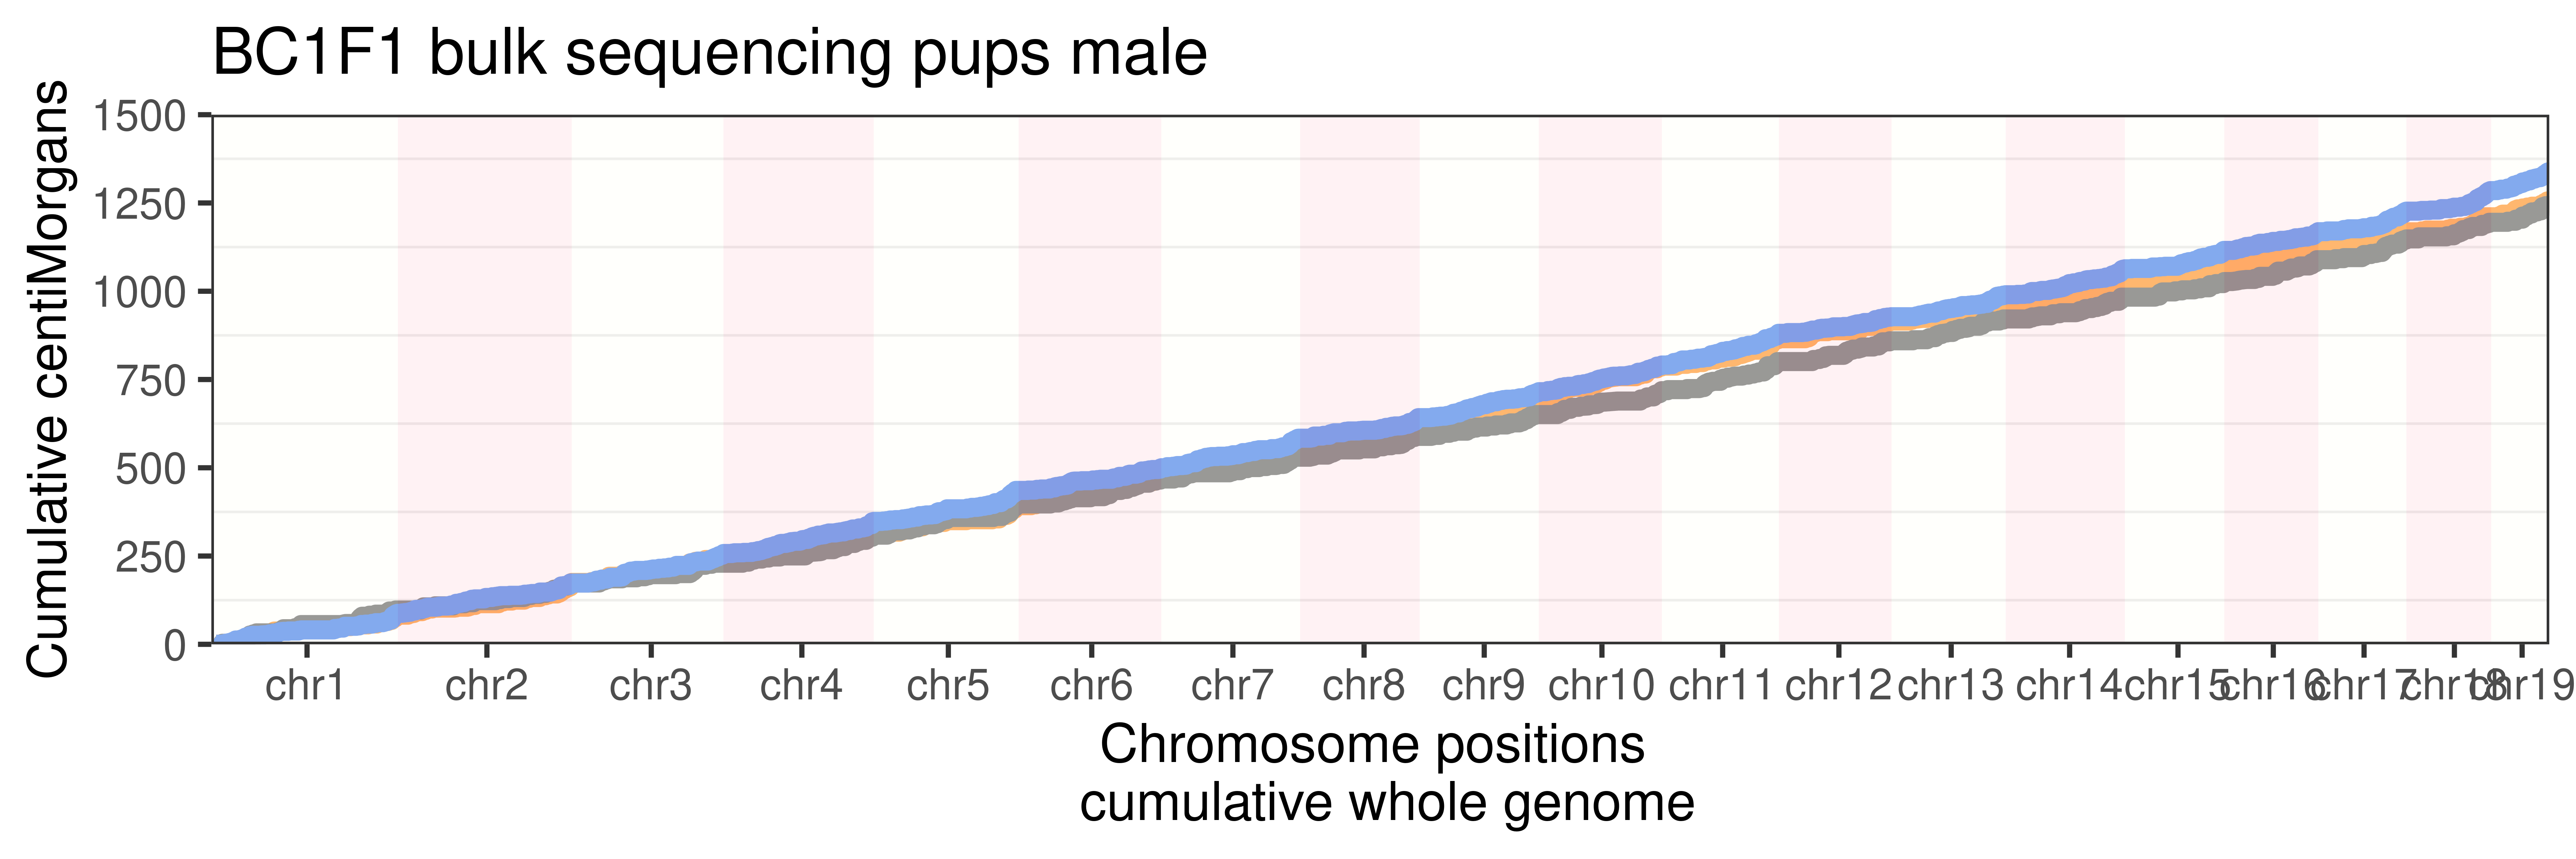
BC1F1 male legend only
bc1f1_samples_dist_female <- calGeneticDist(bc1f1_samples[,bc1f1_samples$sampleGroup %in%
                                                          c("Female_HET","Female_WT","Female_KO")],group_by = "sampleGroup"  )
bc1f1_samples_dist_gr <- rowRanges(bc1f1_samples_dist_female)

mcols(bc1f1_samples_dist_gr) <- rowData(bc1f1_samples_dist_female)$kosambi
# plotWholeGenomeCustmise(bc1f1_samples_dist_gr)+theme_bw(base_size = 18)+
#   scale_color_manual(labels = c("Female_KO"="Fancm-/-", "Female_HET"="Fancm+/-",
#                                 "Female_WT"="Fancm+/+"),
#                      values = c("Female_KO" = "cornflowerblue",
#                                 "Female_WT" = "tan1",
#                                 "Female_HET" = "grey"))+
# theme(legend.position = c(0.8, 0.3),
#        axis.text.x = element_text(angle = 90))+guides(color=FALSE,fill="none")+
#   scale_y_continuous(breaks = c(0,250,500,750,1000,1250,1500))

p_bulk_female <- plotWholeGenomeCustmise(bc1f1_samples_dist_gr)+theme_bw(base_size = 18)+
  scale_color_manual(labels = c("Female_KO"="Fancm-/-", "Female_HET"="Fancm+/-",
                                "Female_WT"="Fancm+/+"),
                     values = c("Female_KO" = "cornflowerblue",
                                "Female_HET" = "grey50","Female_WT" = "tan1"))+
  guides(fill="none")+ggtitle("")+ theme(strip.text = element_blank(),
             panel.grid.minor.x = element_blank(),
             panel.grid.major = element_blank(),
          panel.grid.major.x = element_blank())

p_bulk_female
Warning: Use of `axisdf$end_chr` is discouraged. Use `end_chr` instead.
g_legend <- function(a.gplot){
    tmp <- ggplot_gtable(ggplot_build(a.gplot))
    leg <- which(sapply(tmp$grobs, function(x) x$name) == "guide-box")
    legend <- tmp$grobs[[leg]]
    legend
}

legend <- g_legend(p_bulk_female)
Warning: Use of `axisdf$end_chr` is discouraged. Use `end_chr` instead.oldPar <- par()
par(bg=NA)
grid.newpage()
grid.draw(legend) 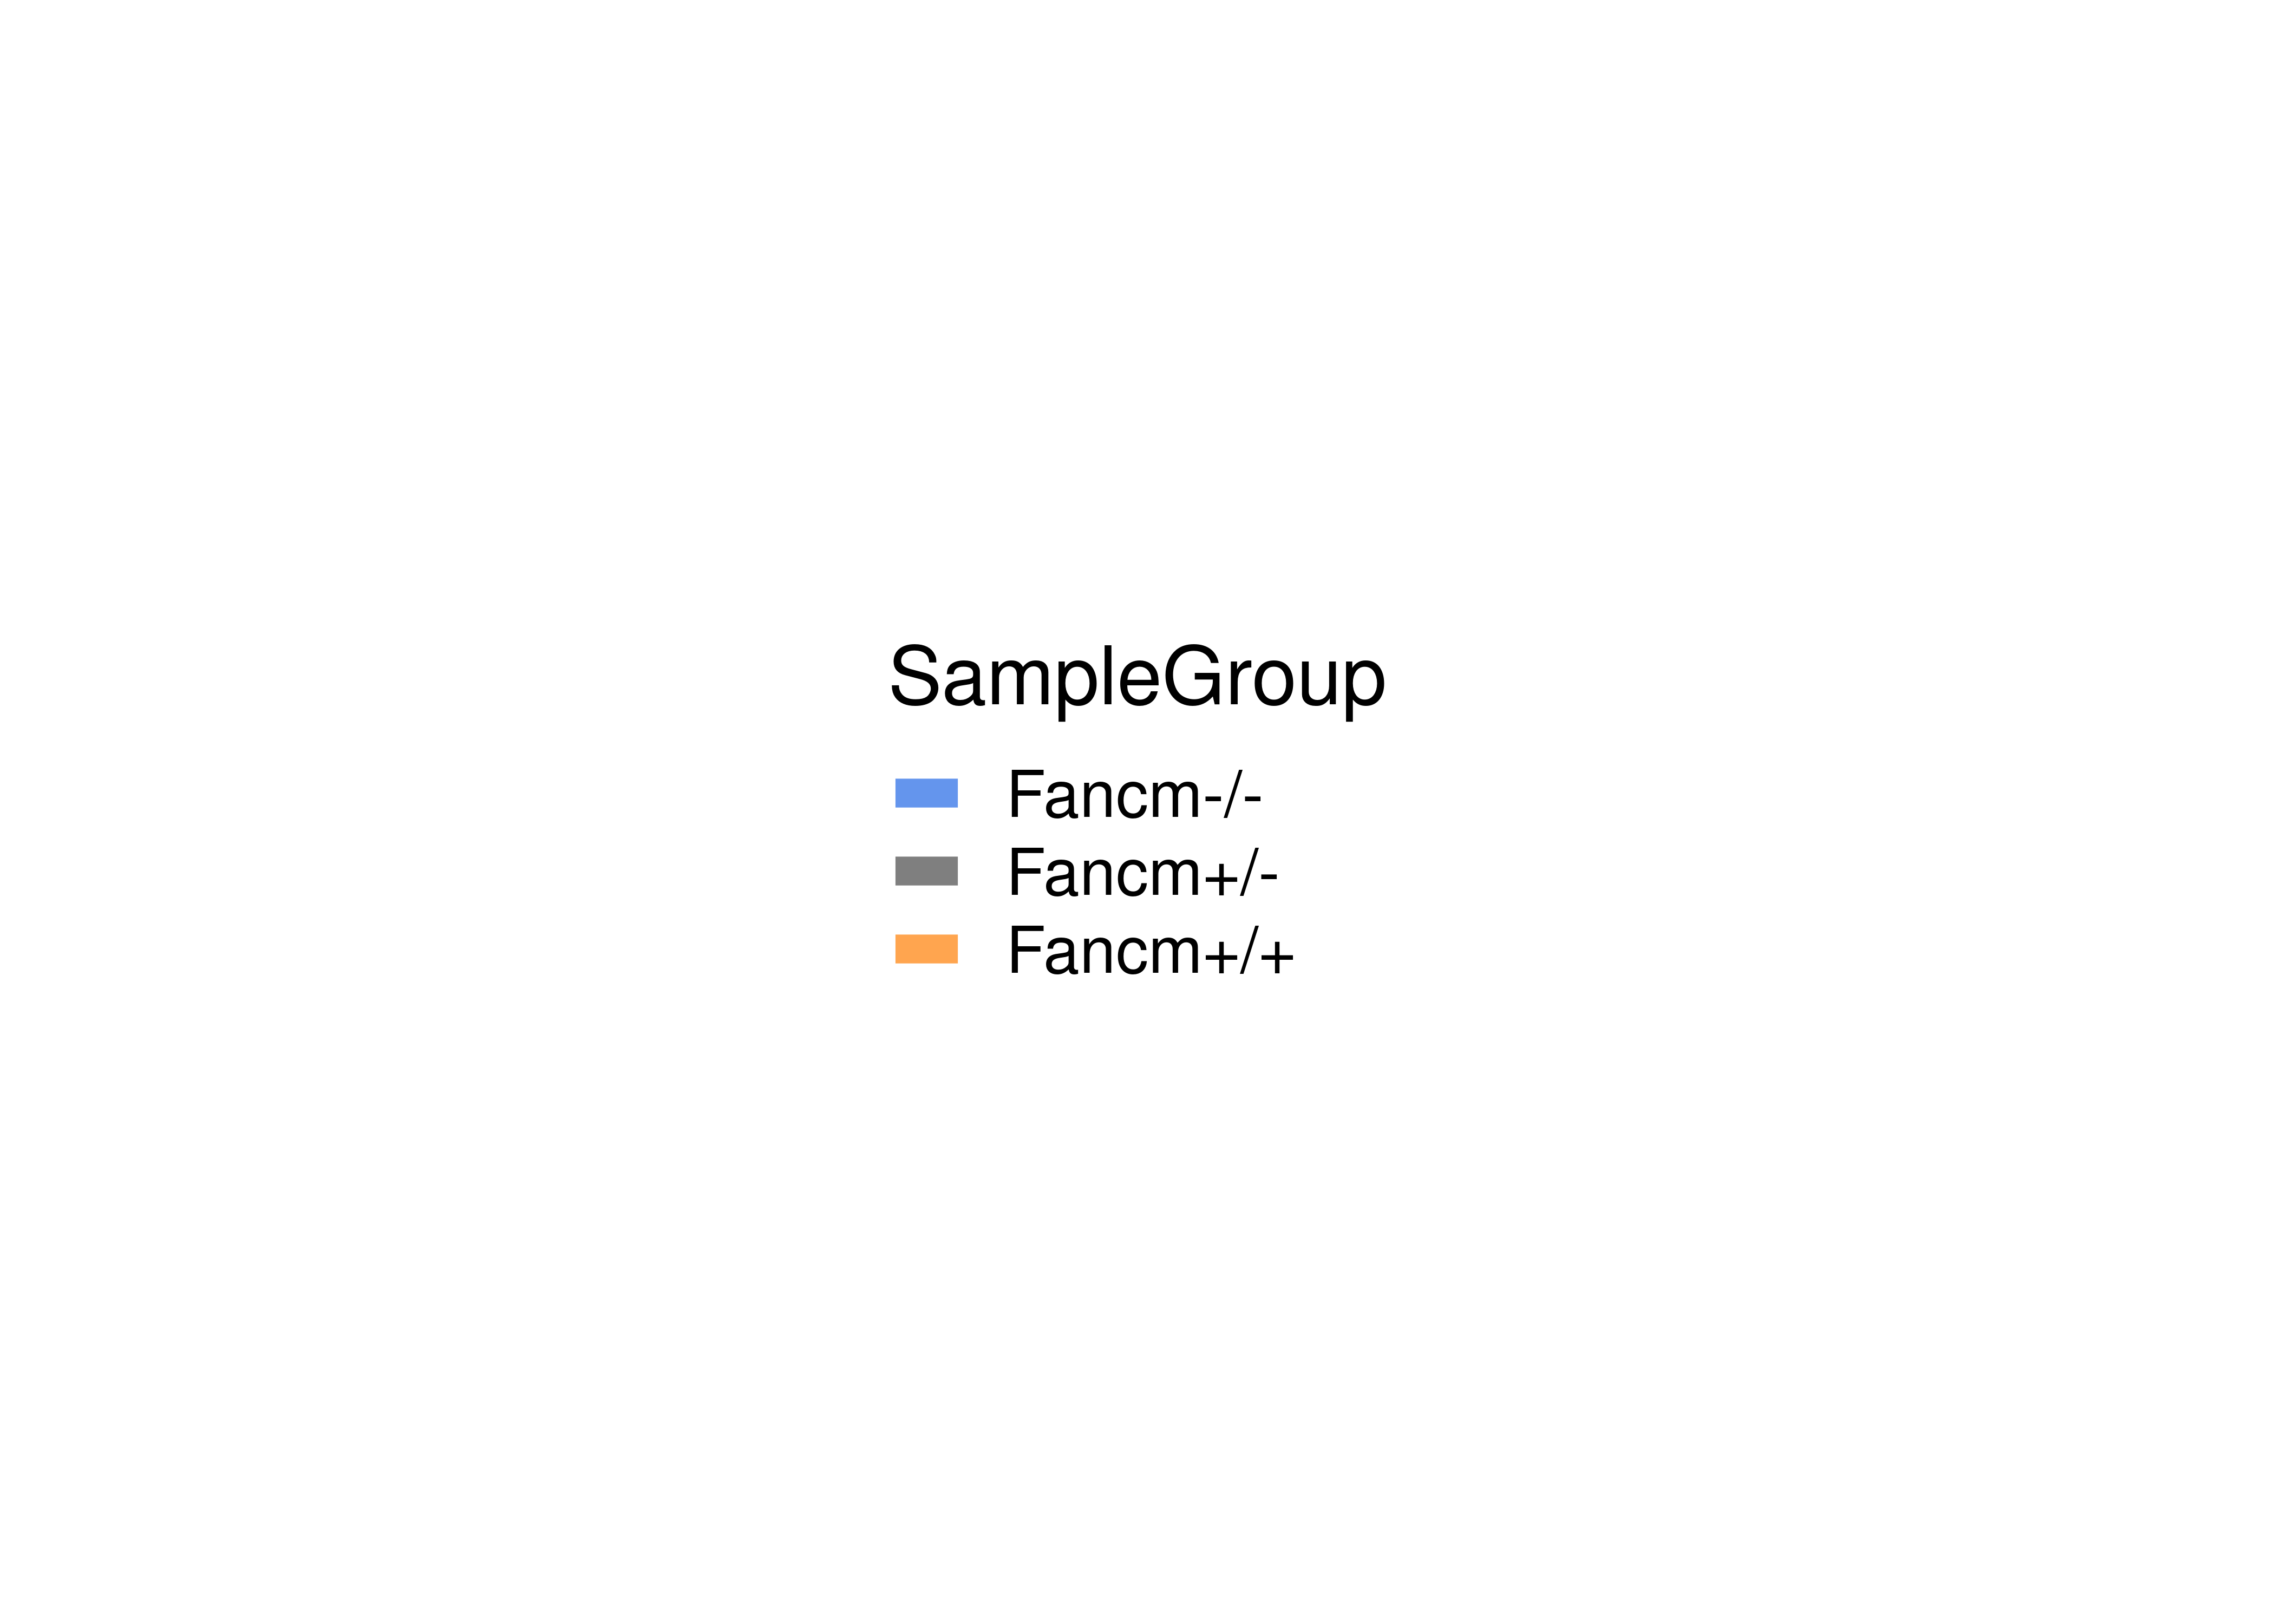
dev.copy(png,'myplot.png')png
3 dev.off()png
2 par(oldPar)Warning in par(oldPar): graphical parameter "cin" cannot be setWarning in par(oldPar): graphical parameter "cra" cannot be setWarning in par(oldPar): graphical parameter "csi" cannot be setWarning in par(oldPar): graphical parameter "cxy" cannot be setWarning in par(oldPar): graphical parameter "din" cannot be setWarning in par(oldPar): graphical parameter "page" cannot be setBC1F1 male gen dist by chr
# bc1f1_samples_bin_dist <- calGeneticDist(bc1f1_samples,group_by = "sampleGroup",
#                                          bin_size = 1e7)
bc1f1_samples_dist_male_bin_dist <- calGeneticDist(bc1f1_samples[,bc1f1_samples$sampleGroup %in%
                                                                   c("Male_HET","Male_WT","Male_KO")],
                                                   bin_size = 1e7,
                                                   group_by = "sampleGroup")

bc1f1_samples_dist_female <- calGeneticDist(bc1f1_samples[,bc1f1_samples$sampleGroup %in%
                                                            c("Female_HET","Female_WT","Female_KO")],
                                            bin_size = 1e7,group_by = "sampleGroup" )
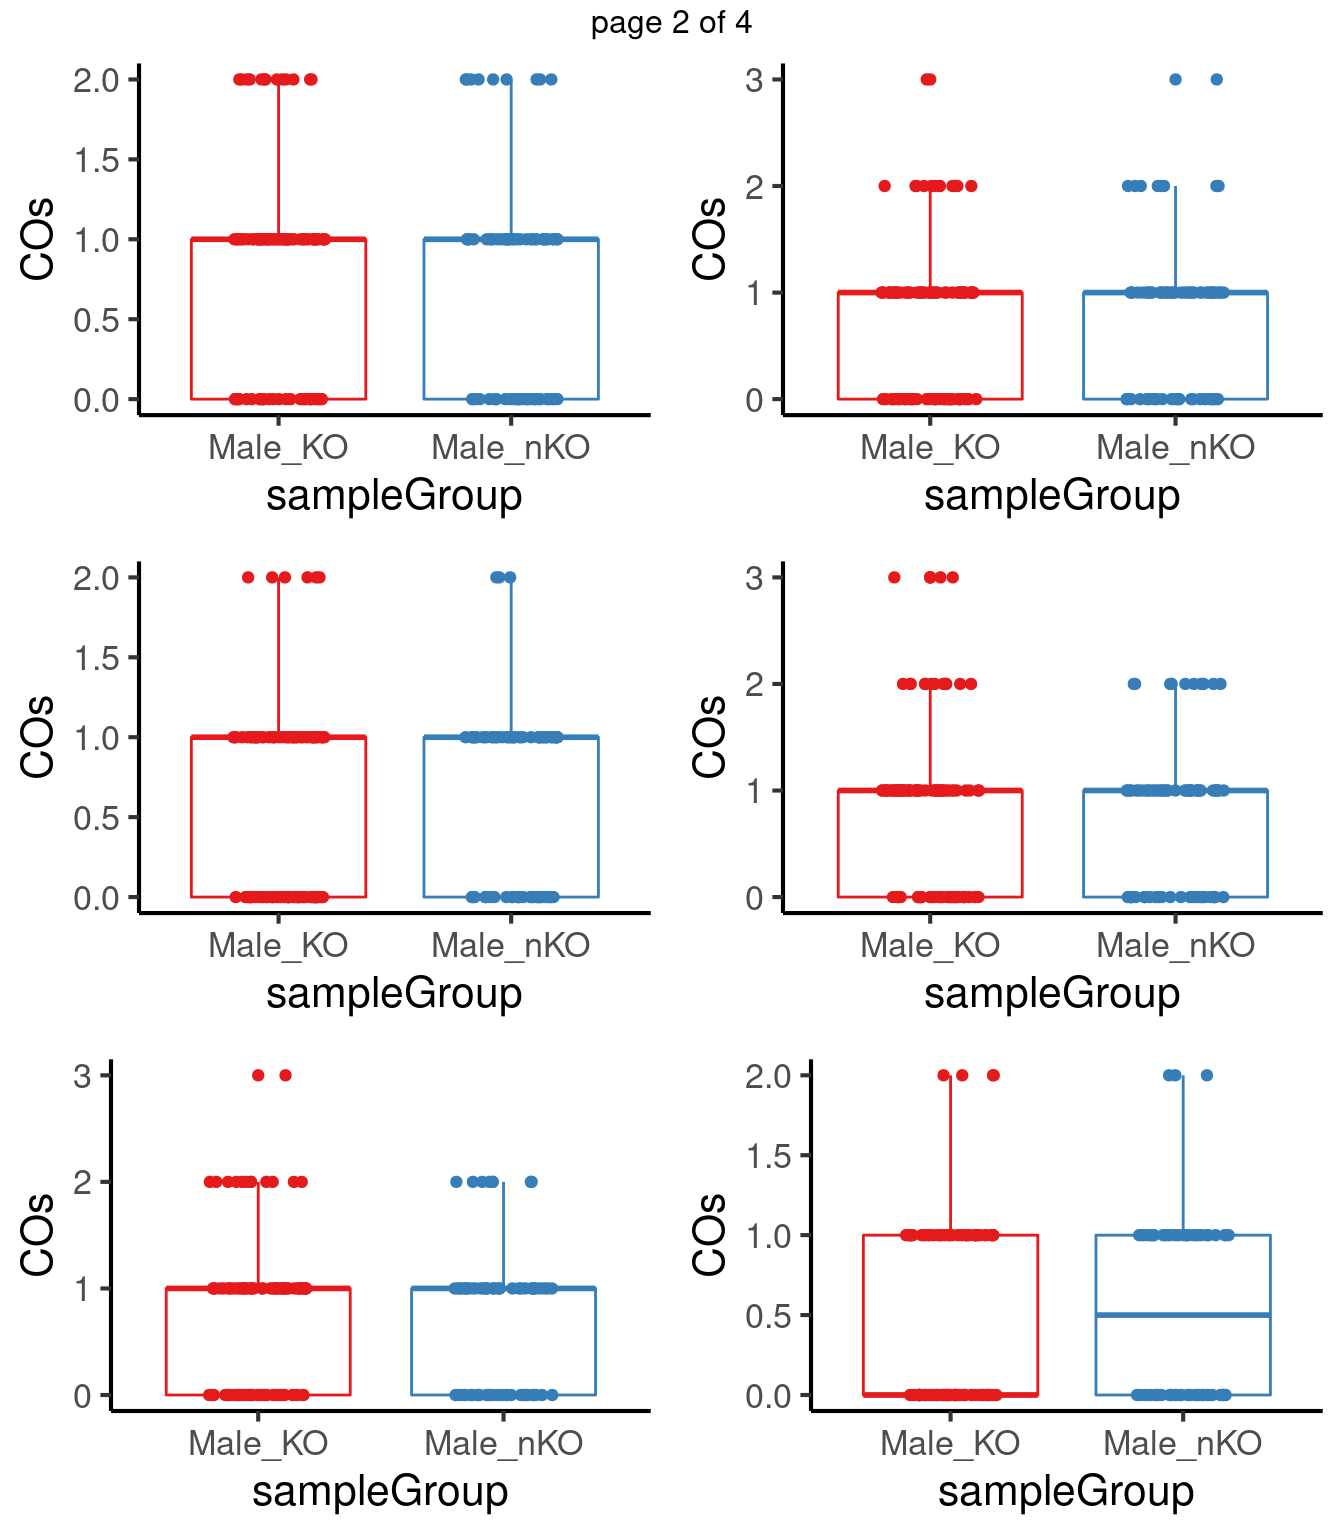
BC1F1 male CO counts per chr
crossover_counts <- bc1f1_samples[,bc1f1_samples$sampleGroup %in%
                                    c("Male_HET","Male_WT","Male_KO")]
crossover_counts$sampleType <-
  plyr::mapvalues(crossover_counts$sampleGroup,
                  from =  c("Male_HET","Male_WT","Male_KO"),
                  to =  c("Male_nKO","Male_nKO","Male_KO"))

plot_list <- list()
pvals <- c()
for(chr in paste0("chr",seq(1:19))) {
  co_df <- data.frame(nCOs = colSums(as.matrix(assay(crossover_counts[seqnames(crossover_counts)==chr,]))),
                     sampleGroup = crossover_counts$sampleGroup,
                    sampleType = crossover_counts$sampleType)

 tresults <- t.test(co_df$nCOs[co_df$sampleType=="Male_KO"],
       co_df$nCOs[co_df$sampleType=="Male_nKO"],
       alternative = "greater",)
 pvals <-c(pvals,tresults$p.value)
 p <- plotCount(crossover_counts[seqnames(crossover_counts)==chr,],
                               group_by = "sampleType")
 #tresults$p.value
 # p+ggtitle(paste0(chr,"_p-val",round(tresults$p.value,digits = 3)))+
 #   theme(legend.position = "none")
 plot_list[[chr]] <- p+guides(color = "none")
}
mChrThresPlots <- marrangeGrob(plot_list, nrow=3, ncol=2)
mChrThresPlots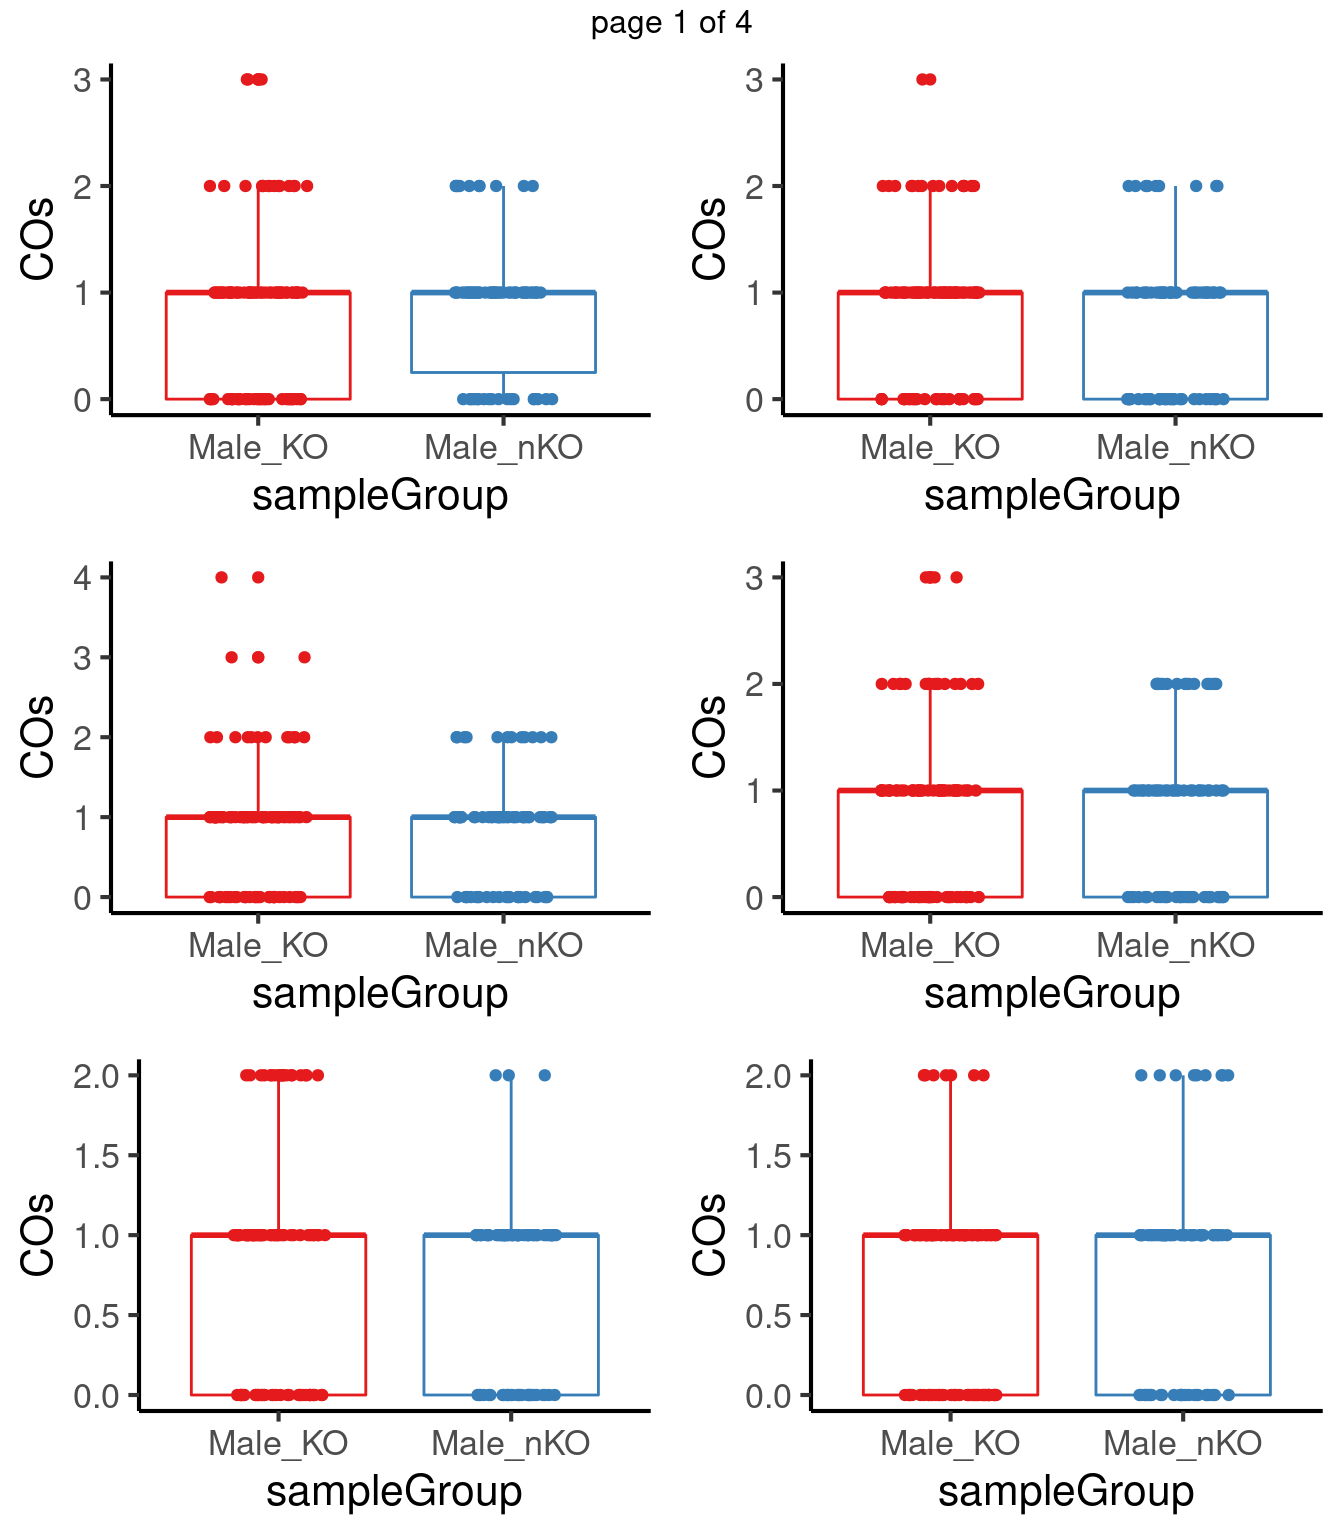
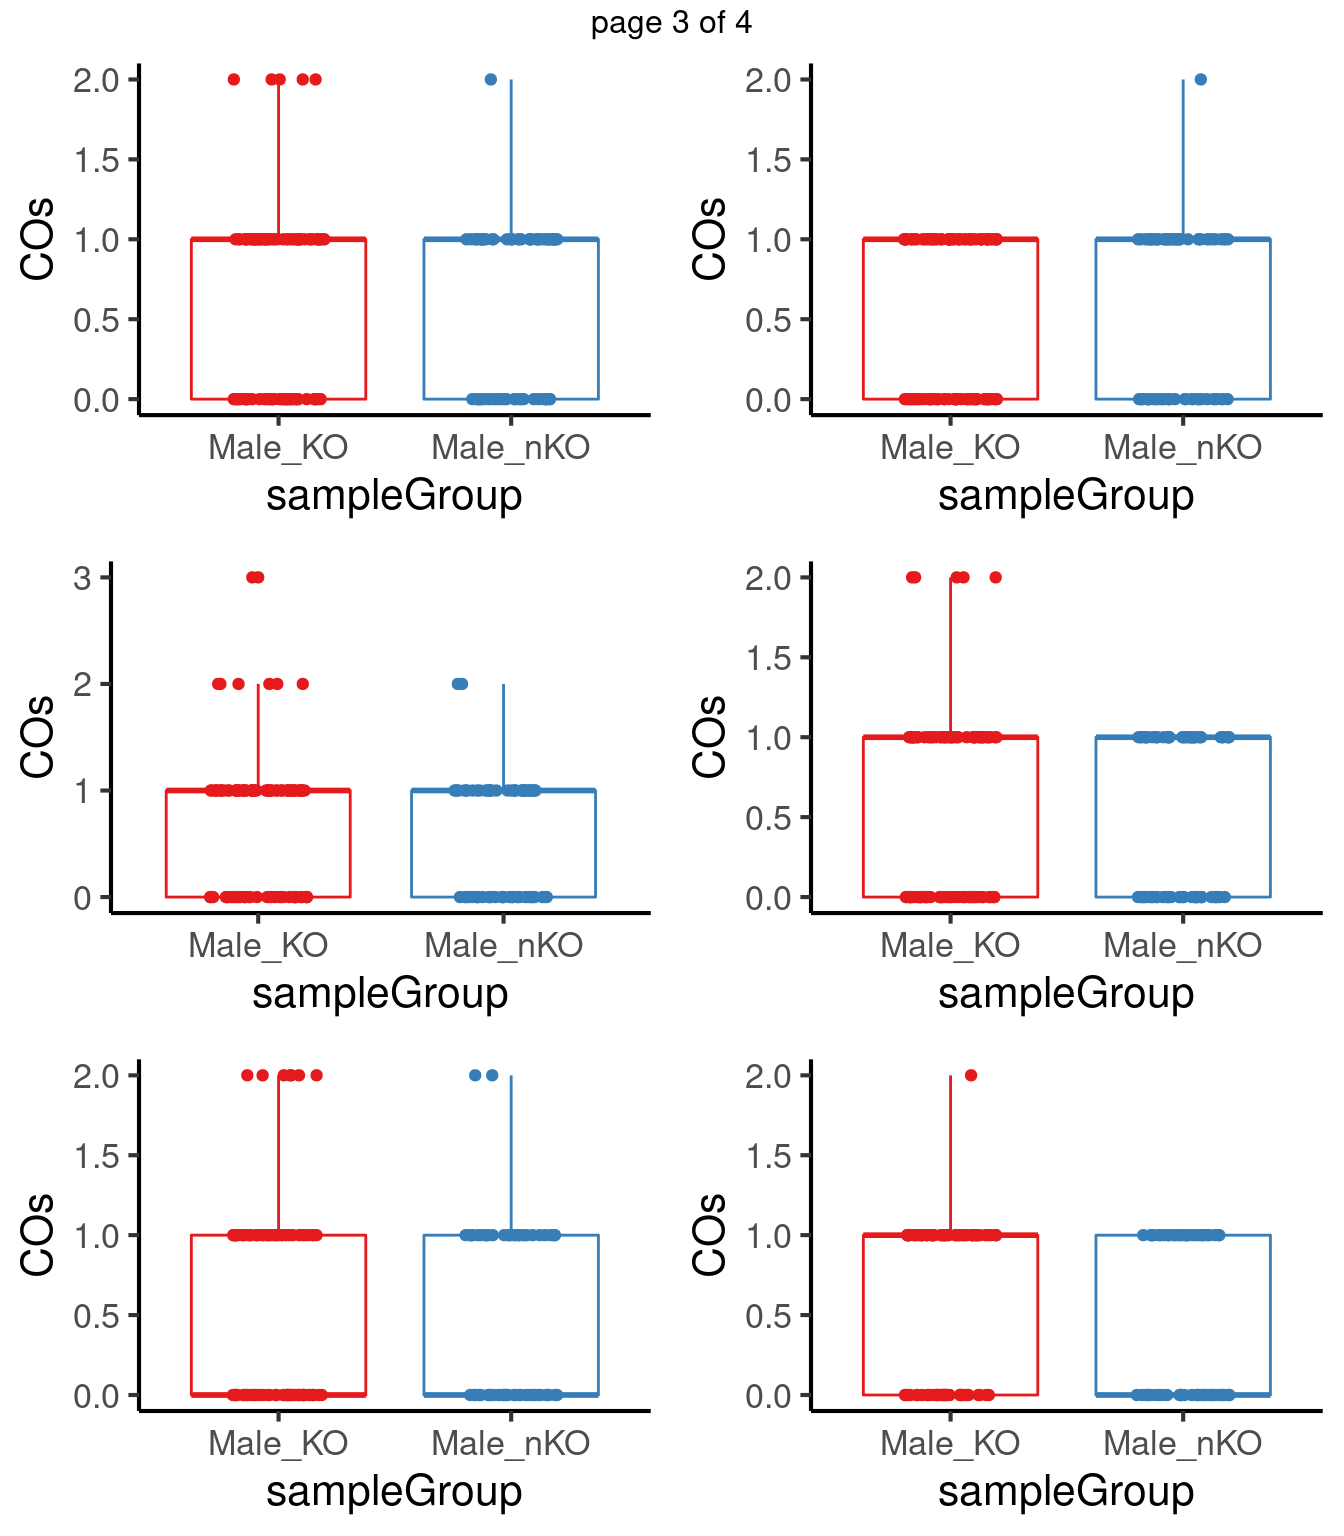
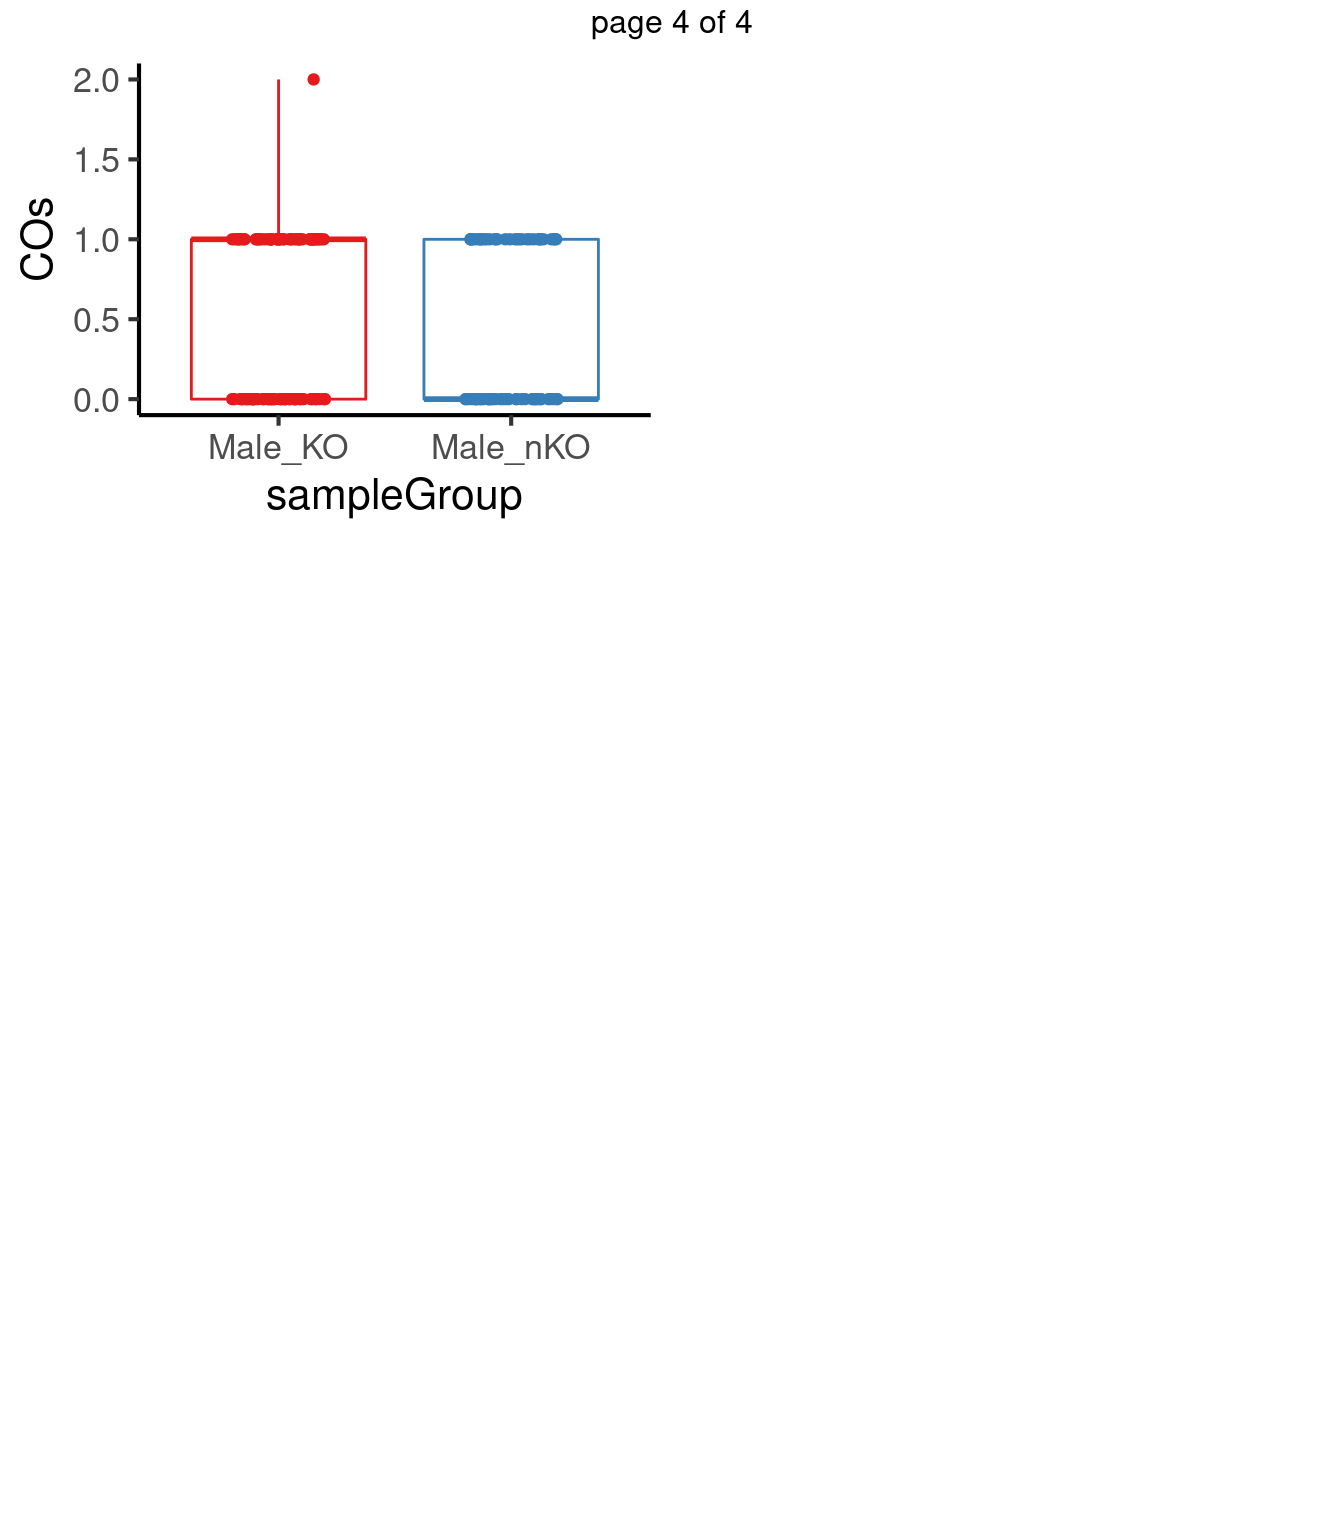
p.adjust(pvals,method = "fdr") [1] 0.7504950 0.7006102 0.2003423 0.2003423 0.5890071 0.8754253 0.4416465
[8] 0.8754253 0.4416465 0.8278012 0.4416465 0.8754253 0.5890071 0.2003423
[15] 0.5710572 0.7799269 0.4416465 0.2003423 0.4416465After multiple testing correction, no chromosome shows significant differences in number of crossovers in the two group.
scCNV
#scCNV <- readRDS(file  = "~/Projects/rejy_2020_single-sperm-co-calling/output/outputR/analysisRDS/allSamples.setting4.rds")

#
# minSNP <- 10
# minlogllRatio <- 20
# bpDist <- 1e5
# maxRawCO <- 5
# minCellSNP <- 500
# cores <- 3
# biasTol <- 0.45
# setting 4.3
# WC_522 WC_526 re-called
#  --cmPmb 0.0001 , minDP per cell is 1 (inclusive of 1)

scCNV <- readRDS(file  = "~/Projects/rejy_2020_single-sperm-co-calling/output/outputR/analysisRDS/countsAll-settings4.3-scCNV-CO-counts_07-mar-2022.rds")
Mean CO per chromosome per individual
# New facet label names for sid variable
sid.labs.names <- c(expression(italic(Fancm^Delta*""^"2/"*""^Delta*""^"2"*" 1")),
               expression(italic(Fancm^Delta*""^"2/"*""^Delta*""^"2"*" 2")),
               expression(italic(Fancm^Delta*""^"2/"*""^Delta*""^"2"*" 3")),
               expression(italic("Fancm"^"+/+"*" 1" )),
               expression(italic("Fancm"^"+/+"*" 2" )),
               expression(italic("Fancm"^"+/+"*" 3" )))
sid.labs <- c("Mutant1", "Mutant2",
              "Mutant3","Wildtype1",
                                     "Wildtype2","Wildtype3")

names(sid.labs.names) <-sid.labs
names(sid.labs) <- sid.labs

colors <- c("Mutant1" = "cornflowerblue", "Mutant2"= "cornflowerblue",
                                     "Mutant3"= "cornflowerblue","Wildtype1" = "tan1",
                                     "Wildtype2" = "tan1","Wildtype3" = "tan1")
names(colors) <- sid.labs.names


tmp <- assay(scCNV)
tmp$chr <- GenomicRanges::seqnames(scCNV)
tmp <- data.frame(tmp,check.names = FALSE) %>%
  tidyr::pivot_longer(cols = colnames(scCNV),
                      values_to = "COs", names_to = "BC")
tmp$sampleGroup <- plyr::mapvalues(tmp$BC, from = colnames(scCNV),
                                   to = colData(scCNV)[,"sampleGroup"])


tmp$sid <-  plyr::mapvalues(tmp$sampleGroup, from = c("WC_522", "WC_526",
                                     "WC_CNV_43","WC_CNV_42",
                                     "WC_CNV_44","WC_CNV_53"),
                                   to = c("Mutant1", "Mutant2",
                                     "Mutant3","Wildtype1",
                                     "Wildtype2","Wildtype3"))

p_meanco <- tmp %>% dplyr::group_by(chr,BC) %>%
      summarise(ChrCOs = sum(COs),
                sid = unique(sid)) %>%
      dplyr::group_by(chr,sid) %>%
      dplyr::summarise(meanCOs = mean(ChrCOs),
                       lower = meanCOs-sd(ChrCOs)/sqrt(length(ChrCOs)),
                       upper = meanCOs+sd(ChrCOs)/sqrt(length(ChrCOs))) %>%
  mutate(sid = factor(sid,levels =  c("Mutant1", "Mutant2",
                                     "Mutant3","Wildtype1",
                                     "Wildtype2","Wildtype3"),
                      labels = sid.labs.names)) %>%
      ggplot(mapping = aes(x=chr,y = meanCOs,
                           color=sid))+geom_point()+
      geom_errorbar(mapping = aes(ymin = lower,
                                  ymax = upper))+scale_color_manual(values = colors)+
      theme_bw(base_size = 18)+theme(axis.text.x = element_text(angle = 90))+ facet_wrap(.~sid,
                 labeller = labeller(sid = label_parsed)) +guides(color ="none")
`summarise()` has grouped output by 'chr'. You can override using the `.groups` argument.
`summarise()` has grouped output by 'chr'. You can override using the `.groups` argument.# plotCount(scCNV,
# by_chr =TRUE,
# group_by = "sampleGroup")+theme(axis.text.x = element_text(angle=90))+geom_point(aes(color=sampleGroup))+ geom_errorbar(mapping = aes(ymin = lower,ymax = upper,color=sampleGroup))
save_p_p_meanco <- p_meanco + xlab("Chr") + ylab("Mean Crossovers")
save_p_p_meanco
# savePNG(save_p_p_meanco,saveToFile = "output/outputR/analysisRDS/figures/scCNV_per_indi_meanCOs_perChr.png",dpi = 300,
#         fig.width = 12,fig.height = 6)
tmp <- assay(scCNV)
tmp$chr <- GenomicRanges::seqnames(scCNV)
per_sample_meanCOs <- sapply(unique(scCNV$sampleGroup),function(sg){
Matrix::rowMeans(as.matrix(assay(scCNV[,scCNV$sampleGroup == sg])))
})
per_sample_kosambi_cm <- apply(per_sample_meanCOs,2,function(corate){
25*log((1+2*corate)/(1-2*corate))
})
per_sample_meanCOs_gr <- rowRanges(scCNV)
mcols(per_sample_meanCOs_gr) <- per_sample_kosambi_cm
tmp <- data.frame(mcols(per_sample_meanCOs_gr))
tmp$chr <- as.character(seqnames(per_sample_meanCOs_gr))
tmp <- tmp %>%
tidyr::pivot_longer(cols = unique(scCNV$sampleGroup),
values_to = "cM", names_to = "sid") %>%
group_by(sid,chr) %>% summarise(totalCM = sum(cM)) `summarise()` has grouped output by 'sid'. You can override using the `.groups`
argument.tmp$sid <- plyr::mapvalues(tmp$sid, from = c("WC_522", "WC_526",
"WC_CNV_43","WC_CNV_42",
"WC_CNV_44","WC_CNV_53"),
to = c("Mutant1", "Mutant2",
"Mutant3","Wildtype1",
"Wildtype2","Wildtype3"))
p <- tmp %>%
mutate(sid = factor(sid,levels = c("Mutant1", "Mutant2",
"Mutant3","Wildtype1",
"Wildtype2","Wildtype3"),
labels = sid.labs.names),
chr = factor(chr,levels = paste0("chr",1:19))) %>%
ggplot(mapping = aes(x=chr,y = totalCM,
color=sid))+geom_point()+
geom_hline(mapping = aes(yintercept = 50),
linetype = 'dotted')+
scale_color_manual(values = colors)+
theme_bw(base_size = 18)+theme(axis.text.x = element_text(angle = 90))+
guides(color = "none")+ylab("Total centiMorgans")+xlab("Chr")
p+ facet_wrap(.~sid,
labeller = labeller(sid = label_parsed)) 
sampleType.labs <-  c(expression(italic(Fancm^Delta*""^"2/"*""^Delta*""^"2")),
                      expression(italic("Fancm"^"+/+")))
names(sampleType.labs) <-  c("Mutant","Wildtype")
sampleType.labs.colors <- c("Mutant"="cornflowerblue",
                            "Wildtype"="tan1")
colors <- c("Mutant1" = "cornflowerblue", "Mutant2"= "cornflowerblue",
                                     "Mutant3"= "cornflowerblue","Wildtype1" = "tan1",
                                     "Wildtype2" = "tan1","Wildtype3" = "tan1")
scCNV_pertype_meanCOs_perchr <- tmp %>% mutate(sampleType = gsub('[0-9]+', '',sid),
               chr =  factor(chr,levels = paste0("chr",1:19))) %>%
  dplyr::group_by(chr,sampleType) %>%
      dplyr::mutate(meanTotalCM = mean(totalCM ),
                       lower = meanTotalCM-sd(totalCM)/sqrt(length(totalCM)),
                       upper = meanTotalCM+sd(totalCM)/sqrt(length(totalCM))) %>%
  mutate(sampleType = factor(sampleType,levels = c("Mutant","Wildtype"),
                      labels = sampleType.labs))  %>%
  ggplot( aes(x=chr, y = totalCM))+
  geom_jitter(aes(color= sid),width = 0)+scale_color_manual(values = colors)+
  facet_wrap(.~sampleType,
             labeller = labeller(sampleType = label_parsed))+
      theme_bw(base_size = 18)+geom_errorbar(mapping = aes(ymin = lower,
                                  ymax = upper),
                                  color="grey")+
  geom_point(aes(x=chr, y = meanTotalCM ),size = 2,
             color="grey")+
  geom_hline(mapping = aes(yintercept = 50),
                                   linetype = 'dotted')+ylab("Total centiMorgans")+xlab("Chr")+
  theme(axis.text.x = element_text(angle = 90),legend.position = "none")+ylim(c(0,139))

scCNV_pertype_meanCOs_perchr
Warning: Removed 2 rows containing missing values (geom_point).
# savePNG(scCNV_pertype_meanCOs_perchr, saveToFile = "output/outputR/analysisRDS/figures/scCNV_pertype_meanCOs_perchr.png",
# fig.width = 12,fig.height = 6)plotCount(scCNV,
by_chr =F,
group_by = "sampleGroup")+guides(color = "none")+theme_classic(base_size = 18)
scCNV by Fancm genotype
x <- c("mutant","mutant","wildtype","mutant",
                                           "wildtype","wildtype")
xx <- c("Fancm-/-","Fancm-/-","Fancm+/+","Fancm-/-",
                                           "Fancm+/+","Fancm+/+")

scCNV$sampleType <- plyr::mapvalues(scCNV$sampleGroup,from = c("WC_522",
                                                               "WC_526",
                                                               "WC_CNV_42",
                                                               "WC_CNV_43",
                                                               "WC_CNV_44",
                                                               "WC_CNV_53"),
                                    to =xx)
scCNV_dist_individuals <- calGeneticDist(scCNV,group_by = "sampleGroup")
colSums(as.matrix(rowData(scCNV_dist_individuals)$kosambi)) WC_522 WC_526 WC_CNV_53 WC_CNV_42 WC_CNV_43 WC_CNV_44
1430.872 1421.287 1223.997 1291.406 1300.181 1178.705 scCNV_dist_sampleType <- calGeneticDist(scCNV,group_by = "sampleType")
colSums(as.matrix(rowData(scCNV_dist_sampleType)$kosambi))Fancm-/- Fancm+/+
1387.336 1227.412 scCNV_dist_sampleType_gr <- rowRanges(scCNV_dist_sampleType)
mcols(scCNV_dist_sampleType_gr) <- rowData(scCNV_dist_sampleType)$kosambi
#
# plotWholeGenome(scCNV_dist_gr)+theme_bw(base_size = 18)+
# theme(legend.position = c(0.8, 0.27),
# axis.text.x = element_text(angle = 90))+scale_color_viridis_d()+ scale_y_continuous(breaks = c(0,250,500,750,1000,1250,1500))scCNV cell count
table(scCNV_dist_sampleType$sampleType)
Fancm-/- Fancm+/+
218 190 plotCount(scCNV,
by_chr =F,
group_by = "sampleType")+guides(color = "none")+
theme_classic(base_size = 18)+
scale_color_manual(values = c("Fancm-/-" = "cornflowerblue",
"Fancm+/+" = "tan1"))Scale for 'colour' is already present. Adding another scale for 'colour',
which will replace the existing scale.
crossover_counts <- scCNV
crossover_counts$sampleType <-
  plyr::mapvalues(crossover_counts$sampleType,
                  from =  c("mutant","wildtype"),
                  to =  c("Fancm-/-","Fancm+/+"))
The following `from` values were not present in `x`: mutant, wildtypeplot_list <- list()
pvals <- c()
for(chr in paste0("chr",seq(1:19))) {
co_df <- data.frame(nCOs = colSums(as.matrix(assay(crossover_counts[seqnames(crossover_counts)==chr,]))),
sampleGroup = crossover_counts$sampleGroup,
sampleType = crossover_counts$sampleType)
tresults <- t.test(co_df$nCOs[co_df$sampleType=="Fancm-/-"],
co_df$nCOs[co_df$sampleType=="Fancm+/+"],
alternative = "greater",)
pvals <-c(pvals,tresults$p.value)
p <- plotCount(crossover_counts[seqnames(crossover_counts)==chr,],
group_by = "sampleType")+xlab(chr)
#tresults$p.value
# p+ggtitle(paste0(chr,"_p-val",round(tresults$p.value,digits = 3)))+
# theme(legend.position = "none")
plot_list[[chr]] <- p+guides(color = "none")
}mChrThresPlots <- marrangeGrob(plot_list, nrow=3, ncol=2)
mChrThresPlots

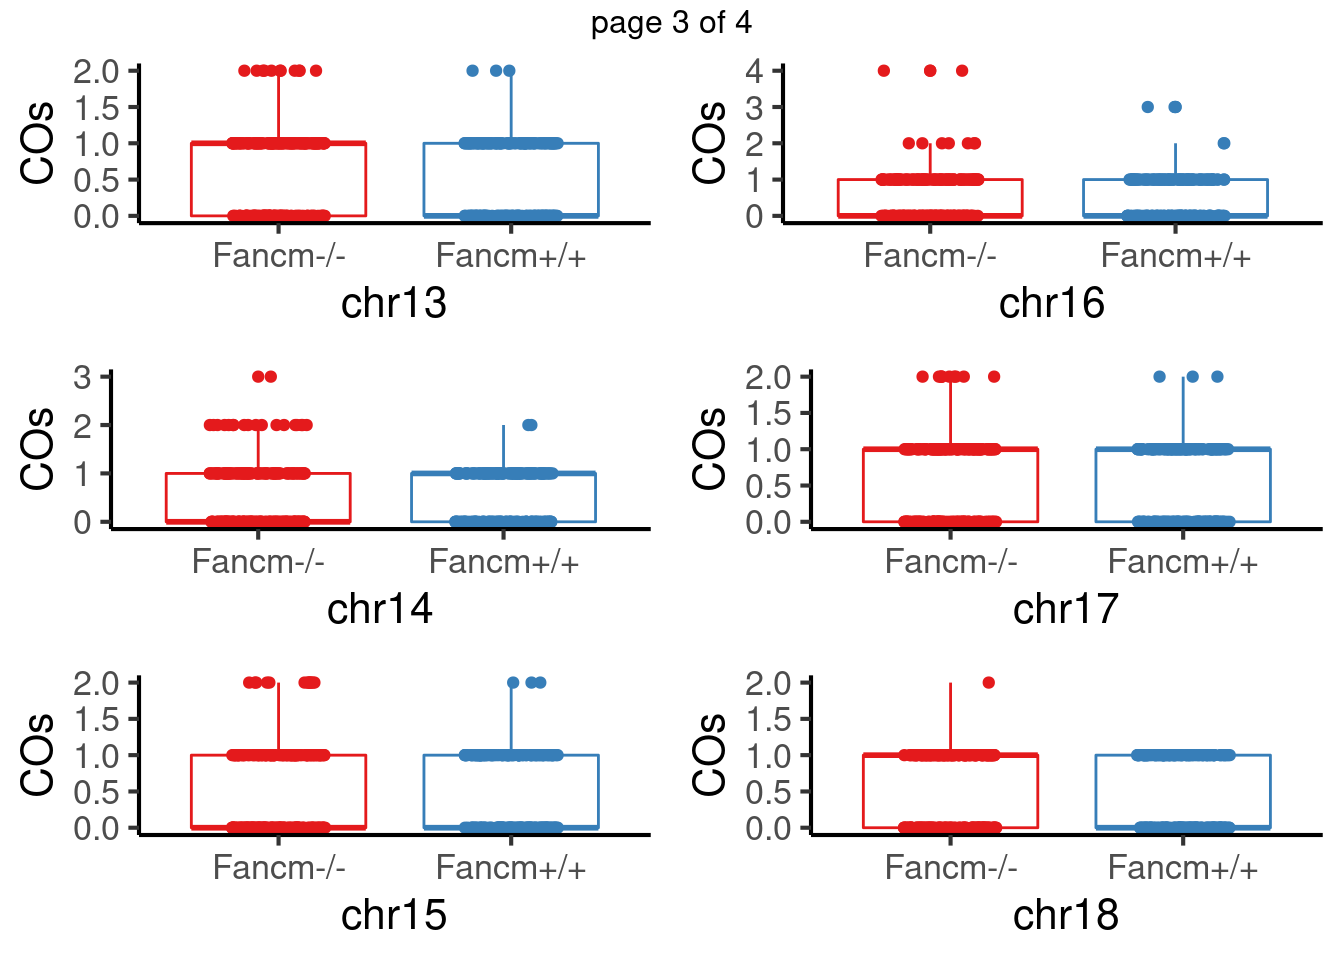
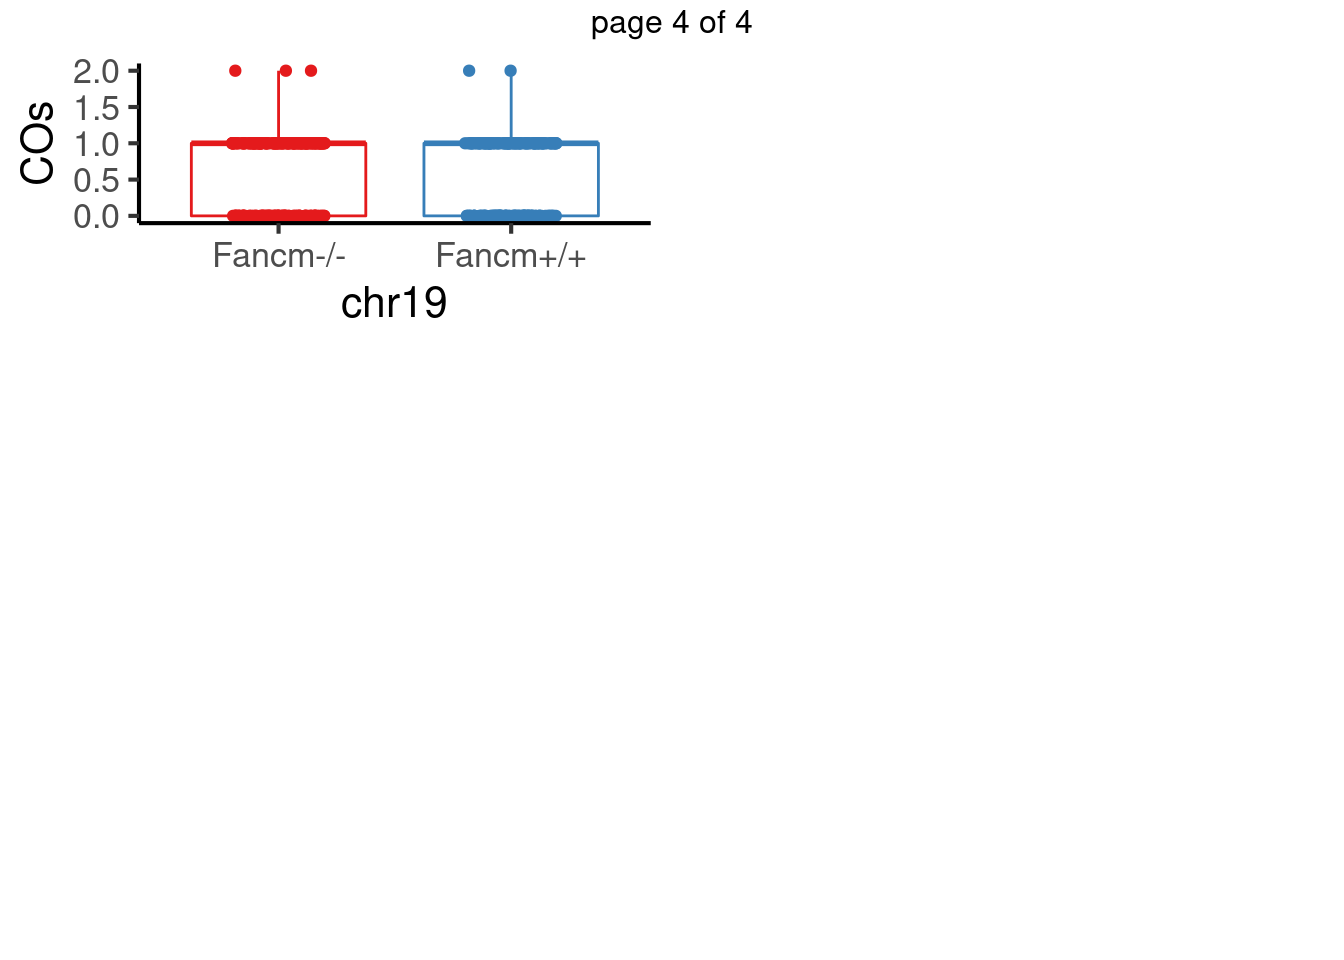
padj <- p.adjust(pvals,method = "fdr")For sperms, some chromosomes show significant difference in number of crossovers:
sig_chrs <- list()
for(i in which(padj<0.05)){
  p <- plot_list[[i]]
  p <- p+ggtitle(paste0("adj.p=",round(p.adjust(pvals,method = "fdr")[i],2)))
  suppressMessages(
    sig_chrs[[paste0("chr",i)]] <- p +
      scale_color_manual("sampleType",labels = c("mutant"= "Fancm-/-",
                                                 "wildtype"="Fancm+/+"),
                     values = c("Fancm-/-" = "cornflowerblue",
                                "Fancm+/+" = "tan1"))
  )
}
mChrThresPlots <- marrangeGrob(sig_chrs, nrow=2, ncol=2)
mChrThresPlots
scCNV 4 selected chroms
The chromosomes were selected because they were showed to have significantly more crossovers detected in the Fancm-/- sperm cells comparing to the Fancm +/+ sperm cells.
plotGeneticDistCustmise <- function (gr, bin = TRUE, chr = NULL, cumulative = FALSE,
                                     line_size = 2)
{
  col_to_plot <- colnames(GenomicRanges::mcols(gr))
  sample_group_colors <- RColorBrewer::brewer.pal(ifelse(length(col_to_plot) >
    2, length(col_to_plot), 3), name = "Set1")
  names(sample_group_colors)[seq_along(col_to_plot)] <- col_to_plot
  if (cumulative) {
    GenomicRanges::mcols(gr) <- apply(mcols(gr), 2, function(x,
      seq = as.character(seqnames(gr))) {
      temp_df <- data.frame(x = x, seq = seq) %>% dplyr::group_by(seq) %>%
        dplyr::mutate(cum = cumsum(x))
      temp_df$cum
    })
  }
  plot_df <- data.frame(gr)
  colnames(plot_df)[(ncol(plot_df) - length(col_to_plot) +
    1):ncol(plot_df)] <- col_to_plot
  plot_df <- plot_df %>% dplyr::mutate(x_tick = 0.5 * (.data$start +
    .data$end))
  plot_df <- plot_df %>% tidyr::pivot_longer(cols = col_to_plot,
    names_to = "SampleGroup", values_to = "bin_dist")
  x_tick <- bin_dist <- end <- SampleGroup <- NULL
  if (is.null(chr)) {
    p <- plot_df %>% ggplot() + geom_step(mapping = aes(x = x_tick,
      y = bin_dist, color = SampleGroup), size = line_size)
  }
  else {
    p <- plot_df %>% dplyr::filter(seqnames %in% chr) %>%
      ggplot() + geom_step(mapping = aes(x = end, y = bin_dist,
      color = SampleGroup), size = line_size)
  }
  p <- p + scale_x_continuous(labels = scales::unit_format(unit = "M",
    scale = 1e-06)) + facet_wrap(. ~ seqnames, ncol = 1,
    scales = "free") + theme_classic(base_size = 18) + xlab("Chromosome positions") +
    scale_color_manual(values = sample_group_colors)
  if (cumulative) {
    p + ylab("cumulative centiMorgans")
  }
  else {
    p + ylab("centiMorgans")
  }
}
#c(0,25e6,50e6,75e6,100e6,125e6)
selected_chrs <- which(padj<0.05)
chr_cums <- list()
for(chr in paste0("chr",selected_chrs) ){
suppressMessages(
chr_cums[[chr]] <- plotGeneticDistCustmise(scCNV_dist_sampleType_gr,chr =chr,
cumulative = TRUE, line_size = 2)+
scale_color_manual("sampleType",labels = c("Fancm-/-"= "Fancm-/-", "Fancm+/+"="Fancm+/+"),
values = c("Fancm-/-" = "cornflowerblue",
"Fancm+/+" = "tan1"))+
scale_x_continuous(labels = scales::unit_format(unit = "M",
scale = 1e-06),
# limits = c(0,135e6),
breaks= c(25e6,75e6,125e6,175e6))+ylab("")+xlab("")+
theme(axis.title= element_text(size = 25),
axis.text = element_text(size = 25),strip.text.x = element_text(size = 22),
panel.grid.minor = element_line(colour = "grey", size = 0.2),
panel.grid.major = element_blank())+guides(color = "none"))
}# arg_mchrs1 <- arrangeGrob(chr_cums$chr8+theme(axis.title.x = element_blank(),
# plot.margin = margin(t=10,r=8)),
# chr_cums$chr9+theme(axis.title.x = element_blank(),
# plot.margin = margin(t=10,r=8)))
# arg_mchrs2 <- arrangeGrob(chr_cums$chr11+theme(plot.margin = margin(t=10,r=8))+scale_y_continuous(breaks = c(0,25,50,75)),
# chr_cums$chr18+theme(plot.margin = margin(t=10,r=8)))
chr_cums <- lapply(chr_cums, function(p){
p +theme(axis.title.x = element_blank(),
plot.margin = margin(t=10,r=8))+
scale_y_continuous(breaks = c(0,25,50,75,100))
})
p_four_chrs_cum_dist <- marrangeGrob(chr_cums,
left = textGrob("Cumulative centiMorgans",rot = 90,gp = gpar(fontsize=25)),
bottom = textGrob("Chromosome positions",
rot = 0,gp = gpar(fontsize=25)),nrow=2,ncol =2,
top = textGrob(""),
right = textGrob(" "))
# grid.arrange(arg_mchrs2,left = textGrob("Cumulative centiMorgans",rot = 90,gp = gpar(fontsize=25)),
# bottom = textGrob("Chromosome positions",rot = 0,gp = gpar(fontsize=25)),nrow =1,ncol=1)
# grid.arrange(arg_mchrs,left = textGrob("Cumulative centiMorgans",rot = 90,gp = gpar(fontsize=25)),
# bottom = textGrob("Chromosome positions",rot = 0,gp = gpar(fontsize=25)))
p_four_chrs_cum_dist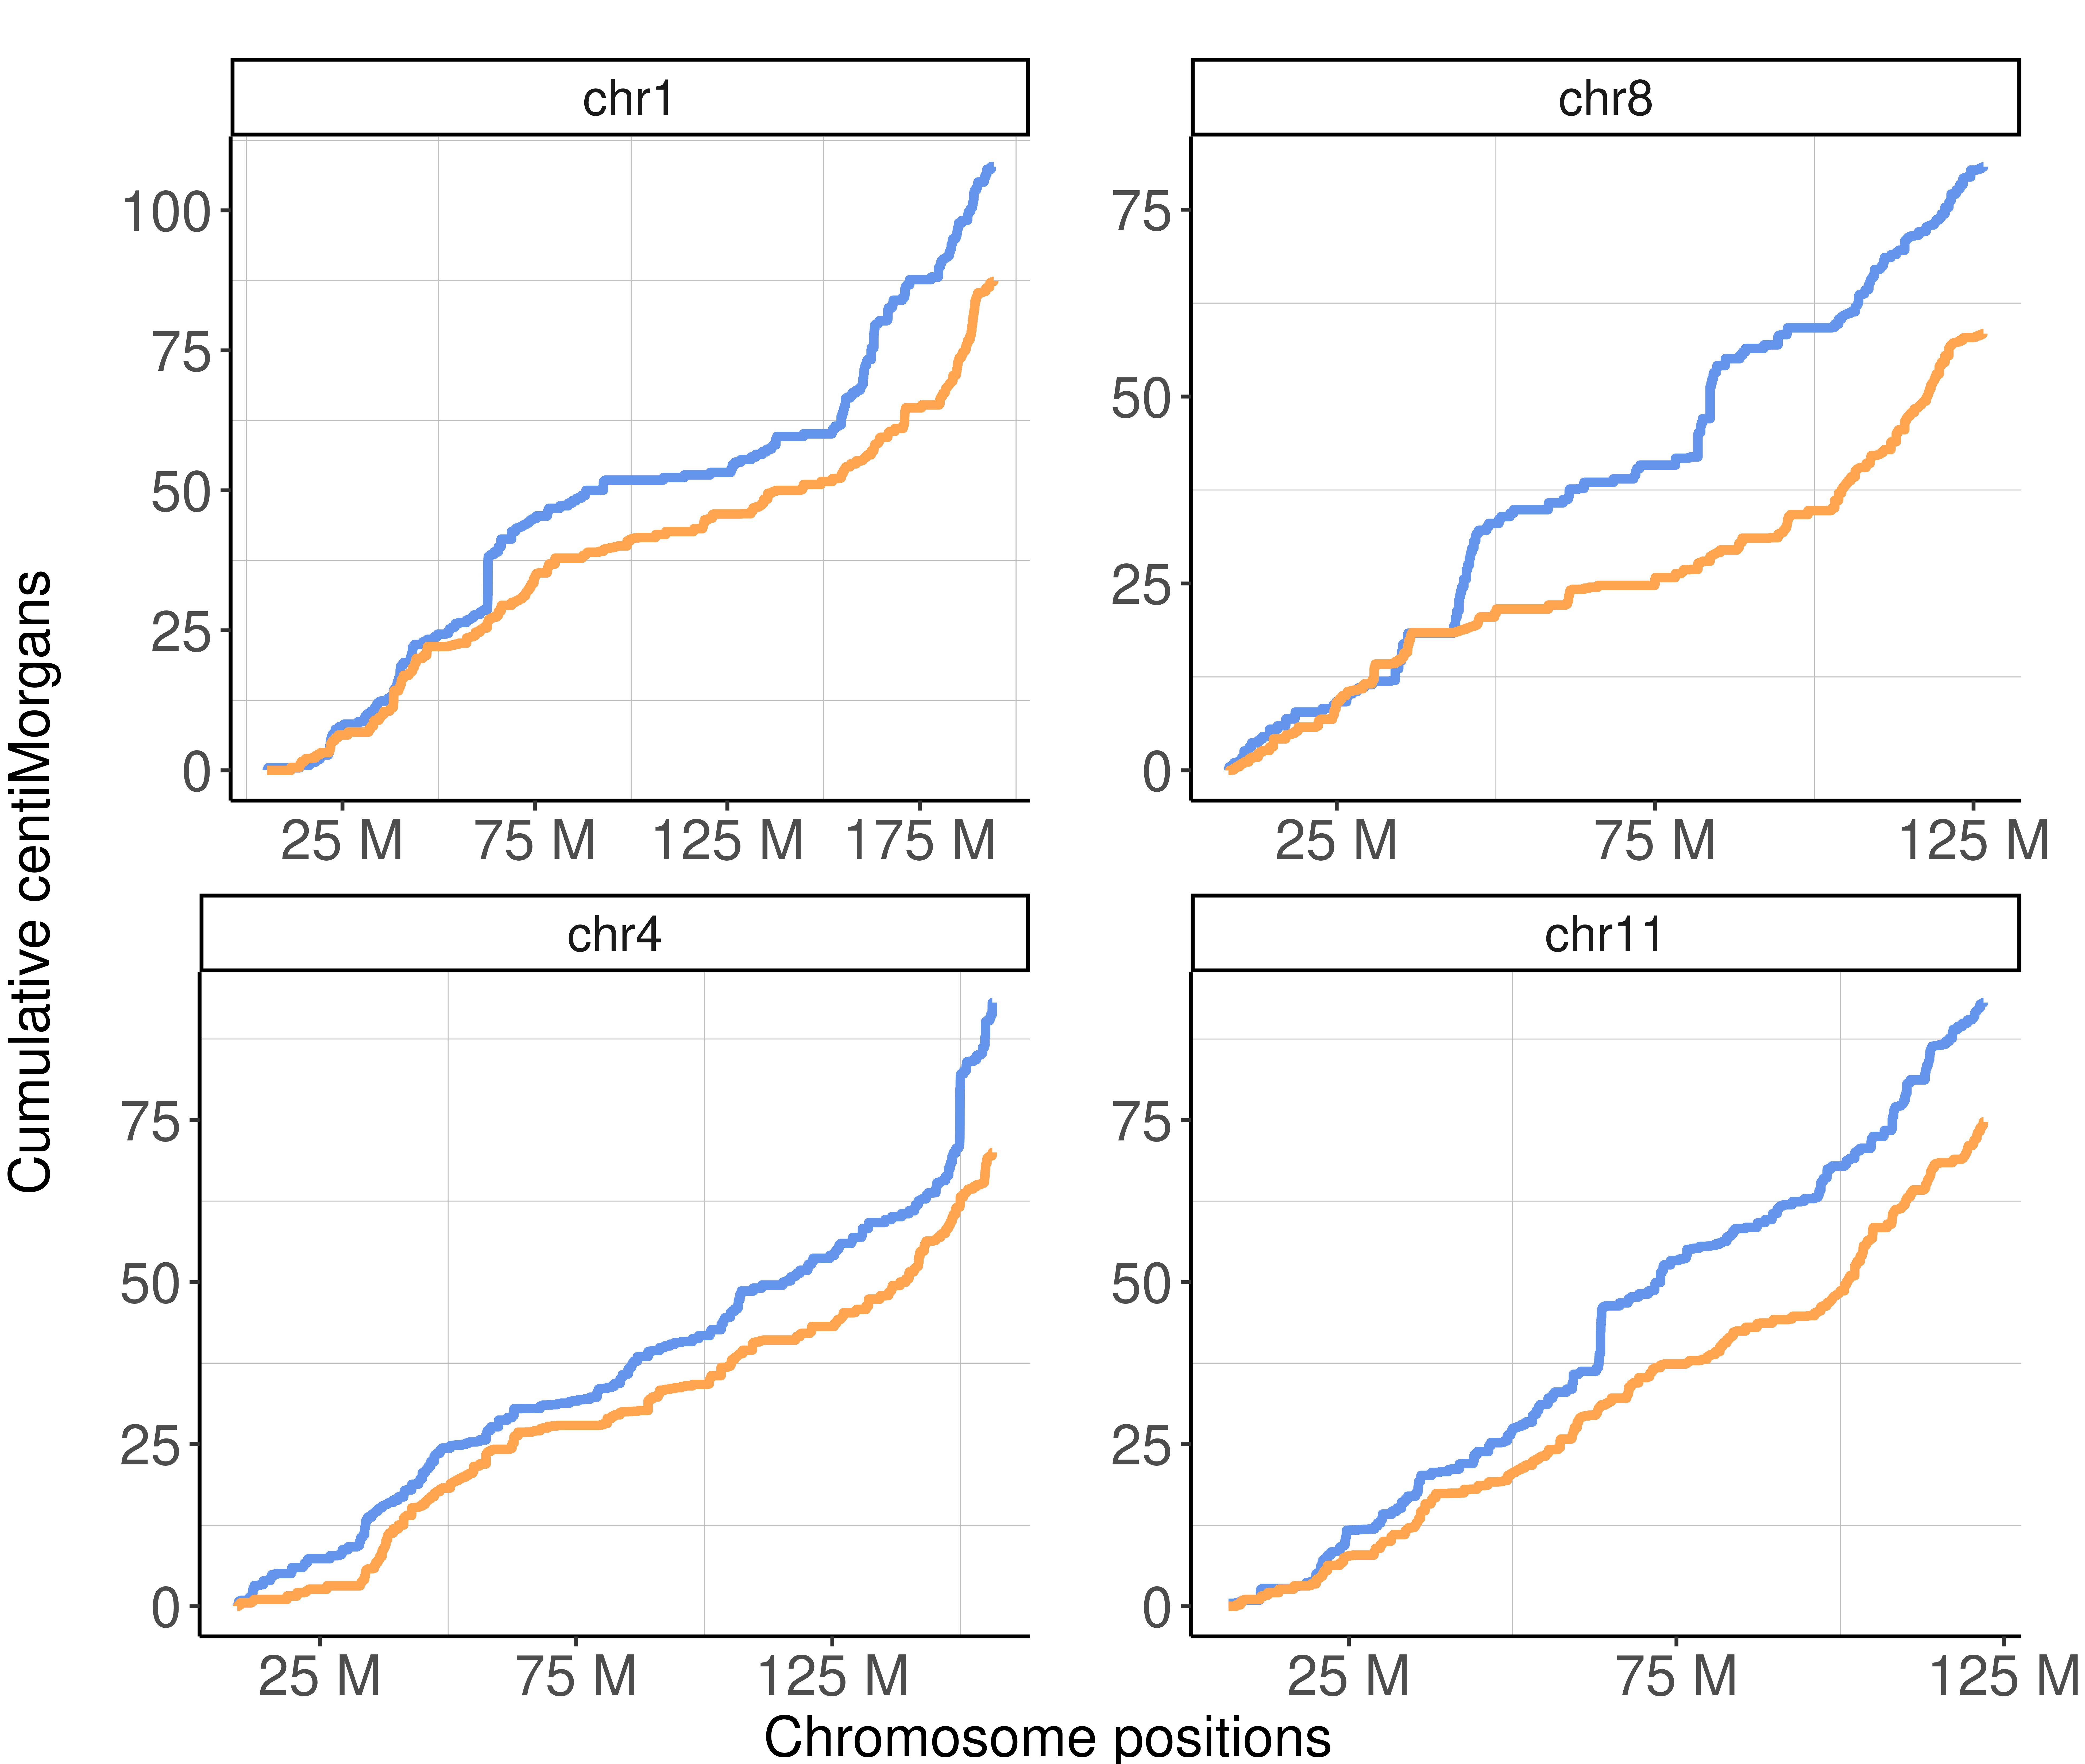
# savePNG(p_four_chrs_cum_dist, saveToFile = "output/outputR/analysisRDS/figures/four_chroms_cum_dist.png",
#         fig.width = 13,fig.height = 11)
scCNV whole genome cum dist plot
scCNV$sampleType <- plyr::mapvalues(scCNV$sampleGroup,
                                    from = c("WC_522",
                                             "WC_526",
                                             "WC_CNV_42",
                                             "WC_CNV_43",
                                             "WC_CNV_44",
                                             "WC_CNV_53"),
                                    to =x)

scCNV_dist_type <- calGeneticDist(scCNV,group_by = "sampleType")

scCNV_dist_gr <- rowRanges(scCNV_dist_type)
mcols(scCNV_dist_gr) <- scCNV_dist_gr$kosambi

# plotWholeGenome(scCNV_dist_gr)+theme_bw(base_size = 18)+
#   theme(legend.position = c(0.8, 0.27),
#        axis.text.x = element_text(angle = 90))+
#   scale_color_manual(labels = c("mutant"= "Fancm-/-", "wildtype"="Fancm+/+"),
#                      values = c("mutant" = "cornflowerblue",
#                                 "wildtype" = "tan1"))

p <- plotWholeGenomeCustmise(scCNV_dist_gr)+theme_bw(base_size = 18)+
  theme(legend.position = c(0.8, 0.27),
       axis.text.x = element_text(angle = 90))+
  scale_color_manual(labels = c("mutant"= "Fancm-/-", "wildtype"="Fancm+/+"),
                     values = c("mutant" = "cornflowerblue",
                                "wildtype" = "tan1"))

p_scCNV <- p  + guides(fill = "none")
p_scCNV
Warning: Use of `axisdf$end_chr` is discouraged. Use `end_chr` instead.
p_scCNV+
  guides(color = "none")+ggtitle("F1 single sperm sequencing")+
    theme(strip.text = element_blank(),
             panel.grid.minor.x = element_blank(),
             panel.grid.major = element_blank(),
          panel.grid.major.x = element_blank())
Warning: Use of `axisdf$end_chr` is discouraged. Use `end_chr` instead.
scCNV whole genome cum dist plot per individual
#scCNV_dist_individuals <- calGeneticDist(scCNV,group_by = "sampleGroup")

scCNV_dist_individuals_gr <- rowRanges(scCNV_dist_individuals)
mcols(scCNV_dist_individuals_gr) <- rowData(scCNV_dist_individuals)$kosambi


p <- plotWholeGenomeCustmise(scCNV_dist_individuals_gr)+theme_bw(base_size = 18)+
  theme(legend.position = c(0.8, 0.27),
       axis.text.x = element_text(angle = 90))+
  scale_color_manual(labels = c("WC_522"=  "Fancm-/-",
                                 "WC_526" =   "Fancm-/-",
                                "WC_CNV_42"="Fancm+/+",
                                "WC_CNV_43"=  "Fancm-/-",
                                "WC_CNV_44" ="Fancm+/+",
                                "WC_CNV_53"="Fancm+/+"),
                     values = c("WC_522"= "cornflowerblue",
                                 "WC_526" =  "cornflowerblue",
                                "WC_CNV_42"="tan1",
                                "WC_CNV_43"= "cornflowerblue",
                                "WC_CNV_44" ="tan1",
                                "WC_CNV_53"="tan1"))

  # theme(legend.background = element_blank(),
  #       legend.title = element_blank())+guides(color = "none")

p_scCNV_individual <- p + guides(color = "none",
                                 fill  = "none")+ggtitle("F1 single sperm sequencing")


  # facet_grid(.~seqnames,scales = "free_x")+theme(strip.text = element_blank(),
  #                                                   panel.border = element_rect(size=0.1, colour = "grey"),
  #                                                   panel.grid.minor = element_line(colour = "grey", size = 0.2),
  #                                                   panel.grid.major = element_blank())+

p_scCNV_individual +
  guides(color = "none")+ggtitle("F1 single sperm sequencing")+
    theme(strip.text = element_blank(),
             panel.grid.minor.x = element_blank(),
             panel.grid.major = element_blank(),
          panel.grid.major.x = element_blank())
Warning: Use of `axisdf$end_chr` is discouraged. Use `end_chr` instead.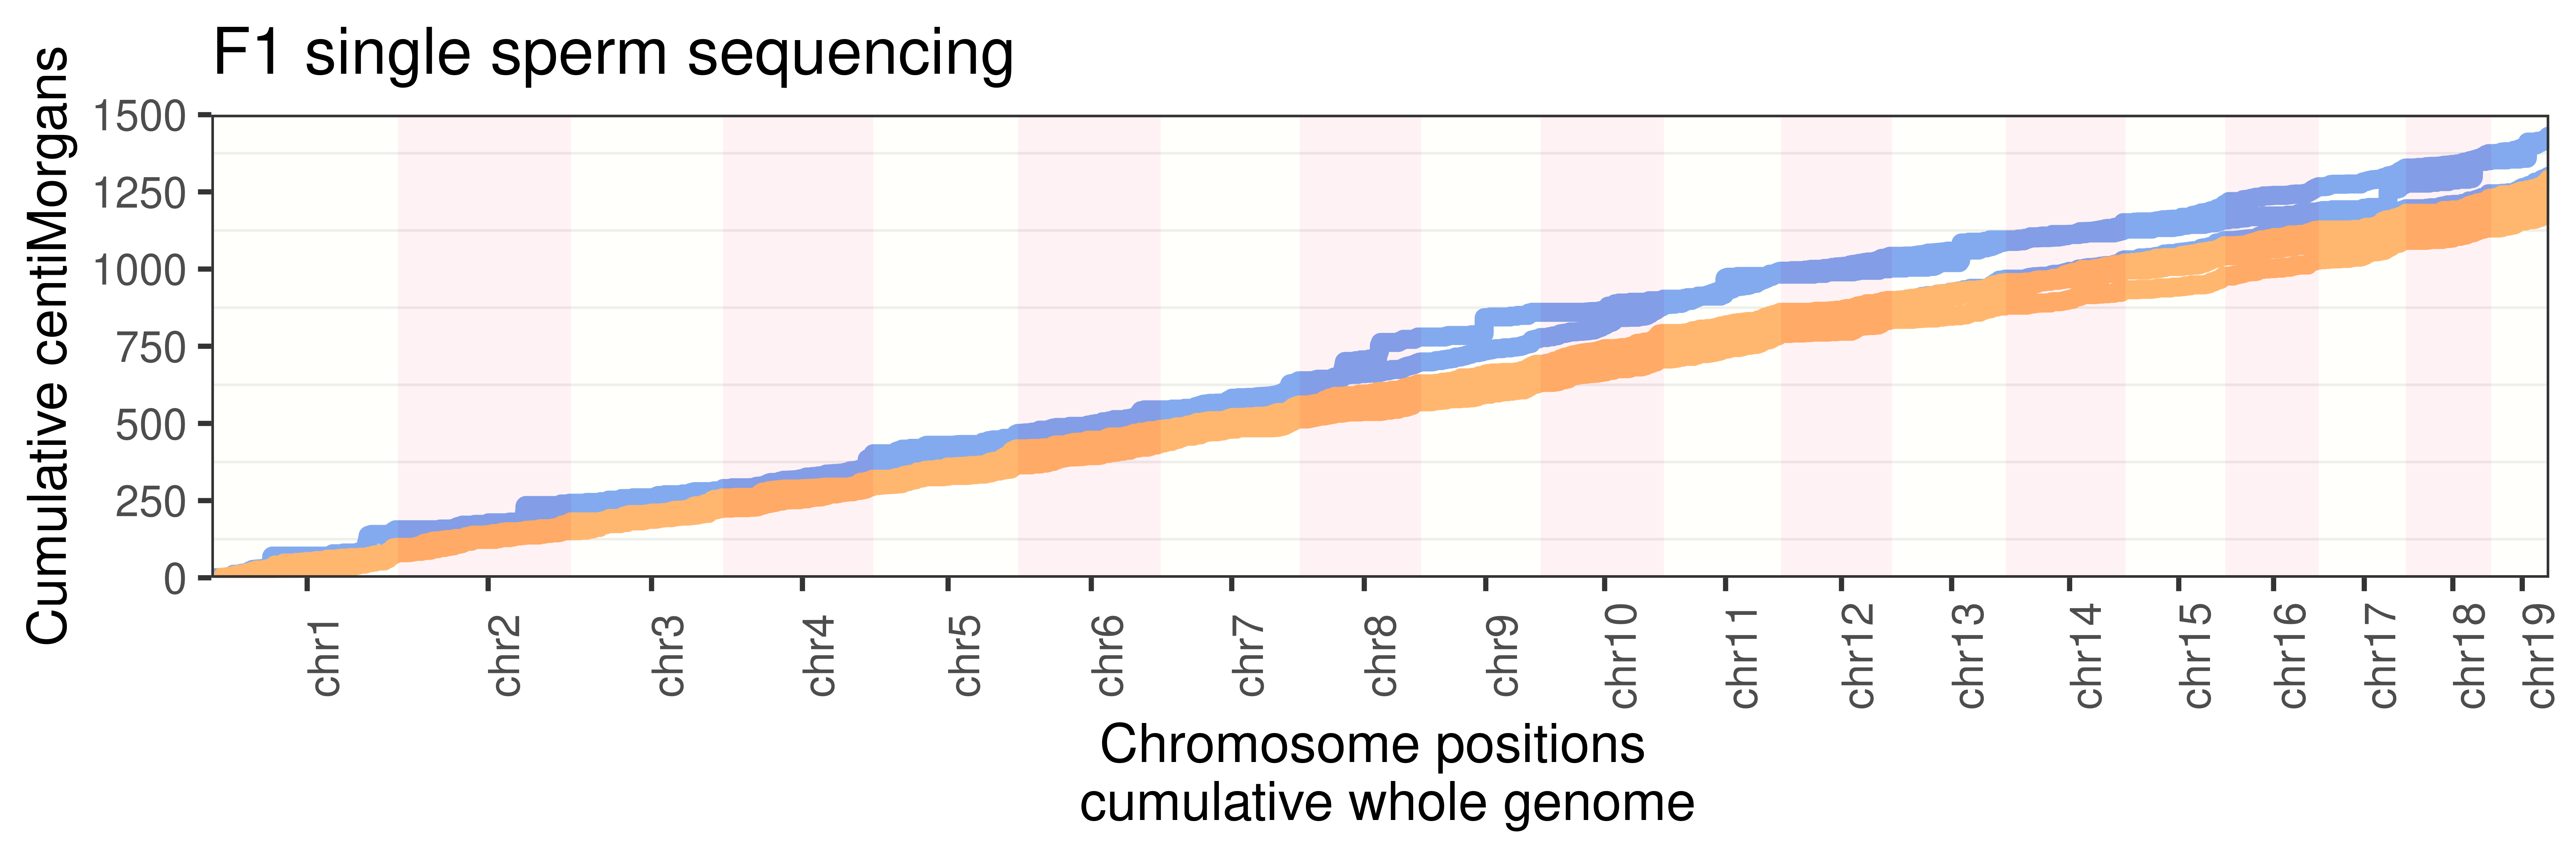
combining technologies multiple whole genome cum dist plot
#p_scCNV_individual
arg <- arrangeGrob(p_scCNV_individual+theme(axis.text.x = element_blank(),
                                axis.title.x = element_blank(),
                                axis.ticks.length.x = unit(0,"cm"),
                                strip.text = element_blank(),
      panel.grid.minor.x = element_blank(),
      panel.grid.major = element_blank(),
      panel.grid.major.x = element_blank(),
      axis.text.y =  element_text(size = 25))+
                     ylab("")+guides(color="none"),
            p_bulk_male+theme(axis.text.x = element_blank(),
                              axis.title.x = element_blank(),
                              axis.ticks.length.x = unit(0,"cm"),
                              strip.text = element_blank(),
      panel.grid.minor.x = element_blank(),
      panel.grid.major = element_blank(),
      panel.grid.major.x = element_blank(),
      axis.text.y =  element_text(size = 25))+
                     ylab(""),
            p_pcr+ylab("")+theme(axis.text.x = element_blank(),
                              axis.title.x = element_blank(),
                              axis.ticks.length.x = unit(0,"cm"),
                              strip.text = element_blank(),
      panel.grid.minor.x = element_blank(),
      panel.grid.major = element_blank(),
      panel.grid.major.x = element_blank(),
      axis.text.y =  element_text(size = 25))+xlab(""),
                              p_bulk_female+ylab("")+xlab("")+
        theme(strip.text = element_blank(),
      panel.grid.minor.x = element_blank(),
      panel.grid.major = element_blank(),
      panel.grid.major.x = element_blank(),
      axis.text.x = element_text(size = 25,angle = 90),
      axis.text.y =  element_text(size = 25))+guides(color="none")+
        ggtitle("BC1F1 bulk sequencing pups female"),nrow=4,
            layout_matrix = matrix(c(1,1,2,2,3,3,4,4,4),9,byrow = T))
Warning: Use of `axisdf$end_chr` is discouraged. Use `end_chr` instead.
Use of `axisdf$end_chr` is discouraged. Use `end_chr` instead.
Use of `axisdf$end_chr` is discouraged. Use `end_chr` instead.
Use of `axisdf$end_chr` is discouraged. Use `end_chr` instead.four_techniques_plot <- grid.arrange(arg,left = textGrob("Cumulative centiMorgans",rot = 90,
gp = gpar(fontsize=25)),
bottom = textGrob("Chromosome position \ncumulative whole genome",
gp = gpar(fontsize=25)),nrow=1,ncol=1)
#ggsave(filename = "output/outputR/analysisRDS/figures/combined_four_techniques_cum_dist_whole_genome.png", width = 12.5,height = 23, dpi = 300,plot = four_techniques_plot) gA <- ggplotGrob(p_scCNV+theme(axis.text.x = element_blank(),
axis.title.x = element_blank(),
axis.ticks.length.x = unit(0,"cm"),
strip.text = element_blank(),
panel.grid.minor.x = element_blank(),
panel.grid.major = element_blank(),
panel.grid.major.x = element_blank())+
ylab("")+guides(color="none"))Warning: Use of `axisdf$end_chr` is discouraged. Use `end_chr` instead. gB <- ggplotGrob( p_bulk_male+theme(axis.text.x = element_blank(),
axis.title.x = element_blank(),
axis.ticks.length.x = unit(0,"cm"),
strip.text = element_blank(),
panel.grid.minor.x = element_blank(),
panel.grid.major = element_blank(),
panel.grid.major.x = element_blank())+
ylab(""))Warning: Use of `axisdf$end_chr` is discouraged. Use `end_chr` instead. gC <- ggplotGrob( p_pcr+ylab("")+theme(axis.text.x = element_blank(),
axis.title.x = element_blank(),
axis.ticks.length.x = unit(0,"cm"),
strip.text = element_blank(),
panel.grid.minor.x = element_blank(),
panel.grid.major = element_blank(),
panel.grid.major.x = element_blank())+xlab("")
)Warning: Use of `axisdf$end_chr` is discouraged. Use `end_chr` instead. gD <- ggplotGrob( p_bulk_female+ylab("")+xlab("")+theme(strip.text = element_blank(),
panel.grid.minor.x = element_blank(),
panel.grid.major = element_blank(),
panel.grid.major.x = element_blank())+guides(color="none"))Warning: Use of `axisdf$end_chr` is discouraged. Use `end_chr` instead. grid::grid.newpage()
grid::grid.draw(rbind(gA, gB,gC,gD))
Genetic Dists in bins
The chromosomes are divided into equal interval bins and the centimorgans are calculated for each bin across two different genotypes.
scCNV by Fancm genotype bin_size = 1e6
scCNV_dist_bin <- calGeneticDist(scCNV,group_by = "sampleType",bin_size = 1e6)
#colSums(as.matrix(mcols(scCNV_dist_bin)))
chr_cums <- list()
for(chr in paste0("chr",which(padj<0.05))){
suppressMessages(
chr_cums[[chr]] <-
plotGeneticDist(scCNV_dist_bin,chr = chr)+
scale_color_manual("sampleType",
labels = c("mutant"= "Fancm-/-", "wildtype"="Fancm+/+"),
values = c("mutant" = "cornflowerblue",
"wildtype" = "tan1"))+guides(color="none")
)
}
mChrThresPlots <- marrangeGrob(chr_cums, nrow=2, ncol=2)
mChrThresPlots
scCNV by Fancm genotype bin_size = 1.5e6
scCNV_dist_bin <- calGeneticDist(scCNV,group_by = "sampleType",bin_size = 1.5e6)
#colSums(as.matrix(mcols(scCNV_dist_bin)))
chr_cums <- list()
for(chr in paste0("chr",which(padj<0.05)) ){
suppressMessages(
chr_cums[[chr]] <-
plotGeneticDist(scCNV_dist_bin,chr = chr)+
scale_color_manual("sampleType",
labels = c("mutant"= "Fancm-/-", "wildtype"="Fancm+/+"),
values = c("mutant" = "cornflowerblue",
"wildtype" = "tan1"))+guides(color="none")
)
}
arg_mchrs <- arrangeGrob(chr_cums[[1]]+theme(axis.title.x = element_blank(),plot.margin = margin(t=10,r=15)),
chr_cums[[2]]+theme(axis.title.x = element_blank(),plot.margin = margin(t=10,r=15)),
chr_cums[[3]]+theme(plot.margin = margin(t=10,r=15)),chr_cums[[4]]+theme(plot.margin = margin(t=10,r=15)))
grid.arrange(arg_mchrs,left = textGrob("CentiMorgans",rot = 90,gp = gpar(fontsize=18)),
bottom = textGrob("Chromosome positions",rot = 0,gp = gpar(fontsize=18)))
# mChrThresPlots <- marrangeGrob(chr_cums, nrow=2, ncol=2)
# mChrThresPlots
# scCNV_dist_type <- calGeneticDist(scCNV, group_by = "sampleType",bin_size = 1e7)
#
# Matrix::colSums(as.matrix(rowData(scCNV_dist_type)$kosambi))scCNV by Fancm genotype bin_size = 1e7
scCNV_dist_bin <- calGeneticDist(scCNV,group_by = "sampleType",bin_size = 1e7)
#colSums(as.matrix(mcols(scCNV_dist_bin)))
chr_cums <- list()
for(chr in paste0("chr",which(padj<0.05)) ){
suppressMessages(
chr_cums[[chr]] <-
plotGeneticDist(scCNV_dist_bin,chr = chr)+
scale_color_manual("sampleType",
labels = c("mutant"= "Fancm-/-", "wildtype"="Fancm+/+"),
values = c("mutant" = "cornflowerblue",
"wildtype" = "tan1"))+guides(color="none")
)
}
arg_mchrs <- arrangeGrob(chr_cums[[1]]+theme(axis.title.x = element_blank(),plot.margin = margin(t=10,r=15)),
chr_cums[[2]]+theme(axis.title.x = element_blank(),plot.margin = margin(t=10,r=15)),
chr_cums[[3]]+theme(plot.margin = margin(t=10,r=15)),chr_cums[[4]]+theme(plot.margin = margin(t=10,r=15)))
grid.arrange(arg_mchrs,left = textGrob("CentiMorgans",rot = 90,gp = gpar(fontsize=18)),
bottom = textGrob("Chromosome positions",rot = 0,gp = gpar(fontsize=18)))
#
#
#
# mChrThresPlots <- marrangeGrob(chr_cums, nrow=2, ncol=2)
# mChrThresPlots
Genetic distances table
PCR
t1_pcr <- sapply(1:19, function(chr) {
  dist <- colSums(as.matrix(mcols(map_gr[seqnames(map_gr)==chr,])))
 # dist["chr"] <- chr
  dist
})
colnames(t1_pcr) <- paste0("chr",1:19)
rownames(t1_pcr) <- c("Fancm-/-","Fancm+/+")
t1_pcr
chr1 chr2 chr3 chr4 chr5 chr6 chr7
Fancm-/- 78.17209 66.95920 110.91479 93.52093 97.53044 76.07560 59.16513
Fancm+/+ 81.24986 58.87024 65.38985 73.49226 77.94563 49.32866 57.00817
chr8 chr9 chr10 chr11 chr12 chr13 chr14
Fancm-/- 65.84446 92.89555 51.55517 148.58259 16.22262 89.80608 53.11265
Fancm+/+ 82.48113 36.17814 58.32158 79.04444 44.96136 52.23258 40.48861
chr15 chr16 chr17 chr18 chr19
Fancm-/- 46.30988 44.08719 42.43888 23.00274 48.50897
Fancm+/+ 28.15495 45.12102 20.09503 24.15580 55.95827#all_rse_pcr_cosscCNV
t1_sccnv <- sapply(paste0("chr",1:19), function(chr) {
  dist <- colSums(as.matrix(mcols(scCNV_dist_bin[seqnames(scCNV_dist_bin)==chr,])))
 # dist["chr"] <- chr
  dist
})
rownames(t1_sccnv) <- c("Fancm-/-","Fancm+/+")
t1_sccnv
chr1 chr2 chr3 chr4 chr5 chr6 chr7
Fancm-/- 107.80598 93.59202 72.93902 93.12266 86.24212 72.04042 83.51491
Fancm+/+ 87.37041 78.94974 74.21340 70.00300 84.21419 69.47621 76.84526
chr8 chr9 chr10 chr11 chr12 chr13 chr14
Fancm-/- 80.75262 75.69026 83.03375 93.12872 48.16673 61.49800 56.42358
Fancm+/+ 58.42309 64.21199 85.79306 74.73905 48.94852 49.47543 57.37268
chr15 chr16 chr17 chr18 chr19
Fancm-/- 55.04906 51.37768 61.94204 52.29862 58.71759
Fancm+/+ 48.42305 49.47523 55.26496 42.63267 51.58030BC1F1 samples
male
sapply(paste0("chr",1:19), function(chr) {
  dist <- colSums(as.matrix(mcols(bc1f1_samples_dist_male_bin_dist[seqnames(bc1f1_samples_dist_male_bin_dist)==chr,])))
 # dist["chr"] <- chr
  dist
})
chr1 chr2 chr3 chr4 chr5 chr6 chr7
Male_KO 87.77352 85.74231 83.69656 90.83609 87.77856 64.29666 83.69265
Male_WT 82.55132 92.55274 72.54940 65.03859 80.04576 80.04557 80.03903
Male_HET 97.17216 76.53878 55.97231 79.49844 88.30408 70.66131 61.82648
chr8 chr9 chr10 chr11 chr12 chr13 chr14 chr15
Male_KO 58.18421 73.48336 75.52333 89.81371 46.94506 62.26097 73.4930 52.05323
Male_WT 75.04804 67.53984 92.54895 77.54540 50.04132 57.58778 50.0274 50.02620
Male_HET 58.88419 61.81651 67.68657 82.42322 58.88113 61.81708 61.8097 44.15495
chr16 chr17 chr18 chr19
Male_KO 53.06954 58.17386 58.17511 54.08988
Male_WT 50.02141 45.03066 42.52230 45.02436
Male_HET 61.81904 58.87484 47.10083 47.09397Female
sapply(paste0("chr",1:19), function(chr) {
  dist <- colSums(as.matrix(mcols(bc1f1_samples_dist_female[seqnames(bc1f1_samples_dist_female)==chr,])))
 # dist["chr"] <- chr
  dist
})
chr1 chr2 chr3 chr4 chr5 chr6 chr7
Female_KO 105.01450 102.01711 78.01680 89.01120 100.03672 77.01632 90.01669
Female_WT 100.05220 116.06152 84.03422 76.03133 74.02449 90.05942 84.03652
Female_HET 94.03816 74.02091 68.02556 94.03857 98.03924 86.03962 80.03340
chr8 chr9 chr10 chr11 chr12 chr13 chr14
Female_KO 72.01486 64.00863 79.00885 79.01343 61.00808 68.02011 73.01410
Female_WT 68.03246 84.03535 72.03196 82.03513 72.03391 68.02599 76.03834
Female_HET 68.02770 74.03639 68.03076 74.03383 62.03666 66.03645 62.03810
chr15 chr16 chr17 chr18 chr19
Female_KO 61.00954 60.01302 66.01205 57.01247 57.00769
Female_WT 54.02489 54.02378 48.01670 38.01803 66.02841
Female_HET 60.02299 62.02625 54.01740 72.06183 48.02039scCNV_chr_co_count <- sapply(paste0("chr",1:19), function(chr) {
co_count <- colSums(as.matrix(assay(scCNV[seqnames(rowRanges(scCNV))==chr,])))
# dist["chr"] <- chr
co_count
})
bc1f1_chr_co_count <- sapply(paste0("chr",1:19), function(chr) {
co_count <- colSums(as.matrix(assay(bc1f1_samples[seqnames(rowRanges(bc1f1_samples))==chr,])))
# dist["chr"] <- chr
co_count
})
scCNV_chr_co_count <- data.frame(scCNV_chr_co_count)
scCNV_chr_co_count$assay <- "scCNV"
bc1f1_chr_co_count <- data.frame(bc1f1_chr_co_count)
bc1f1_chr_co_count$assay <- "BC1F1"
scCNV_chr_co_count$sampleType <- plyr::mapvalues(rownames(scCNV_chr_co_count),
from = scCNV$barcodes,
to = scCNV$sampleType )
bc1f1_chr_co_count$sampleType <- plyr::mapvalues(rownames(bc1f1_chr_co_count),
from = bc1f1_samples$Sid,
to = bc1f1_samples$sampleGroup)
combine_co_count <- rbind(scCNV_chr_co_count, bc1f1_chr_co_count)
combine_co_count$sampleName <- rownames(combine_co_count)
combine_co_count$sampleType <- plyr::mapvalues(combine_co_count$sampleType,
from = c("mutant","wildtype","Male_KO","Female_KO","Female_WT","Female_HET", "Male_WT","Male_HET"),
to = c("single sperm KO","single sperm WT","Male_KO","Female_KO","Female_WT","Female_HET", "Male_WT","Male_HET"))combine_co_count %>% tidyr::pivot_longer(1:19, names_to = "chrom", values_to = "crossover_number") %>%
group_by(sampleName,assay,sampleType) %>% summarise(sample_crossover = sum(crossover_number) ) %>%
mutate(sampleType = factor(sampleType, levels = c("Female_WT","Male_WT","Female_HET","Male_HET","Female_KO",
"Male_KO","single sperm KO","single sperm WT"))) %>%
ggplot(mapping = aes(x = sampleType, y = sample_crossover,
color = sampleType))+geom_boxplot()+geom_jitter()+theme_bw(base_size = 22)+scale_color_manual("sampleType",
values = c("single sperm KO" = "#2b2d42",
"single sperm WT" = "#d90429",
"Male_KO" = "#8d99ae",
"Male_WT" = "#e75466",
"Male_HET" = "#76797a",
"Female_WT" = "#D72630",
"Female_KO" = "#D7D52A",
"Female_HET" = "#F28A17"))`summarise()` has grouped output by 'sampleName', 'assay'. You can override
using the `.groups` argument.
Sessioninfo
sessionInfo()R version 4.1.2 (2021-11-01)
Platform: x86_64-pc-linux-gnu (64-bit)
Running under: Rocky Linux 8.5 (Green Obsidian)
Matrix products: default
BLAS/LAPACK: /usr/lib64/libopenblasp-r0.3.12.so
locale:
[1] LC_CTYPE=en_AU.UTF-8 LC_NUMERIC=C
[3] LC_TIME=en_AU.UTF-8 LC_COLLATE=en_AU.UTF-8
[5] LC_MONETARY=en_AU.UTF-8 LC_MESSAGES=en_AU.UTF-8
[7] LC_PAPER=en_AU.UTF-8 LC_NAME=C
[9] LC_ADDRESS=C LC_TELEPHONE=C
[11] LC_MEASUREMENT=en_AU.UTF-8 LC_IDENTIFICATION=C
attached base packages:
[1] grid stats4 stats graphics grDevices utils datasets
[8] methods base
other attached packages:
[1] dplyr_1.0.7 tidyr_1.2.0
[3] statmod_1.4.36 BiocParallel_1.28.3
[5] gridExtra_2.3 SummarizedExperiment_1.24.0
[7] Biobase_2.54.0 GenomicRanges_1.46.1
[9] GenomeInfoDb_1.30.1 IRanges_2.28.0
[11] S4Vectors_0.32.3 BiocGenerics_0.40.0
[13] MatrixGenerics_1.6.0 matrixStats_0.61.0
[15] ggplot2_3.3.5 comapr_0.99.43
[17] readxl_1.3.1
loaded via a namespace (and not attached):
[1] backports_1.4.1 circlize_0.4.13 Hmisc_4.6-0
[4] workflowr_1.7.0 BiocFileCache_2.2.1 plyr_1.8.6
[7] lazyeval_0.2.2 splines_4.1.2 digest_0.6.29
[10] foreach_1.5.2 ensembldb_2.18.3 htmltools_0.5.2
[13] fansi_1.0.2 magrittr_2.0.2 checkmate_2.0.0
[16] memoise_2.0.1 BSgenome_1.62.0 cluster_2.1.2
[19] Biostrings_2.62.0 prettyunits_1.1.1 jpeg_0.1-9
[22] colorspace_2.0-2 blob_1.2.2 rappdirs_0.3.3
[25] xfun_0.29 crayon_1.4.2 RCurl_1.98-1.5
[28] jsonlite_1.7.3 survival_3.2-13 VariantAnnotation_1.40.0
[31] iterators_1.0.14 glue_1.6.1 gtable_0.3.0
[34] zlibbioc_1.40.0 XVector_0.34.0 DelayedArray_0.20.0
[37] shape_1.4.6 scales_1.1.1 DBI_1.1.2
[40] Rcpp_1.0.8 viridisLite_0.4.0 progress_1.2.2
[43] htmlTable_2.4.0 foreign_0.8-81 bit_4.0.4
[46] Formula_1.2-4 htmlwidgets_1.5.4 httr_1.4.2
[49] RColorBrewer_1.1-2 ellipsis_0.3.2 farver_2.1.0
[52] pkgconfig_2.0.3 XML_3.99-0.8 Gviz_1.38.3
[55] nnet_7.3-16 dbplyr_2.1.1 utf8_1.2.2
[58] tidyselect_1.1.1 labeling_0.4.2 rlang_1.0.0
[61] reshape2_1.4.4 later_1.3.0 AnnotationDbi_1.56.2
[64] munsell_0.5.0 cellranger_1.1.0 tools_4.1.2
[67] cachem_1.0.6 cli_3.1.1 generics_0.1.1
[70] RSQLite_2.2.9 evaluate_0.14 stringr_1.4.0
[73] fastmap_1.1.0 yaml_2.2.2 knitr_1.37
[76] bit64_4.0.5 fs_1.5.2 purrr_0.3.4
[79] KEGGREST_1.34.0 AnnotationFilter_1.18.0 xml2_1.3.3
[82] biomaRt_2.50.3 compiler_4.1.2 rstudioapi_0.13
[85] plotly_4.10.0 filelock_1.0.2 curl_4.3.2
[88] png_0.1-7 tibble_3.1.6 stringi_1.7.6
[91] highr_0.9 GenomicFeatures_1.46.4 lattice_0.20-45
[94] ProtGenerics_1.26.0 Matrix_1.4-0 vctrs_0.3.8
[97] pillar_1.6.5 lifecycle_1.0.1 jquerylib_0.1.4
[100] GlobalOptions_0.1.2 data.table_1.14.2 bitops_1.0-7
[103] httpuv_1.6.5 rtracklayer_1.54.0 R6_2.5.1
[106] BiocIO_1.4.0 latticeExtra_0.6-29 promises_1.2.0.1
[109] codetools_0.2-18 dichromat_2.0-0 assertthat_0.2.1
[112] rprojroot_2.0.2 rjson_0.2.21 withr_2.4.3
[115] GenomicAlignments_1.30.0 Rsamtools_2.10.0 GenomeInfoDbData_1.2.7
[118] parallel_4.1.2 hms_1.1.1 rpart_4.1-15
[121] rmarkdown_2.11 git2r_0.29.0 biovizBase_1.42.0
[124] base64enc_0.1-3 restfulr_0.0.13
devtools::session_info()─ Session info ───────────────────────────────────────────────────────────────
setting value
version R version 4.1.2 (2021-11-01)
os Rocky Linux 8.5 (Green Obsidian)
system x86_64, linux-gnu
ui X11
language (EN)
collate en_AU.UTF-8
ctype en_AU.UTF-8
tz Australia/Melbourne
date 2022-03-14
pandoc 2.11.4 @ /usr/lib/rstudio-server/bin/pandoc/ (via rmarkdown)
─ Packages ───────────────────────────────────────────────────────────────────
package * version date (UTC) lib source
AnnotationDbi 1.56.2 2021-11-09 [1] Bioconductor
AnnotationFilter 1.18.0 2021-10-26 [1] Bioconductor
assertthat 0.2.1 2019-03-21 [1] CRAN (R 4.1.2)
backports 1.4.1 2021-12-13 [1] CRAN (R 4.1.2)
base64enc 0.1-3 2015-07-28 [1] CRAN (R 4.1.2)
Biobase * 2.54.0 2021-10-26 [1] Bioconductor
BiocFileCache 2.2.1 2022-01-23 [1] Bioconductor
BiocGenerics * 0.40.0 2021-10-26 [1] Bioconductor
BiocIO 1.4.0 2021-10-26 [1] Bioconductor
BiocParallel * 1.28.3 2021-12-09 [1] Bioconductor
biomaRt 2.50.3 2022-02-03 [1] Bioconductor
Biostrings 2.62.0 2021-10-26 [1] Bioconductor
biovizBase 1.42.0 2021-10-26 [1] Bioconductor
bit 4.0.4 2020-08-04 [1] CRAN (R 4.1.2)
bit64 4.0.5 2020-08-30 [1] CRAN (R 4.1.2)
bitops 1.0-7 2021-04-24 [1] CRAN (R 4.1.2)
blob 1.2.2 2021-07-23 [1] CRAN (R 4.1.2)
brio 1.1.3 2021-11-30 [1] CRAN (R 4.1.0)
BSgenome 1.62.0 2021-10-26 [1] Bioconductor
cachem 1.0.6 2021-08-19 [1] CRAN (R 4.1.0)
callr 3.7.0 2021-04-20 [1] CRAN (R 4.1.2)
cellranger 1.1.0 2016-07-27 [1] CRAN (R 4.1.2)
checkmate 2.0.0 2020-02-06 [1] CRAN (R 4.1.0)
circlize 0.4.13 2021-06-09 [1] CRAN (R 4.1.0)
cli 3.1.1 2022-01-20 [1] CRAN (R 4.1.2)
cluster 2.1.2 2021-04-17 [2] CRAN (R 4.1.2)
codetools 0.2-18 2020-11-04 [2] CRAN (R 4.1.2)
colorspace 2.0-2 2021-06-24 [1] CRAN (R 4.1.2)
comapr * 0.99.43 2022-03-09 [1] Github (ruqianl/comapr@915d97c)
crayon 1.4.2 2021-10-29 [1] CRAN (R 4.1.2)
curl 4.3.2 2021-06-23 [1] CRAN (R 4.1.2)
data.table 1.14.2 2021-09-27 [1] CRAN (R 4.1.2)
DBI 1.1.2 2021-12-20 [1] CRAN (R 4.1.2)
dbplyr 2.1.1 2021-04-06 [1] CRAN (R 4.1.2)
DelayedArray 0.20.0 2021-10-26 [1] Bioconductor
desc 1.4.0 2021-09-28 [1] CRAN (R 4.1.0)
devtools 2.4.3 2021-11-30 [1] CRAN (R 4.1.0)
dichromat 2.0-0 2013-01-24 [1] CRAN (R 4.1.0)
digest 0.6.29 2021-12-01 [1] CRAN (R 4.1.2)
dplyr * 1.0.7 2021-06-18 [1] CRAN (R 4.1.2)
ellipsis 0.3.2 2021-04-29 [1] CRAN (R 4.1.2)
ensembldb 2.18.3 2022-01-13 [1] Bioconductor
evaluate 0.14 2019-05-28 [1] CRAN (R 4.1.2)
fansi 1.0.2 2022-01-14 [1] CRAN (R 4.1.2)
farver 2.1.0 2021-02-28 [1] CRAN (R 4.1.2)
fastmap 1.1.0 2021-01-25 [1] CRAN (R 4.1.2)
filelock 1.0.2 2018-10-05 [1] CRAN (R 4.1.0)
foreach 1.5.2 2022-02-02 [1] CRAN (R 4.1.0)
foreign 0.8-81 2020-12-22 [2] CRAN (R 4.1.2)
Formula 1.2-4 2020-10-16 [1] CRAN (R 4.1.0)
fs 1.5.2 2021-12-08 [1] CRAN (R 4.1.2)
generics 0.1.1 2021-10-25 [1] CRAN (R 4.1.2)
GenomeInfoDb * 1.30.1 2022-01-30 [1] Bioconductor
GenomeInfoDbData 1.2.7 2022-01-28 [1] Bioconductor
GenomicAlignments 1.30.0 2021-10-26 [1] Bioconductor
GenomicFeatures 1.46.4 2022-01-20 [1] Bioconductor
GenomicRanges * 1.46.1 2021-11-18 [1] Bioconductor
ggplot2 * 3.3.5 2021-06-25 [1] CRAN (R 4.1.2)
git2r 0.29.0 2021-11-22 [1] CRAN (R 4.1.2)
GlobalOptions 0.1.2 2020-06-10 [1] CRAN (R 4.1.0)
glue 1.6.1 2022-01-22 [1] CRAN (R 4.1.2)
gridExtra * 2.3 2017-09-09 [1] CRAN (R 4.1.0)
gtable 0.3.0 2019-03-25 [1] CRAN (R 4.1.2)
Gviz 1.38.3 2022-01-23 [1] Bioconductor
highr 0.9 2021-04-16 [1] CRAN (R 4.1.2)
Hmisc 4.6-0 2021-10-07 [1] CRAN (R 4.1.0)
hms 1.1.1 2021-09-26 [1] CRAN (R 4.1.2)
htmlTable 2.4.0 2022-01-04 [1] CRAN (R 4.1.0)
htmltools 0.5.2 2021-08-25 [1] CRAN (R 4.1.2)
htmlwidgets 1.5.4 2021-09-08 [1] CRAN (R 4.1.0)
httpuv 1.6.5 2022-01-05 [1] CRAN (R 4.1.2)
httr 1.4.2 2020-07-20 [1] CRAN (R 4.1.2)
IRanges * 2.28.0 2021-10-26 [1] Bioconductor
iterators 1.0.14 2022-02-05 [1] CRAN (R 4.1.0)
jpeg 0.1-9 2021-07-24 [1] CRAN (R 4.1.0)
jquerylib 0.1.4 2021-04-26 [1] CRAN (R 4.1.2)
jsonlite 1.7.3 2022-01-17 [1] CRAN (R 4.1.2)
KEGGREST 1.34.0 2021-10-26 [1] Bioconductor
knitr 1.37 2021-12-16 [1] CRAN (R 4.1.0)
labeling 0.4.2 2020-10-20 [1] CRAN (R 4.1.2)
later 1.3.0 2021-08-18 [1] CRAN (R 4.1.0)
lattice 0.20-45 2021-09-22 [2] CRAN (R 4.1.2)
latticeExtra 0.6-29 2019-12-19 [1] CRAN (R 4.1.0)
lazyeval 0.2.2 2019-03-15 [1] CRAN (R 4.1.0)
lifecycle 1.0.1 2021-09-24 [1] CRAN (R 4.1.2)
magrittr 2.0.2 2022-01-26 [1] CRAN (R 4.1.2)
Matrix 1.4-0 2021-12-08 [1] CRAN (R 4.1.2)
MatrixGenerics * 1.6.0 2021-10-26 [1] Bioconductor
matrixStats * 0.61.0 2021-09-17 [1] CRAN (R 4.1.2)
memoise 2.0.1 2021-11-26 [1] CRAN (R 4.1.0)
munsell 0.5.0 2018-06-12 [1] CRAN (R 4.1.2)
nnet 7.3-16 2021-05-03 [2] CRAN (R 4.1.2)
pillar 1.6.5 2022-01-25 [1] CRAN (R 4.1.2)
pkgbuild 1.3.1 2021-12-20 [1] CRAN (R 4.1.0)
pkgconfig 2.0.3 2019-09-22 [1] CRAN (R 4.1.2)
pkgload 1.2.4 2021-11-30 [1] CRAN (R 4.1.0)
plotly 4.10.0 2021-10-09 [1] CRAN (R 4.1.0)
plyr 1.8.6 2020-03-03 [1] CRAN (R 4.1.0)
png 0.1-7 2013-12-03 [1] CRAN (R 4.1.0)
prettyunits 1.1.1 2020-01-24 [1] CRAN (R 4.1.2)
processx 3.5.2 2021-04-30 [1] CRAN (R 4.1.2)
progress 1.2.2 2019-05-16 [1] CRAN (R 4.1.2)
promises 1.2.0.1 2021-02-11 [1] CRAN (R 4.1.0)
ProtGenerics 1.26.0 2021-10-26 [1] Bioconductor
ps 1.6.0 2021-02-28 [1] CRAN (R 4.1.2)
purrr 0.3.4 2020-04-17 [1] CRAN (R 4.1.2)
R6 2.5.1 2021-08-19 [1] CRAN (R 4.1.2)
rappdirs 0.3.3 2021-01-31 [1] CRAN (R 4.1.2)
RColorBrewer 1.1-2 2014-12-07 [1] CRAN (R 4.1.2)
Rcpp 1.0.8 2022-01-13 [1] CRAN (R 4.1.2)
RCurl 1.98-1.5 2021-09-17 [1] CRAN (R 4.1.0)
readxl * 1.3.1 2019-03-13 [1] CRAN (R 4.1.2)
remotes 2.4.2 2021-11-30 [1] CRAN (R 4.1.0)
reshape2 1.4.4 2020-04-09 [1] CRAN (R 4.1.0)
restfulr 0.0.13 2017-08-06 [1] CRAN (R 4.1.0)
rjson 0.2.21 2022-01-09 [1] CRAN (R 4.1.0)
rlang 1.0.0 2022-01-26 [1] CRAN (R 4.1.2)
rmarkdown 2.11 2021-09-14 [1] CRAN (R 4.1.2)
rpart 4.1-15 2019-04-12 [2] CRAN (R 4.1.2)
rprojroot 2.0.2 2020-11-15 [1] CRAN (R 4.1.0)
Rsamtools 2.10.0 2021-10-26 [1] Bioconductor
RSQLite 2.2.9 2021-12-06 [1] CRAN (R 4.1.0)
rstudioapi 0.13 2020-11-12 [1] CRAN (R 4.1.2)
rtracklayer 1.54.0 2021-10-26 [1] Bioconductor
S4Vectors * 0.32.3 2021-11-21 [1] Bioconductor
scales 1.1.1 2020-05-11 [1] CRAN (R 4.1.2)
sessioninfo 1.2.2 2021-12-06 [1] CRAN (R 4.1.0)
shape 1.4.6 2021-05-19 [1] CRAN (R 4.1.0)
statmod * 1.4.36 2021-05-10 [1] CRAN (R 4.1.2)
stringi 1.7.6 2021-11-29 [1] CRAN (R 4.1.0)
stringr 1.4.0 2019-02-10 [1] CRAN (R 4.1.0)
SummarizedExperiment * 1.24.0 2021-10-26 [1] Bioconductor
survival 3.2-13 2021-08-24 [2] CRAN (R 4.1.2)
testthat 3.1.2 2022-01-20 [1] CRAN (R 4.1.0)
tibble 3.1.6 2021-11-07 [1] CRAN (R 4.1.2)
tidyr * 1.2.0 2022-02-01 [1] CRAN (R 4.1.0)
tidyselect 1.1.1 2021-04-30 [1] CRAN (R 4.1.2)
usethis 2.1.5 2021-12-09 [1] CRAN (R 4.1.0)
utf8 1.2.2 2021-07-24 [1] CRAN (R 4.1.2)
VariantAnnotation 1.40.0 2021-10-26 [1] Bioconductor
vctrs 0.3.8 2021-04-29 [1] CRAN (R 4.1.2)
viridisLite 0.4.0 2021-04-13 [1] CRAN (R 4.1.2)
withr 2.4.3 2021-11-30 [1] CRAN (R 4.1.2)
workflowr 1.7.0 2021-12-21 [1] CRAN (R 4.1.2)
xfun 0.29 2021-12-14 [1] CRAN (R 4.1.2)
XML 3.99-0.8 2021-09-17 [1] CRAN (R 4.1.0)
xml2 1.3.3 2021-11-30 [1] CRAN (R 4.1.0)
XVector 0.34.0 2021-10-26 [1] Bioconductor
yaml 2.2.2 2022-01-25 [1] CRAN (R 4.1.2)
zlibbioc 1.40.0 2021-10-26 [1] Bioconductor
[1] /mnt/beegfs/mccarthy/backed_up/general/rlyu/Software/Rlibs/4.1
[2] /opt/R/4.1.2/lib/R/library
──────────────────────────────────────────────────────────────────────────────