Pilot3: Cell QC
Christina B. Azodi & Davis J. McCarthy
2022-03-30
Last updated: 2022-03-30
Checks: 5 2
Knit directory: BAUH_2020_MND-single-cell/analysis/
This reproducible R Markdown analysis was created with workflowr (version 1.6.2). The Checks tab describes the reproducibility checks that were applied when the results were created. The Past versions tab lists the development history.
The R Markdown file has unstaged changes. To know which version of the R Markdown file created these results, you’ll want to first commit it to the Git repo. If you’re still working on the analysis, you can ignore this warning. When you’re finished, you can run wflow_publish to commit the R Markdown file and build the HTML.
Great job! The global environment was empty. Objects defined in the global environment can affect the analysis in your R Markdown file in unknown ways. For reproduciblity it’s best to always run the code in an empty environment.
The command set.seed(12345) was run prior to running the code in the R Markdown file. Setting a seed ensures that any results that rely on randomness, e.g. subsampling or permutations, are reproducible.
Great job! Recording the operating system, R version, and package versions is critical for reproducibility.
Nice! There were no cached chunks for this analysis, so you can be confident that you successfully produced the results during this run.
Using absolute paths to the files within your workflowr project makes it difficult for you and others to run your code on a different machine. Change the absolute path(s) below to the suggested relative path(s) to make your code more reproducible.
| absolute | relative |
|---|---|
| /mnt/beegfs/mccarthy/backed_up/general/cazodi/Projects/BAUH_2020_MND-single-cell/code/functions_cellQC.R | ../code/functions_cellQC.R |
| /mnt/beegfs/mccarthy/backed_up/general/cazodi/Projects/BAUH_2020_MND-single-cell/output/pilot3.0_iPSC/01_cellcalling-cellRanger/Capture5-GEX/outs/raw_feature_bc_matrix/ | ../output/pilot3.0_iPSC/01_cellcalling-cellRanger/Capture5-GEX/outs/raw_feature_bc_matrix |
| /mnt/beegfs/mccarthy/backed_up/general/cazodi/Projects/BAUH_2020_MND-single-cell/output/pilot3.0_iPSC/01_cellcalling-merged/Capture5-GEX/barcodes.txt | ../output/pilot3.0_iPSC/01_cellcalling-merged/Capture5-GEX/barcodes.txt |
| /mnt/beegfs/mccarthy/backed_up/general/cazodi/Projects/BAUH_2020_MND-single-cell/output/pilot3.0_iPSC/03_vireo/Capture5-GEX/donor_ids.tsv | ../output/pilot3.0_iPSC/03_vireo/Capture5-GEX/donor_ids.tsv |
| /mnt/beegfs/mccarthy/backed_up/general/cazodi/Projects/BAUH_2020_MND-single-cell/output/pilot3.0_iPSC/01_cellcalling-merged/Capture5-GEX/sce.rds | ../output/pilot3.0_iPSC/01_cellcalling-merged/Capture5-GEX/sce.rds |
| /mnt/beegfs/mccarthy/backed_up/general/cazodi/Projects/BAUH_2020_MND-single-cell/output/pilot3.0_MN/01_cellcalling-cellRanger/Capture3-GEX/outs/raw_feature_bc_matrix/ | ../output/pilot3.0_MN/01_cellcalling-cellRanger/Capture3-GEX/outs/raw_feature_bc_matrix |
| /mnt/beegfs/mccarthy/backed_up/general/cazodi/Projects/BAUH_2020_MND-single-cell/output/pilot3.0_MN/01_cellcalling-merged/Capture3-GEX/barcodes.txt | ../output/pilot3.0_MN/01_cellcalling-merged/Capture3-GEX/barcodes.txt |
| /mnt/beegfs/mccarthy/backed_up/general/cazodi/Projects/BAUH_2020_MND-single-cell/output/pilot3.0_MN/03_vireo-missing-some-cells/Capture3-GEX/donor_ids.tsv | ../output/pilot3.0_MN/03_vireo-missing-some-cells/Capture3-GEX/donor_ids.tsv |
| /mnt/beegfs/mccarthy/backed_up/general/cazodi/Projects/BAUH_2020_MND-single-cell/output/pilot3.0_MN/01_cellcalling-merged/Capture3-GEX/sce.rds | ../output/pilot3.0_MN/01_cellcalling-merged/Capture3-GEX/sce.rds |
Great! You are using Git for version control. Tracking code development and connecting the code version to the results is critical for reproducibility.
The results in this page were generated with repository version 8ac0d8a. See the Past versions tab to see a history of the changes made to the R Markdown and HTML files.
Note that you need to be careful to ensure that all relevant files for the analysis have been committed to Git prior to generating the results (you can use wflow_publish or wflow_git_commit). workflowr only checks the R Markdown file, but you know if there are other scripts or data files that it depends on. Below is the status of the Git repository when the results were generated:
Ignored files:
    Ignored:    .RData
    Ignored:    .Rhistory
    Ignored:    .Rproj.user/
    Ignored:    .cache/
    Ignored:    .config/
    Ignored:    .snakemake/
    Ignored:    BAUH_2020_MND-single-cell.Rproj
    Ignored:    GRCh38_turboGFP-RFP_reference/
    Ignored:    Homo_sapiens.GRCh38.turboGFP/
    Ignored:    Rplots.pdf
    Ignored:    data/1-s2.0-S0002929720300781-main.pdf
    Ignored:    data/2103.11251.pdf
    Ignored:    data/3M-february-2018.txt
    Ignored:    data/737K-august-2016.txt
    Ignored:    data/Cellecta-SEQ-CloneTracker-XP_14bp_barcodes.txt
    Ignored:    data/Cellecta-SEQ-CloneTracker-XP_30bp_barcodes.txt
    Ignored:    data/STAR_index/
    Ignored:    data/STAR_output/
    Ignored:    data/genome1K.phase3.SNP_AF5e2.chr1toX.hg38.log
    Ignored:    data/genome1K.phase3.SNP_AF5e2.chr1toX.hg38.recode.sort.vcf.gz
    Ignored:    data/genome1K.phase3.SNP_AF5e2.chr1toX.hg38.recode.sort.vcf.gz.csi
    Ignored:    data/genome1K.phase3.SNP_AF5e2.chr1toX.hg38.recode.vcf.gz
    Ignored:    data/genome1K.phase3.SNP_AF5e2.chr1toX.hg38.sort.vcf.gz
    Ignored:    data/genome1K.phase3.SNP_AF5e2.chr1toX.hg38.sort.vcf.gz.csi
    Ignored:    data/genome1K.phase3.SNP_AF5e2.chr1toX.hg38.vcf.gz
    Ignored:    data/genome1k.chr22.log
    Ignored:    data/genome1k.chr22.recode.vcf
    Ignored:    data/pilot3_aggr-experiments.csv
    Ignored:    data/pilot3_donors.txt
    Ignored:    data/pilot3_lenti_barcodes_capture5_poolA_D42pass.txt
    Ignored:    data/s41588-018-0268-8.pdf
    Ignored:    data/tr2g_hs.tsv
    Ignored:    logs/
    Ignored:    output/2021-04-27_pilot2_nCells-per-donor.pdf
    Ignored:    output/2021-08-03_pilot2_nCells-per-donor.pdf
    Ignored:    output/CB-scRNAv31-GEX-lib01_QC_metadata.txt
    Ignored:    output/CB-scRNAv31-GEX-lib02_QC_metadata.txt
    Ignored:    output/pilot1_starsoloED/
    Ignored:    output/pilot2.1_gex/
    Ignored:    output/pilot2_HTO-2/
    Ignored:    output/pilot2_HTO/
    Ignored:    output/pilot2_gex_MAF01-152/
    Ignored:    output/pilot2_gex_MAF01/
    Ignored:    output/pilot2_gex_starsolo/
    Ignored:    output/pilot2_gex_starsoloED_GFP/
    Ignored:    output/pilot2_testing/
    Ignored:    output/pilot3.0_MN/
    Ignored:    output/pilot3.0_iPSC/
    Ignored:    output/pilot3_Lenti/
    Ignored:    references/Homo_sapiens.GRCh38.turboGFP.bed
    Ignored:    references/Homo_sapiens.GRCh38.turboGFP.fa
    Ignored:    references/Homo_sapiens.GRCh38.turboGFP.fa.fai
    Ignored:    references/Homo_sapiens.GRCh38.turboGFP.filtered.gtf
    Ignored:    references/Homo_sapiens.GRCh38.turboGFP.gtf
    Ignored:    references/Homo_sapiens.GRCh38.turboGFP_gene.gtf
    Ignored:    references/SAindex/
    Ignored:    references/geno_test.vcf.gz
    Ignored:    references/pilot3/
    Ignored:    references/test
    Ignored:    references/turboGFP.fa
    Ignored:    references/turboGFP.gtf
    Ignored:    references/turboRFP.fa
    Ignored:    workflow/rules/

Untracked files:
    Untracked:  .nv/
    Untracked:  Capture5-GEX/
    Untracked:  __Capture5-GEX.mro
    Untracked:  analysis/figure/
    Untracked:  cellbender.dockerfile
    Untracked:  code/run_soupX_pilot3_capture3.R
    Untracked:  code/subsetting_mpileup.R
    Untracked:  hwe1e-05_maf05_vcf_stats.txt
    Untracked:  hwe1e-05_vcf_stats.txt
    Untracked:  workflow/Snakefile_simple.smk

Unstaged changes:
    Modified:   .gitignore
    Modified:   analysis/2022-03-06_pilot3_CellQC.Rmd
    Modified:   code/run_soupX_2.R
    Modified:   config/config_pilot3.0_MN.yml
    Modified:   config/config_pilot3.0_iPSC.yml
Note that any generated files, e.g. HTML, png, CSS, etc., are not included in this status report because it is ok for generated content to have uncommitted changes.
These are the previous versions of the repository in which changes were made to the R Markdown (analysis/2022-03-06_pilot3_CellQC.Rmd) and HTML (public/2022-03-06_pilot3_CellQC.html) files. If you’ve configured a remote Git repository (see ?wflow_git_remote), click on the hyperlinks in the table below to view the files as they were in that past version.
| File | Version | Author | Date | Message |
|---|---|---|---|---|
| Rmd | d01f3b8 | cazodi | 2022-03-30 | testing snp filtering for vireo |
| Rmd | 2c95e3b | cazodi | 2022-03-09 | add stats to demulxiplexing results |
| Rmd | c683543 | cazodi | 2022-03-09 | updated c5 lenti barcode analysis and donor assignment comparisons |
suppressPackageStartupMessages({
  library(tidyverse)
  library(data.table)
  library(scuttle)
  library(knitr)
  library(rhdf5)
  library(Matrix)
  library(jcolors)
  library(cowplot)
  library(SingleCellExperiment)
  library(EnsDb.Hsapiens.v86)
  library(scater)
  library(scran)
  library(ggpubr)
  library(Rtsne)
  library(DropletUtils)
  library(viridis)
  library(org.Hs.eg.db)
  library(celldex)
  library(SingleR)
})

source("/mnt/beegfs/mccarthy/backed_up/general/cazodi/Projects/BAUH_2020_MND-single-cell/code/functions_cellQC.R")
rerun <- FALSE
Cellranger QC reports:
iPSCs
if(rerun) {
  ipsc <- load_raw_filter("/mnt/beegfs/mccarthy/backed_up/general/cazodi/Projects/BAUH_2020_MND-single-cell/output/pilot3.0_iPSC/01_cellcalling-cellRanger/Capture5-GEX/outs/raw_feature_bc_matrix/", "/mnt/beegfs/mccarthy/backed_up/general/cazodi/Projects/BAUH_2020_MND-single-cell/output/pilot3.0_iPSC/01_cellcalling-merged/Capture5-GEX/barcodes.txt")
  ipsc <- add_ensemble_barcode_res(ipsc, "pilot3.0_iPSC", "Capture5-GEX")
  ipsc <- add_mito_turboGFP_stats(ipsc)
  ipsc <- add_donor_IDs(ipsc, "/mnt/beegfs/mccarthy/backed_up/general/cazodi/Projects/BAUH_2020_MND-single-cell/output/pilot3.0_iPSC/03_vireo/Capture5-GEX/donor_ids.tsv")
  colData(ipsc)$is.donor197 <- colData(ipsc)$donor_id == "197"
  colData(ipsc)$is.donor129 <- colData(ipsc)$donor_id == "129"
  ipsc <- logNormCounts(ipsc)
  ipsc <- runPCA(ipsc, exprs_values = "logcounts")
  ipsc <- runTSNE(ipsc, dimred = "PCA")
  saveRDS(ipsc, "/mnt/beegfs/mccarthy/backed_up/general/cazodi/Projects/BAUH_2020_MND-single-cell/output/pilot3.0_iPSC/01_cellcalling-merged/Capture5-GEX/sce.rds")
} else{
  ipsc <- readRDS("/mnt/beegfs/mccarthy/backed_up/general/cazodi/Projects/BAUH_2020_MND-single-cell/output/pilot3.0_iPSC/01_cellcalling-merged/Capture5-GEX/sce.rds")
}
ipsc
class: SingleCellExperiment
dim: 33539 34422
metadata(0):
assays(2): counts logcounts
rownames(33539): MIR1302-2HG FAM138A ... FAM231C turboGFP
rowData names(0):
colnames(34422): AAACCCAAGCTCGAAG-1 AAACCCAAGGAAAGTG-1 ...
TTTGTTGTCTAAGGAA-1 TTTGTTGTCTCCGCAT-1
colData names(28): orig.ident nCount_RNA ... is.donor129 sizeFactor
reducedDimNames(2): PCA TSNE
mainExpName: RNA
altExpNames(0):as.data.frame(colData(ipsc)) %>%
pivot_longer(cols = c("sum", "detected", "subsets_Mito_percent", "n_vars"),
names_to = "metric", values_to = "value", values_drop_na = TRUE) %>%
ggplot(aes(x=donor_assignment, y=value, fill=donor_assignment)) +
geom_violin() + facet_wrap(.~metric, scales = "free") +
stat_summary(fun=median, geom="point", size=2, color="black") +
theme_cowplot()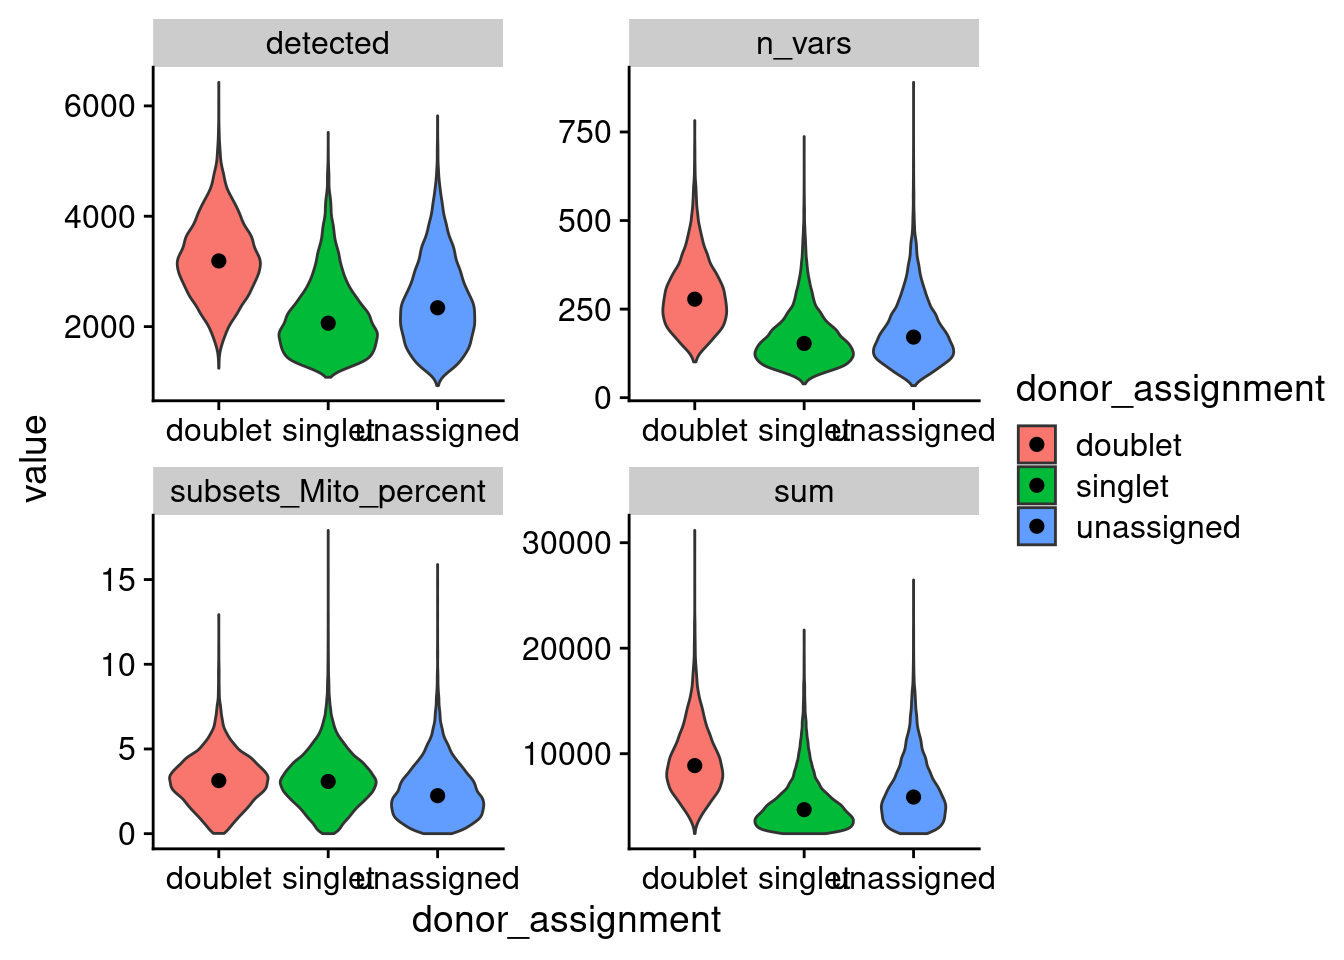
detected features, n_vars: number of SNPs used for donor id by vireo, sum total counts
plotHighestExprs(ipsc[,sample(seq_len(ncol(ipsc)), 1000)], exprs_values = "counts")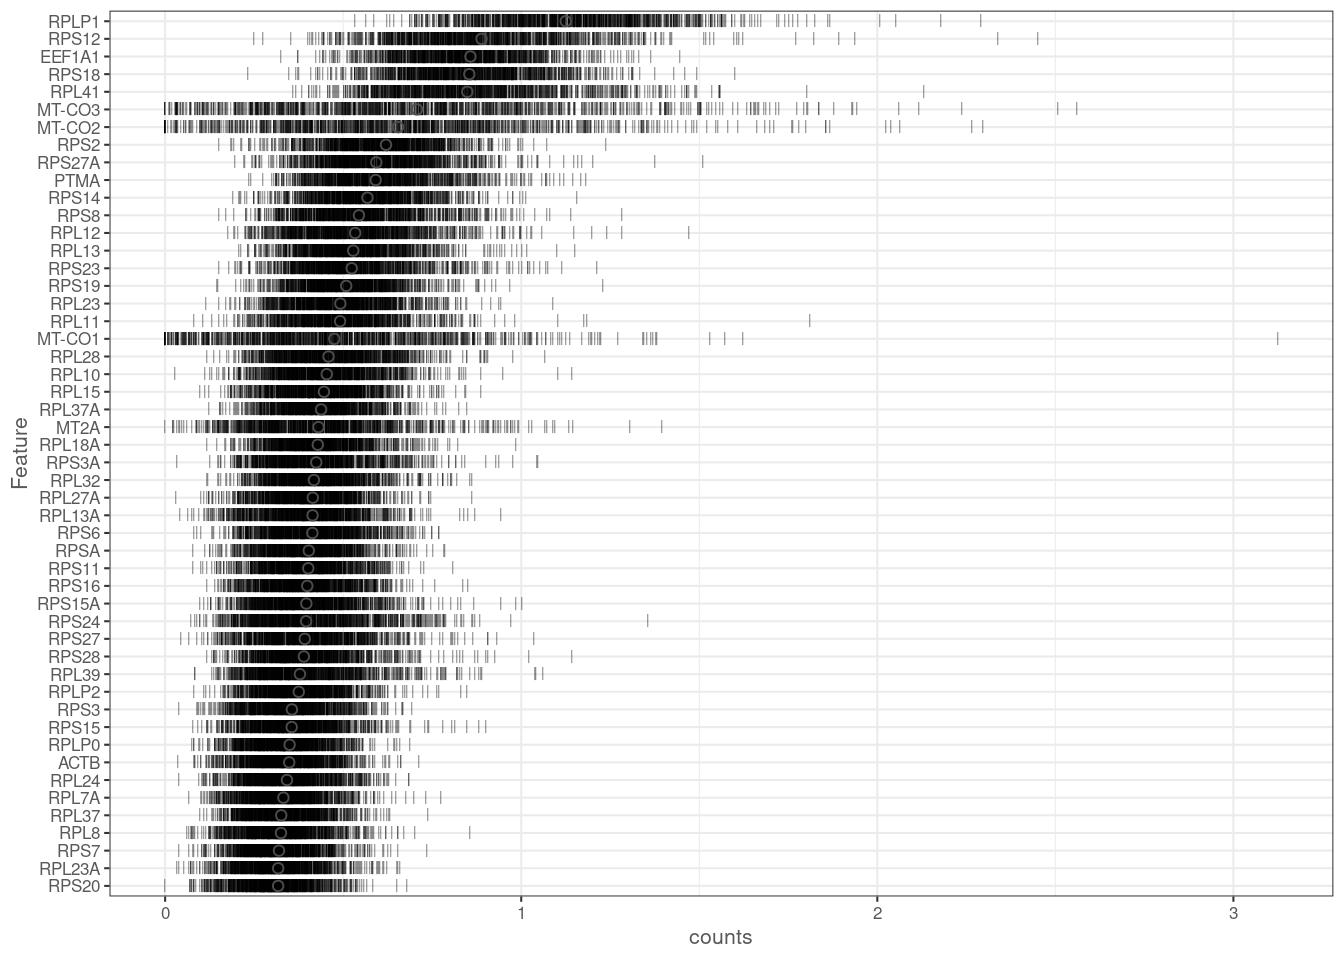
gene_stats_ipsc <- as.data.frame(list(sum = rowSums(counts(ipsc)),
                                 nZero = rowSums(counts(ipsc)==0)))
gene_stats_ipsc$means <- gene_stats_ipsc$sum / ncol(ipsc)
message("Distribution of gene means across all cells")
ggplot(gene_stats_ipsc, aes(means)) + geom_histogram(bins=100)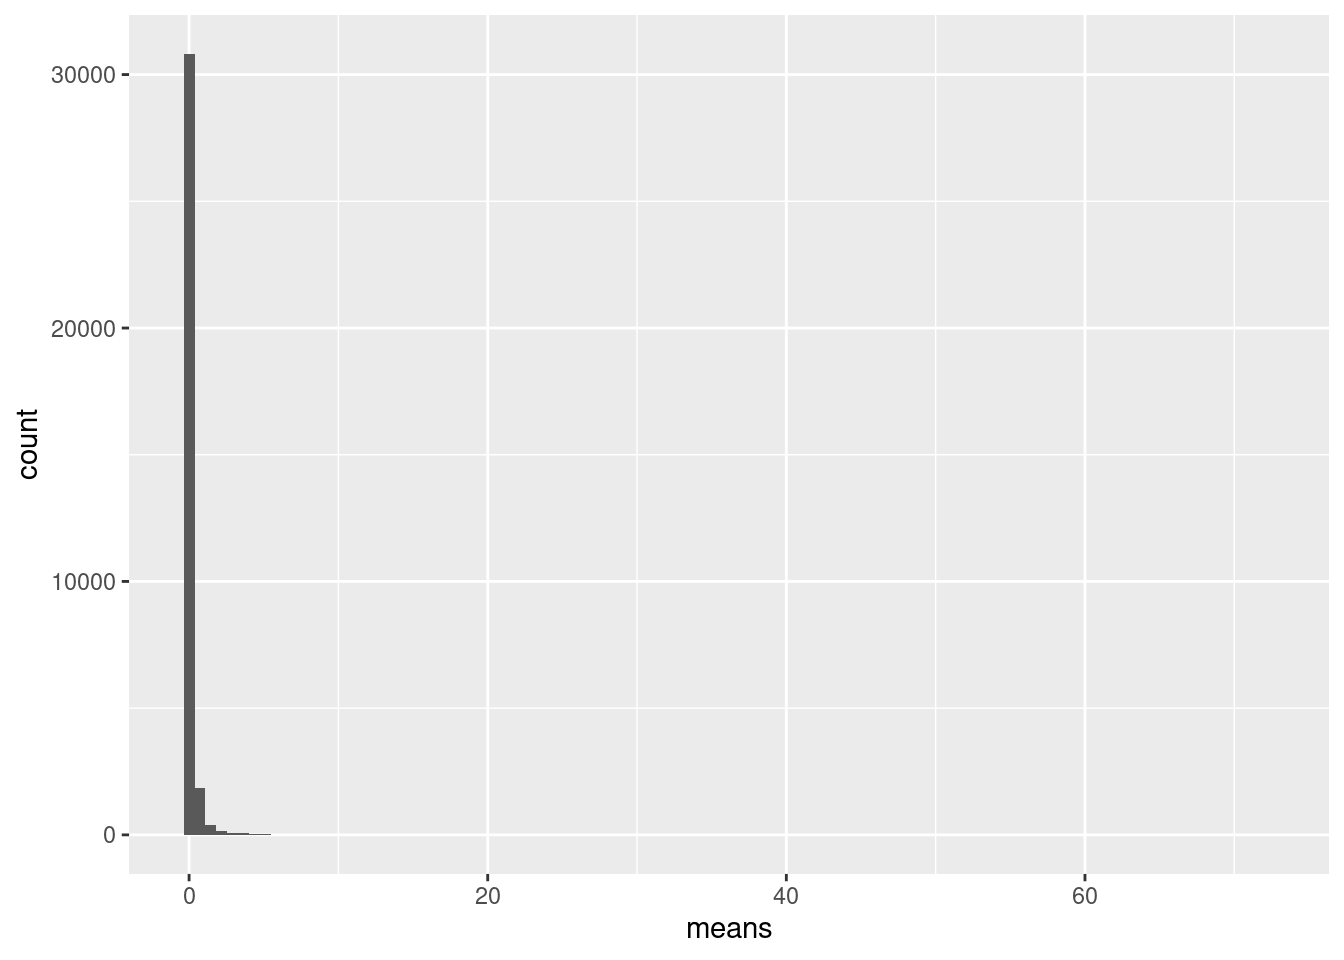
summary(gene_stats_ipsc$means) Min. 1st Qu. Median Mean 3rd Qu. Max.
0.00000 0.00003 0.00171 0.19298 0.06595 72.35015 table(gene_stats_ipsc$keep_genes & gene_stats_ipsc$means >1)< table of extent 0 >gene_stats_ipsc$keep_genes <- gene_stats_ipsc$nZero < ncol(ipsc)*0.95
ipsc <- ipsc[gene_stats_ipsc$keep_genes, ]
table(gene_stats_ipsc$keep_genes & gene_stats_ipsc$means >= 2)
FALSE  TRUE
33115   424
ipsc <- logNormCounts(ipsc)
ipsc <- runPCA(ipsc, exprs_values = "logcounts")
ipsc <- runTSNE(ipsc, dimred = "PCA")p1 <- plotTSNE(ipsc, colour_by = "donor_assignment")
p2 <- plotTSNE(ipsc, colour_by = "is.donor197")
p3 <- plotTSNE(ipsc, colour_by = "is.donor129")
p4 <- plotTSNE(ipsc, colour_by = "sum")
p5 <- plotTSNE(ipsc, colour_by = "detected")
p6 <- plotTSNE(ipsc, colour_by = "subsets_Mito_percent")
plot_grid(p1, p2, p3, p4, p5, p6, ncol=3)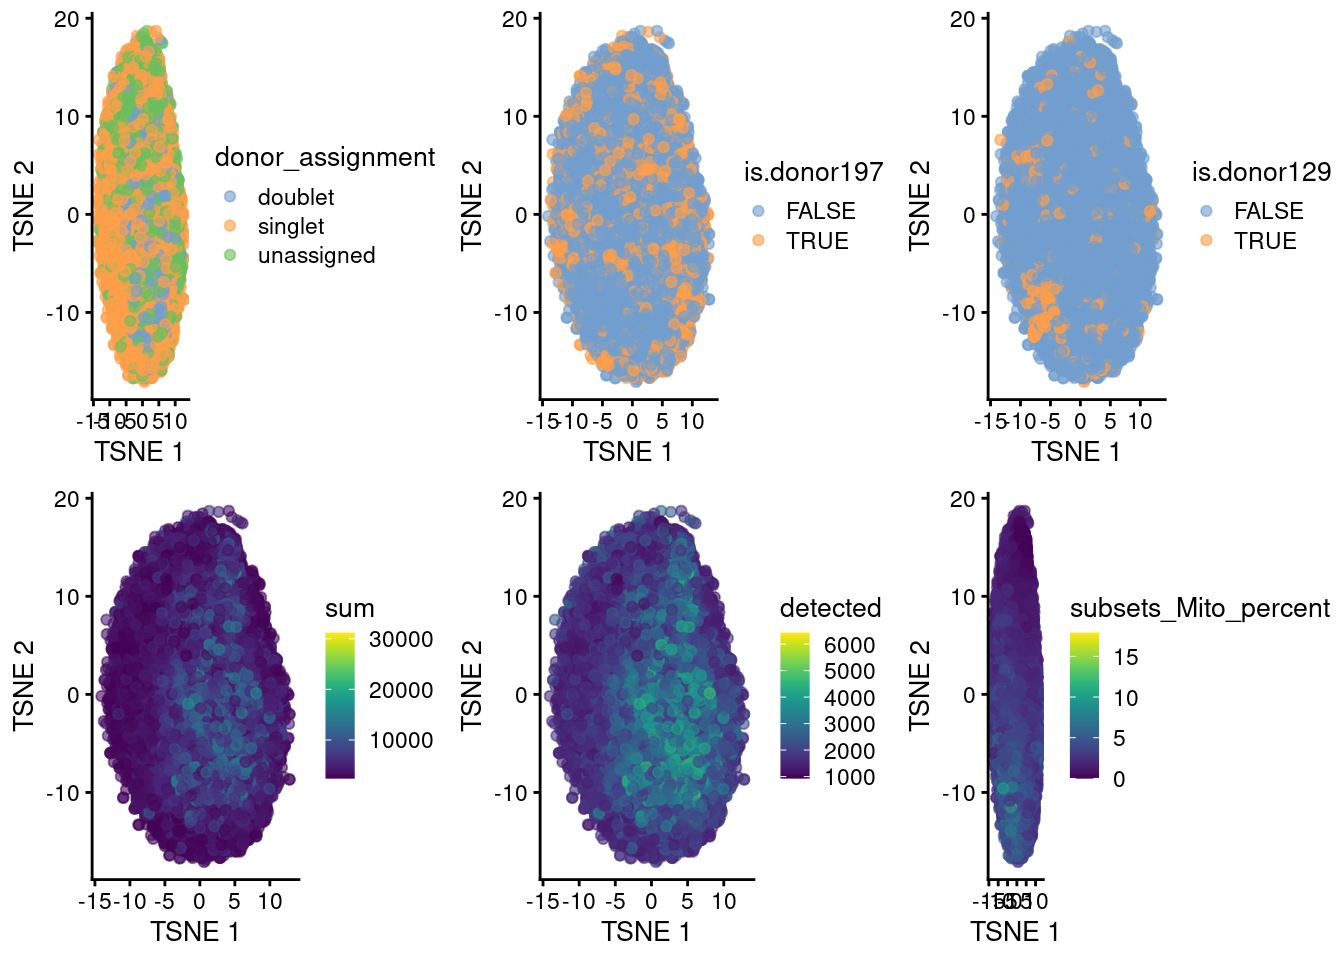
MN Capture 3
if(rerun) {
  cap3 <- load_raw_filter("/mnt/beegfs/mccarthy/backed_up/general/cazodi/Projects/BAUH_2020_MND-single-cell/output/pilot3.0_MN/01_cellcalling-cellRanger/Capture3-GEX/outs/raw_feature_bc_matrix/", "/mnt/beegfs/mccarthy/backed_up/general/cazodi/Projects/BAUH_2020_MND-single-cell/output/pilot3.0_MN/01_cellcalling-merged/Capture3-GEX/barcodes.txt")
  cap3 <- add_ensemble_barcode_res(cap3, "pilot3.0_MN", "Capture3-GEX")
  cap3 <- add_mito_turboGFP_stats(cap3)
  cap3 <- add_donor_IDs(cap3, "/mnt/beegfs/mccarthy/backed_up/general/cazodi/Projects/BAUH_2020_MND-single-cell/output/pilot3.0_MN/03_vireo-missing-some-cells/Capture3-GEX/donor_ids.tsv")
  colData(cap3)$is.donor197 <- colData(cap3)$donor_id == "197"
  colData(cap3)$is.donor129 <- colData(cap3)$donor_id == "129"
  saveRDS(cap3, "/mnt/beegfs/mccarthy/backed_up/general/cazodi/Projects/BAUH_2020_MND-single-cell/output/pilot3.0_MN/01_cellcalling-merged/Capture3-GEX/sce.rds")
} else{
  cap3 <- readRDS("/mnt/beegfs/mccarthy/backed_up/general/cazodi/Projects/BAUH_2020_MND-single-cell/output/pilot3.0_MN/01_cellcalling-merged/Capture3-GEX/sce.rds")
}

cap3 <- subset(cap3, , !is.na(donor_assignment))
cap3
class: SingleCellExperiment
dim: 33539 6223
metadata(0):
assays(2): counts logcounts
rownames(33539): MIR1302-2HG FAM138A ... FAM231C turboGFP
rowData names(0):
colnames(6223): AAACCCAAGGGCTTCC-1 AAACCCAAGTTCCATG-1 ...
TTTGTTGGTTTACCAG-1 TTTGTTGTCGCCTTGT-1
colData names(27): orig.ident nCount_RNA ... is.donor197 is.donor129
reducedDimNames(0):
mainExpName: RNA
altExpNames(0):message("donor assignments for capture3:")
sort(table(cap3$donor_id))
       105        107        122        127        152        200        207
         1          1          1          1          1          1          1
       208        220        227        228        239         77         91
         1          1          1          1          1          1          1
      T232       T235       W104       W112       W134        121        183
         1          1          1          1          1          2          2
       184        196         92       W103       W263        131        188
         2          2          2          2          2          3          3
       190        194         76       W014        218         93        192
         3          3          3          3          6          6          7
       237       T234        221        210        214       W005        100
         7          7          8          9         12         13         15
       128        102        187        154        198         88        119
        22         28         28         33         33         46         54
      W132        189       W187        104 unassigned    doublet        129
        76         89        126        328        667        893        957
       197
2702 message("distribution of TurboGFP:")
summary(cap3$turboGFP) Min. 1st Qu. Median Mean 3rd Qu. Max.
0.0000 0.0000 0.0000 0.1923 0.0000 66.0000 message("cells with any TurboGFP:")
table(cap3$turboGFP_bin)
FALSE  TRUE
5861 362 as.data.frame(colData(cap3)) %>%
mutate(log10_sum = log10(sum+1)) %>%
pivot_longer(cols = c("log10_sum", "detected", "subsets_Mito_percent", "n_vars"),
names_to = "metric", values_to = "value", values_drop_na = TRUE) %>%
ggplot(aes(x=donor_assignment, y=value, fill=donor_assignment)) +
geom_violin() + facet_wrap(.~metric, scales = "free") +
stat_summary(fun.y=median, geom="point", size=2, color="black") +
theme_cowplot()Warning: `fun.y` is deprecated. Use `fun` instead.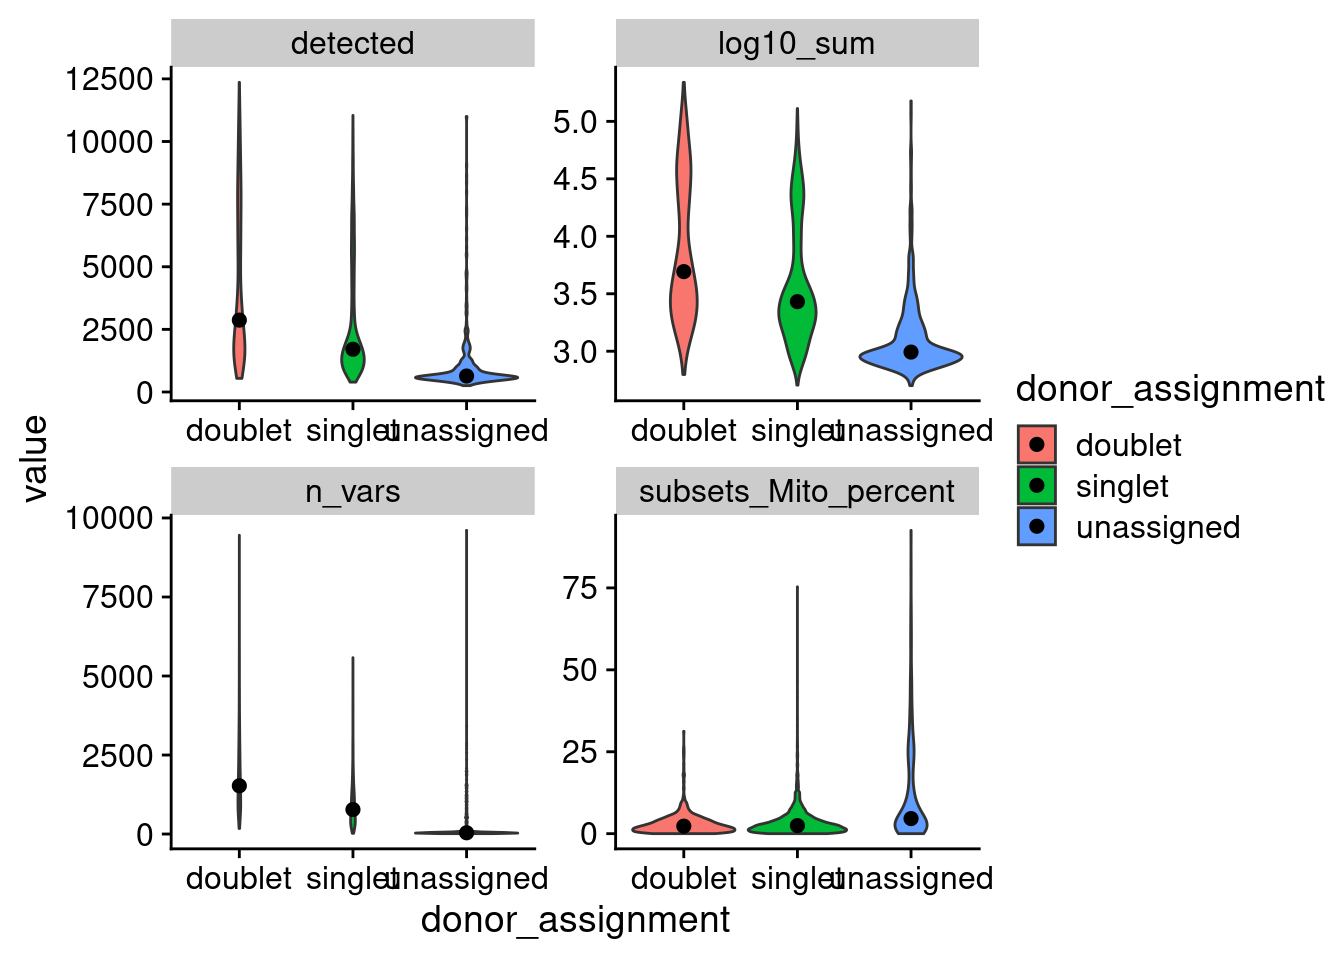
Filtering out unassigned and doublet reads from here…
cap3 <- subset(cap3, , donor_assignment == "singlet")
dim(cap3)
[1] 33539 4663plotHighestExprs(cap3[,sample(seq_len(ncol(cap3)), 1000)], exprs_values = "counts")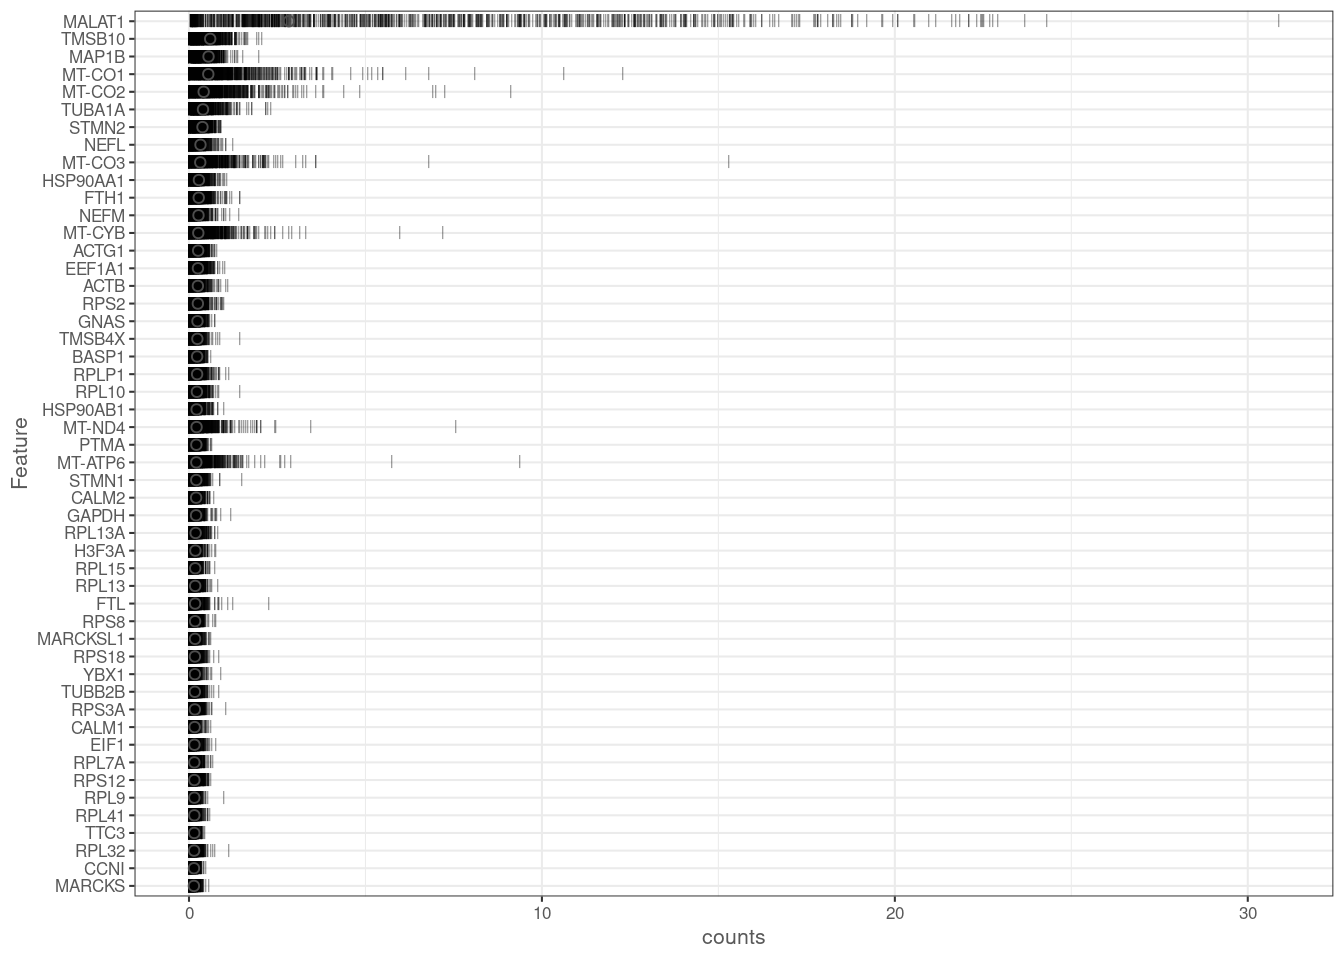
gene_stats <- as.data.frame(list(sum = rowSums(counts(cap3)),
                                 nZero = rowSums(counts(cap3)==0)))
gene_stats$means <- gene_stats$sum / ncol(cap3)
message("Distribution of gene means across all cells")
ggplot(gene_stats, aes(means)) + geom_histogram(bins=100)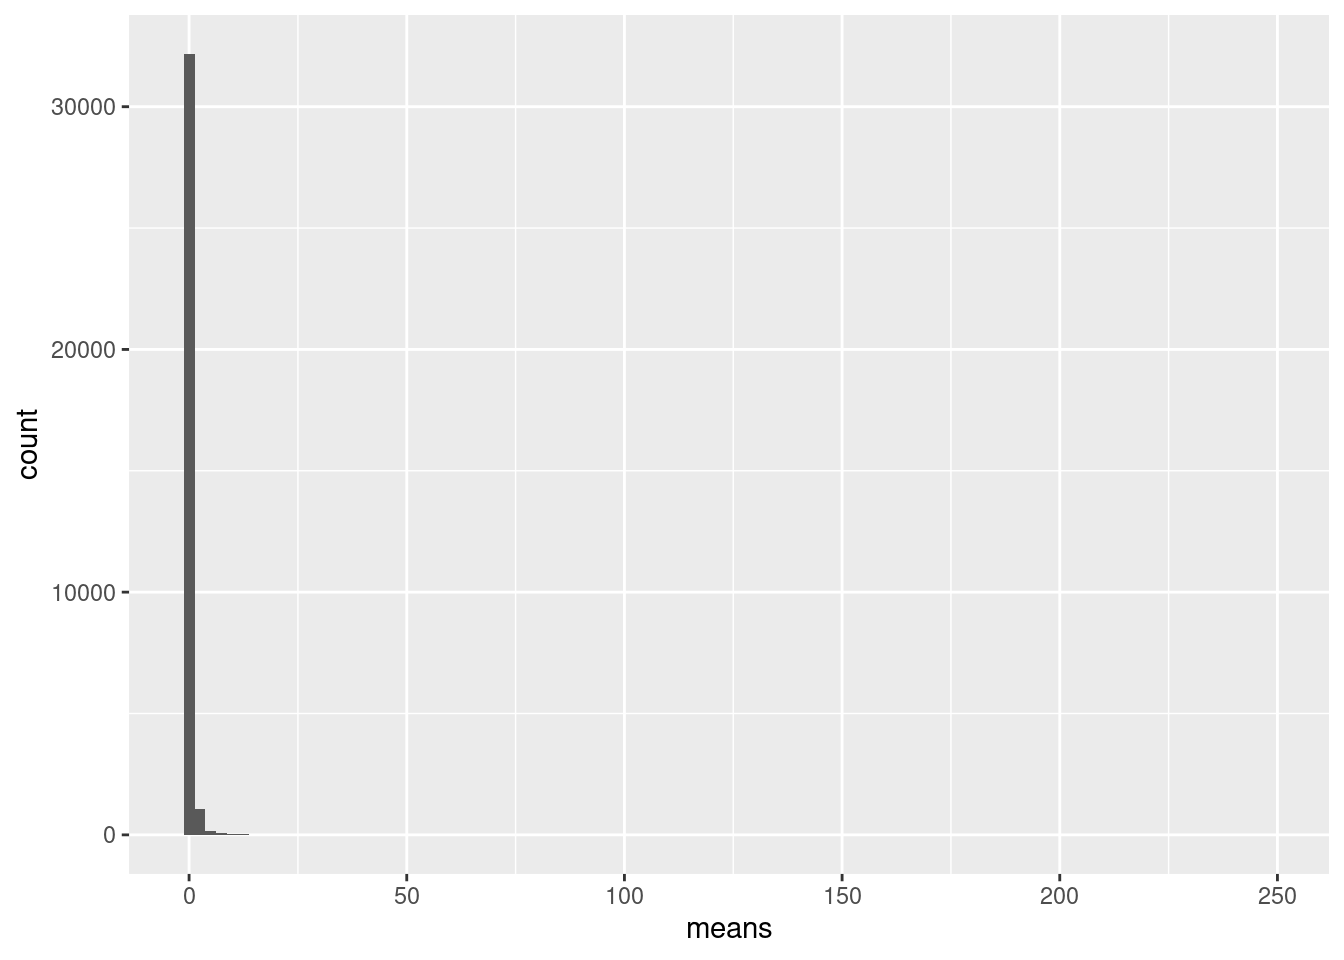
summary(gene_stats$means) Min. 1st Qu. Median Mean 3rd Qu. Max.
0.00000 0.00021 0.00600 0.25896 0.14969 248.14819 gene_stats$keep_genes <- gene_stats$nZero < ncol(cap3)*0.95
message("Number of genes meeting criteria of expressed in at least 5% of cells.")
table(gene_stats$keep_genes)
FALSE  TRUE
22451 11088
cap3 <- cap3[gene_stats$keep_genes, ]
table(gene_stats$keep_genes & gene_stats$means >= 2)
FALSE  TRUE
32829   710
cap3 <- logNormCounts(cap3)
cap3 <- runPCA(cap3, exprs_values = "logcounts")
cap3 <- runTSNE(cap3, dimred = "PCA")gene_stats_ipsc$gene <- rownames(gene_stats_ipsc)
gene_stats$gene <- rownames(gene_stats)
gene_stats_compare <- gene_stats %>% inner_join(gene_stats_ipsc, by ="gene", suffix=c(".mn", ".ipsc"))
ggscatter(gene_stats_compare, x="means.ipsc", y="means.mn",
add = "reg.line", ylim=c(0, 550), xlim=c(0, 550))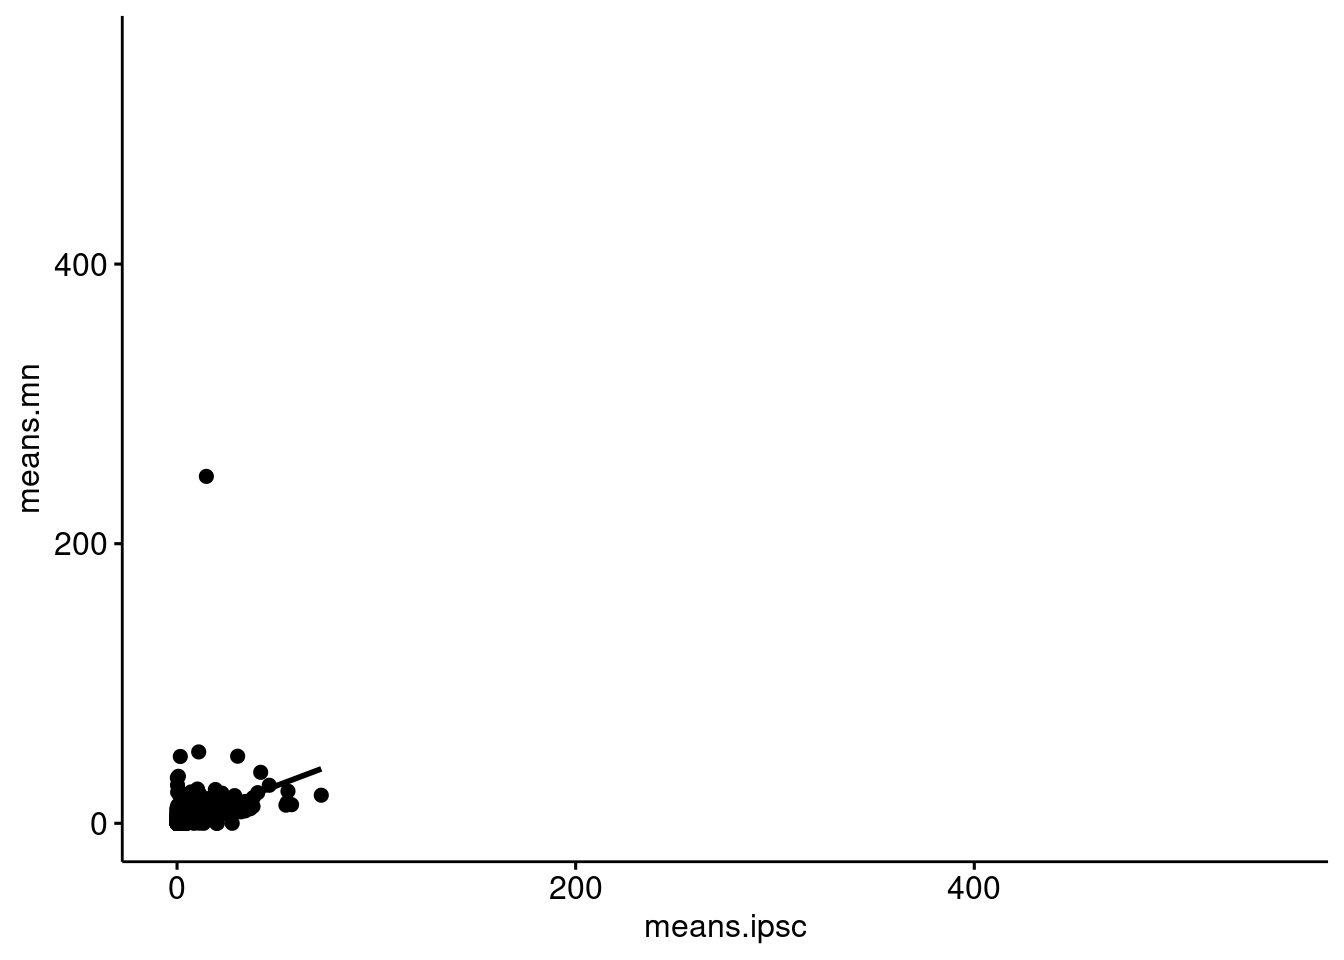
p1 <- plotTSNE(cap3, colour_by = "turboGFP_bin")
p2 <- plotTSNE(cap3, colour_by = "is.donor197")
p3 <- plotTSNE(cap3, colour_by = "is.donor129")
p4 <- plotTSNE(cap3, colour_by = "sum")
p5 <- plotTSNE(cap3, colour_by = "detected")
p6 <- plotTSNE(cap3, colour_by = "subsets_Mito_percent")
plot_grid(p1, p2, p3, p4, p5, p6, ncol=3)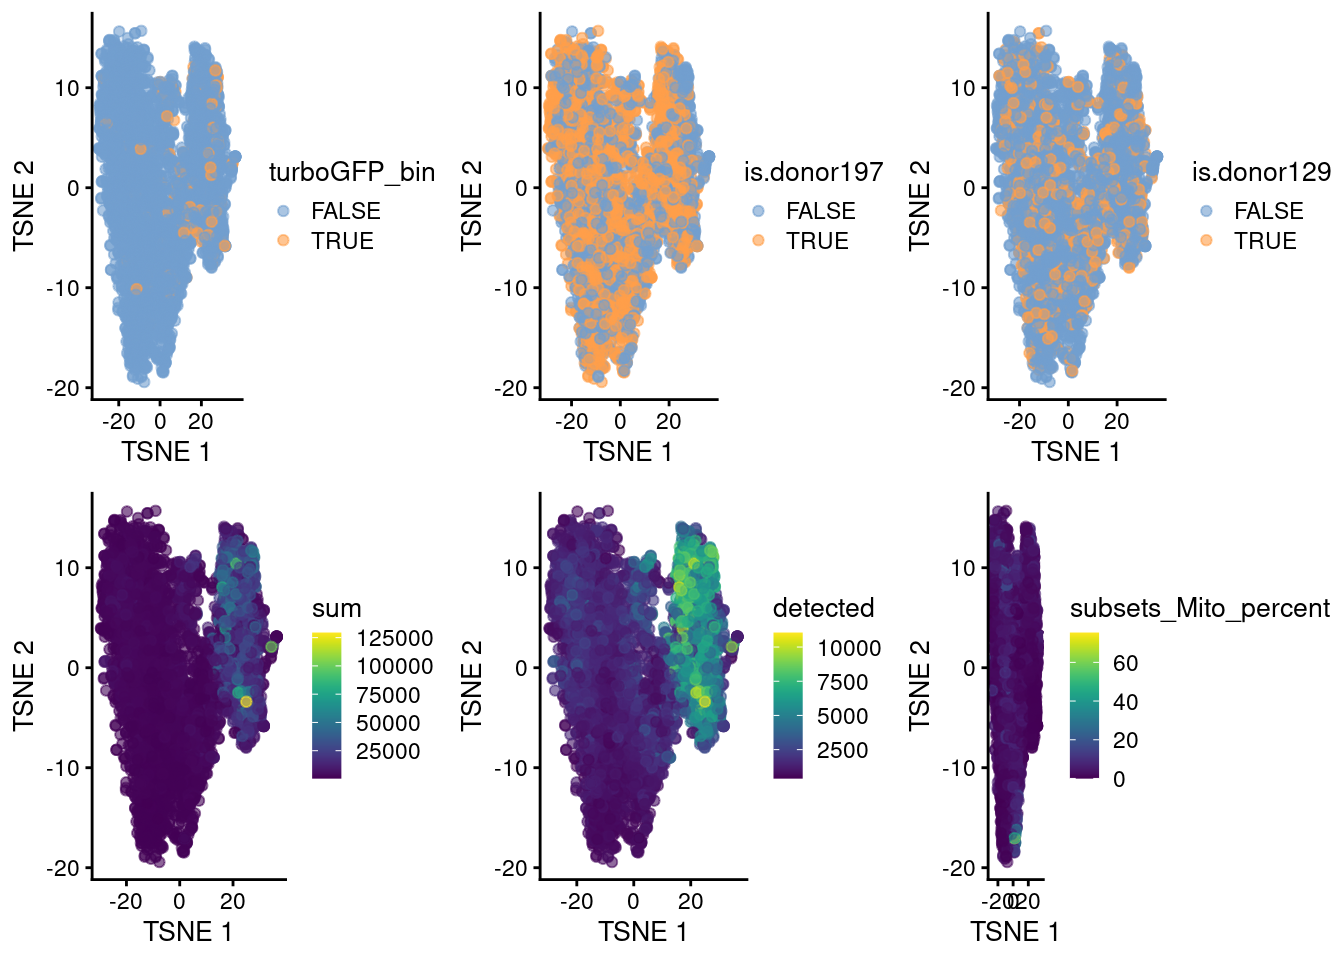
Identifying Motor Neurons
Automated Annotation
The intuition of automatic annotation is by comparing current dataset with previously annotation reference samples and find the cell type of the most similar/correlated cells. For example, the SingleR method assigns labels to cells based on the reference samples with the highest Spearman rank correlations, using only the marker genes between pairs of labels to focus on the relevant differences between cell types. It then performs a fine-tuning step for each cell where the correlations are recomputed with just the marker genes for the top-scoring labels. This aims to resolve any ambiguity between those labels by removing noise from irrelevant markers for other labels.
I used SingleR to annotate cells from this experiment against two reference databases: the Human Primary Cell Atlas Data and the Blueprint Encode Data.
rowData(cap3) <- as.data.frame(list(Symbol=rownames(cap3)))
gene.symbols <- unique(rowData(cap3)$Symbol)
gene.symbols <- gene.symbols[!is.na(gene.symbols)]
cap3 <- cap3[rowData(cap3)$Symbol %in% gene.symbols, ]
rownames(cap3) <- rowData(cap3)$Symbol
# Human Primary Cell Atlas Data
hpca.se <- celldex::HumanPrimaryCellAtlasData()
pred.hesc <- SingleR(test = cap3, ref = hpca.se,
assay.type.test=1, labels = hpca.se$label.main)
cap3$HPCA_label <- pred.hesc[, "labels"]
# Blueprint Encode Data
encode.se <- celldex::BlueprintEncodeData()
pred.encode <- SingleR(test = cap3, ref = encode.se,
assay.type.test=1, labels = encode.se$label.main)
cap3$BPE_label <- pred.encode[, "labels"]Lets look at a summary of how many cells were labeled as MN using viral labeling compared with the automated annotations:
message("BPE labels")
sort(table(cap3$BPE_label))
Adipocytes CD4+ T-cells CD8+ T-cells Smooth muscle
1 1 1 1
B-cells Myocytes Endothelial cells Erythrocytes
2 2 3 3
Fibroblasts Skeletal muscle HSC Mesangial cells
4 5 7 8
Astrocytes Epithelial cells Neurons
11 11 4603 message("HPCA labels")
sort(table(cap3$HPCA_label))
Fibroblasts Neutrophils T_cells
1 1 1
iPS_cells Smooth_muscle_cells MSC
2 2 3
Platelets Embryonic_stem_cells Neuroepithelial_cell
5 9 974
Neurons Astrocyte
1716 1949 message("TurboGFP")
table(cap3$turboGFP_bin)
FALSE TRUE
4439 224 message("Joint comparison")
data.frame(colData(cap3)) %>% group_by(HPCA_label, BPE_label, turboGFP_bin) %>%
tally() %>% dplyr::filter(n >= 5) %>% arrange(desc(n))# A tibble: 7 × 4
# Groups: HPCA_label, BPE_label [4]
HPCA_label BPE_label turboGFP_bin n
<chr> <chr> <lgl> <int>
1 Astrocyte Neurons FALSE 1884
2 Neurons Neurons FALSE 1598
3 Neuroepithelial_cell Neurons FALSE 893
4 Neurons Neurons TRUE 96
5 Neuroepithelial_cell Neurons TRUE 64
6 Astrocyte Neurons TRUE 56
7 Platelets Neurons FALSE 5Visualize cell annotations
While cells with the viral label tend to be in the higher UMI count cluster (Figure 9a,b), cells annotated as neurons using the HPCA database or BPE database as a reference are present in both clusters (Figure 9c, d). By removing the neuron annotated cells from the plots we can see what other cells types are being annotated (Figure 9e, f). The non-neurons tend to be in the low UMI count cluster for both databases, with the exception of cells annotated as astrocytes using the HPCA database, which are more evenly distributed across total UMI count clusters.
cap3 <- logNormCounts(cap3)
cap3 <- runPCA(cap3, exprs_values = "logcounts")
cap3 <- runTSNE(cap3, dimred = "PCA")
p1 <- plotTSNE(cap3, colour_by="detected")
p2 <- plotTSNE(cap3, colour_by="turboGFP_bin")
p3 <- plotTSNE(cap3, colour_by="BPE_label")
p4 <- plotTSNE(cap3, colour_by="HPCA_label")
plot_grid(p1, p2, p3, p4, ncol=2, labels = "auto") 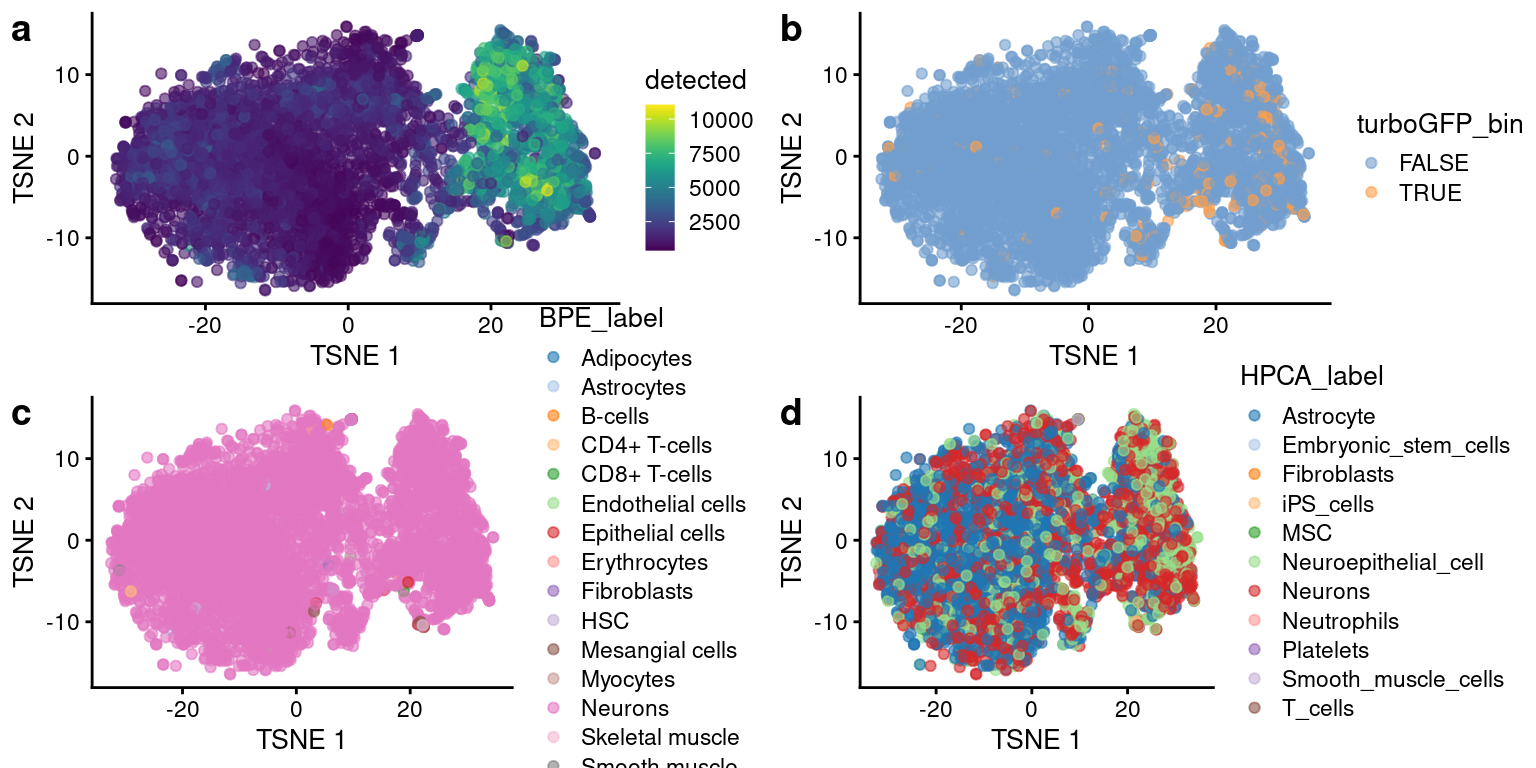
tSNE plots after size factor normalization and denoising, with cells colored by (a) cell annotations using the Human Primary Cell Atlas Data as a reference and (b) cell annotations using the Blueprint Encode Data as a reference.
SessionInfo
sessionInfo()R version 4.1.1 (2021-08-10)
Platform: x86_64-pc-linux-gnu (64-bit)
Running under: Rocky Linux 8.5 (Green Obsidian)
Matrix products: default
BLAS/LAPACK: /usr/lib64/libopenblasp-r0.3.12.so
locale:
[1] LC_CTYPE=en_AU.UTF-8 LC_NUMERIC=C
[3] LC_TIME=en_AU.UTF-8 LC_COLLATE=en_AU.UTF-8
[5] LC_MONETARY=en_AU.UTF-8 LC_MESSAGES=en_AU.UTF-8
[7] LC_PAPER=en_AU.UTF-8 LC_NAME=C
[9] LC_ADDRESS=C LC_TELEPHONE=C
[11] LC_MEASUREMENT=en_AU.UTF-8 LC_IDENTIFICATION=C
attached base packages:
[1] stats4 stats graphics grDevices utils datasets methods
[8] base
other attached packages:
[1] SingleR_1.8.1 celldex_1.4.0
[3] org.Hs.eg.db_3.14.0 viridis_0.6.2
[5] viridisLite_0.4.0 DropletUtils_1.14.2
[7] Rtsne_0.15 ggpubr_0.4.0
[9] scran_1.22.1 scater_1.22.0
[11] EnsDb.Hsapiens.v86_2.99.0 ensembldb_2.18.2
[13] AnnotationFilter_1.18.0 GenomicFeatures_1.46.1
[15] AnnotationDbi_1.56.2 cowplot_1.1.1
[17] jcolors_0.0.4 Matrix_1.4-0
[19] rhdf5_2.38.0 knitr_1.37
[21] scuttle_1.4.0 SingleCellExperiment_1.16.0
[23] SummarizedExperiment_1.24.0 Biobase_2.54.0
[25] GenomicRanges_1.46.1 GenomeInfoDb_1.30.1
[27] IRanges_2.28.0 S4Vectors_0.32.3
[29] BiocGenerics_0.40.0 MatrixGenerics_1.6.0
[31] matrixStats_0.61.0 data.table_1.14.2
[33] forcats_0.5.1 stringr_1.4.0
[35] dplyr_1.0.7 purrr_0.3.4
[37] readr_2.1.1 tidyr_1.1.4
[39] tibble_3.1.6 ggplot2_3.3.5
[41] tidyverse_1.3.1
loaded via a namespace (and not attached):
[1] utf8_1.2.2 R.utils_2.11.0
[3] tidyselect_1.1.2 RSQLite_2.2.10
[5] grid_4.1.1 BiocParallel_1.28.3
[7] munsell_0.5.0 ScaledMatrix_1.2.0
[9] statmod_1.4.36 withr_2.5.0
[11] colorspace_2.0-3 filelock_1.0.2
[13] highr_0.9 rstudioapi_0.13
[15] ggsignif_0.6.3 labeling_0.4.2
[17] git2r_0.29.0 GenomeInfoDbData_1.2.7
[19] farver_2.1.0 bit64_4.0.5
[21] rprojroot_2.0.2 vctrs_0.3.8
[23] generics_0.1.2 xfun_0.30
[25] BiocFileCache_2.2.0 R6_2.5.1
[27] ggbeeswarm_0.6.0 rsvd_1.0.5
[29] locfit_1.5-9.5 bitops_1.0-7
[31] rhdf5filters_1.6.0 cachem_1.0.6
[33] DelayedArray_0.20.0 assertthat_0.2.1
[35] promises_1.2.0.1 BiocIO_1.4.0
[37] scales_1.1.1 beeswarm_0.4.0
[39] gtable_0.3.0 beachmat_2.10.0
[41] workflowr_1.6.2 rlang_1.0.2
[43] splines_4.1.1 rtracklayer_1.54.0
[45] rstatix_0.7.0 lazyeval_0.2.2
[47] broom_0.7.10 BiocManager_1.30.16
[49] yaml_2.3.5 abind_1.4-5
[51] modelr_0.1.8 backports_1.4.1
[53] httpuv_1.6.5 tools_4.1.1
[55] ellipsis_0.3.2 jquerylib_0.1.4
[57] Rcpp_1.0.8 sparseMatrixStats_1.6.0
[59] progress_1.2.2 zlibbioc_1.40.0
[61] RCurl_1.98-1.5 prettyunits_1.1.1
[63] haven_2.4.3 ggrepel_0.9.1
[65] cluster_2.1.2 fs_1.5.2
[67] magrittr_2.0.2 reprex_2.0.1
[69] whisker_0.4 ProtGenerics_1.26.0
[71] xtable_1.8-4 mime_0.12
[73] hms_1.1.1 evaluate_0.15
[75] XML_3.99-0.9 readxl_1.3.1
[77] gridExtra_2.3 compiler_4.1.1
[79] biomaRt_2.50.3 crayon_1.5.0
[81] R.oo_1.24.0 htmltools_0.5.2
[83] mgcv_1.8-39 later_1.3.0
[85] tzdb_0.2.0 lubridate_1.8.0
[87] DBI_1.1.2 ExperimentHub_2.2.0
[89] dbplyr_2.1.1 rappdirs_0.3.3
[91] car_3.0-12 cli_3.2.0
[93] R.methodsS3_1.8.1 parallel_4.1.1
[95] metapod_1.2.0 igraph_1.2.11
[97] pkgconfig_2.0.3 GenomicAlignments_1.30.0
[99] xml2_1.3.3 vipor_0.4.5
[101] bslib_0.3.1 dqrng_0.3.0
[103] XVector_0.34.0 rvest_1.0.2
[105] digest_0.6.29 Biostrings_2.62.0
[107] rmarkdown_2.11 cellranger_1.1.0
[109] edgeR_3.36.0 DelayedMatrixStats_1.16.0
[111] restfulr_0.0.13 curl_4.3.2
[113] shiny_1.7.1 Rsamtools_2.10.0
[115] rjson_0.2.21 nlme_3.1-152
[117] lifecycle_1.0.1 jsonlite_1.8.0
[119] Rhdf5lib_1.16.0 carData_3.0-5
[121] BiocNeighbors_1.12.0 limma_3.50.1
[123] fansi_1.0.0 pillar_1.6.4
[125] lattice_0.20-45 KEGGREST_1.34.0
[127] fastmap_1.1.0 httr_1.4.2
[129] interactiveDisplayBase_1.32.0 glue_1.6.0
[131] png_0.1-7 BiocVersion_3.14.0
[133] bluster_1.4.0 bit_4.0.4
[135] stringi_1.7.6 sass_0.4.0
[137] HDF5Array_1.22.1 blob_1.2.2
[139] AnnotationHub_3.2.0 BiocSingular_1.10.0
[141] memoise_2.0.1 irlba_2.3.5