2022-07-14_pilot4_analysis
C.B. Azodi
2022-07-15
Last updated: 2022-07-15
Checks: 5 2
Knit directory:
BAUH_2020_MND-single-cell/analysis/
This reproducible R Markdown analysis was created with workflowr (version 1.6.2). The Checks tab describes the reproducibility checks that were applied when the results were created. The Past versions tab lists the development history.
The R Markdown is untracked by Git. To know which version of the R
Markdown file created these results, you’ll want to first commit it to
the Git repo. If you’re still working on the analysis, you can ignore
this warning. When you’re finished, you can run
wflow_publish to commit the R Markdown file and build the
HTML.
Great job! The global environment was empty. Objects defined in the global environment can affect the analysis in your R Markdown file in unknown ways. For reproduciblity it’s best to always run the code in an empty environment.
The command set.seed(12345) was run prior to running the
code in the R Markdown file. Setting a seed ensures that any results
that rely on randomness, e.g. subsampling or permutations, are
reproducible.
Great job! Recording the operating system, R version, and package versions is critical for reproducibility.
Nice! There were no cached chunks for this analysis, so you can be confident that you successfully produced the results during this run.
Using absolute paths to the files within your workflowr project makes it difficult for you and others to run your code on a different machine. Change the absolute path(s) below to the suggested relative path(s) to make your code more reproducible.
| absolute | relative |
|---|---|
| /mnt/beegfs/mccarthy/backed_up/general/cazodi/Projects/BAUH_2020_MND-single-cell/output/pilot3.0_iPSC/ | ../output/pilot3.0_iPSC |
| /mnt/beegfs/mccarthy/backed_up/general/cazodi/Projects/BAUH_2020_MND-single-cell/output/pilot4.0_iPSC/ | ../output/pilot4.0_iPSC |
| /mnt/beegfs/mccarthy/backed_up/general/cazodi/Projects/BAUH_2020_MND-single-cell/output/pilot4.0_nuclei/ | ../output/pilot4.0_nuclei |
| /mnt/beegfs/mccarthy/backed_up/general/cazodi/Projects/BAUH_2020_MND-single-cell/output/pilot4.0_iPSC_incIntrons/ | ../output/pilot4.0_iPSC_incIntrons |
| /mnt/beegfs/mccarthy/backed_up/general/cazodi/Projects/BAUH_2020_MND-single-cell/output/pilot4.0_nuclei_incIntrons/ | ../output/pilot4.0_nuclei_incIntrons |
Great! You are using Git for version control. Tracking code development and connecting the code version to the results is critical for reproducibility.
The results in this page were generated with repository version feed601. See the Past versions tab to see a history of the changes made to the R Markdown and HTML files.
Note that you need to be careful to ensure that all relevant files for
the analysis have been committed to Git prior to generating the results
(you can use wflow_publish or
wflow_git_commit). workflowr only checks the R Markdown
file, but you know if there are other scripts or data files that it
depends on. Below is the status of the Git repository when the results
were generated:
Ignored files:
    Ignored:    .RData
    Ignored:    .Rhistory
    Ignored:    .Rproj.user/
    Ignored:    .cache/
    Ignored:    .config/
    Ignored:    .snakemake/
    Ignored:    20220422_tSNE_plots.pdf
    Ignored:    BAUH_2020_MND-single-cell.Rproj
    Ignored:    GRCh38_turboGFP-RFP_reference/
    Ignored:    Homo_sapiens.GRCh38.turboGFP/
    Ignored:    Rplots.pdf
    Ignored:    analysis/2022-04-22_pilot2_CelltypeAbundance.pdf
    Ignored:    code/.ipynb_checkpoints/
    Ignored:    data/1-s2.0-S0002929720300781-main.pdf
    Ignored:    data/2103.11251.pdf
    Ignored:    data/3M-february-2018.txt
    Ignored:    data/737K-august-2016.txt
    Ignored:    data/Cellecta-SEQ-CloneTracker-XP_14bp_barcodes.txt
    Ignored:    data/Cellecta-SEQ-CloneTracker-XP_30bp_barcodes.txt
    Ignored:    data/STAR_index/
    Ignored:    data/STAR_output/
    Ignored:    data/donor_metadata.txt
    Ignored:    data/genome1K.phase3.SNP_AF5e2.chr1toX.hg38.log
    Ignored:    data/genome1K.phase3.SNP_AF5e2.chr1toX.hg38.recode.sort.vcf.gz
    Ignored:    data/genome1K.phase3.SNP_AF5e2.chr1toX.hg38.recode.sort.vcf.gz.csi
    Ignored:    data/genome1K.phase3.SNP_AF5e2.chr1toX.hg38.recode.vcf.gz
    Ignored:    data/genome1K.phase3.SNP_AF5e2.chr1toX.hg38.sort.vcf.gz
    Ignored:    data/genome1K.phase3.SNP_AF5e2.chr1toX.hg38.sort.vcf.gz.csi
    Ignored:    data/genome1K.phase3.SNP_AF5e2.chr1toX.hg38.vcf.gz
    Ignored:    data/genome1k.chr22.log
    Ignored:    data/genome1k.chr22.recode.vcf
    Ignored:    data/pilot2_donors.txt
    Ignored:    data/pilot3_aggr-experiments.csv
    Ignored:    data/pilot3_donors.txt
    Ignored:    data/pilot3_lenti_barcodes_capture5_poolA_D42pass.txt
    Ignored:    data/s41588-018-0268-8.pdf
    Ignored:    data/tr2g_hs.tsv
    Ignored:    logs/
    Ignored:    output/2021-04-27_pilot2_nCells-per-donor.pdf
    Ignored:    output/2021-08-03_pilot2_nCells-per-donor.pdf
    Ignored:    output/CB-scRNAv31-GEX-lib01_QC_metadata.txt
    Ignored:    output/CB-scRNAv31-GEX-lib02_QC_metadata.txt
    Ignored:    output/pilot1_starsoloED/
    Ignored:    output/pilot2.1_gex/
    Ignored:    output/pilot2_HTO-2/
    Ignored:    output/pilot2_HTO/
    Ignored:    output/pilot2_gex_MAF01-152/
    Ignored:    output/pilot2_gex_MAF01/
    Ignored:    output/pilot2_gex_starsolo/
    Ignored:    output/pilot2_gex_starsoloED_GFP/
    Ignored:    output/pilot3.0_MN/
    Ignored:    output/pilot3.0_iPSC/
    Ignored:    output/pilot3.1_iPSC/
    Ignored:    output/pilot3_Lenti/
    Ignored:    output/pilot4.0_iPSC/
    Ignored:    output/pilot4.0_iPSC_incIntrons/
    Ignored:    output/pilot4.0_nuclei/
    Ignored:    output/pilot4.0_nuclei_incIntrons/
    Ignored:    references/Homo_sapiens.GRCh38.turboGFP.bed
    Ignored:    references/Homo_sapiens.GRCh38.turboGFP.fa
    Ignored:    references/Homo_sapiens.GRCh38.turboGFP.fa.fai
    Ignored:    references/Homo_sapiens.GRCh38.turboGFP.filtered.gtf
    Ignored:    references/Homo_sapiens.GRCh38.turboGFP.gtf
    Ignored:    references/Homo_sapiens.GRCh38.turboGFP_gene.gtf
    Ignored:    references/SAindex/
    Ignored:    references/allen_brain_reference/
    Ignored:    references/geno_test.vcf.gz
    Ignored:    references/pilot3/
    Ignored:    references/pilot3_20220330/
    Ignored:    references/pilot4/
    Ignored:    references/test
    Ignored:    references/turboGFP.fa
    Ignored:    references/turboGFP.gtf
    Ignored:    references/turboRFP.fa
    Ignored:    workflow/rules/

Untracked files:
    Untracked:  .nv/
    Untracked:  analysis/2022-07-14_pilot4_analysis.Rmd
    Untracked:  analysis/figure/
    Untracked:  cellbender.dockerfile
    Untracked:  config/config_pilot4.0_iPSC.yml
    Untracked:  config/config_pilot4.0_nuclei.yml
    Untracked:  hwe1e-05_maf05_vcf_stats.txt
    Untracked:  hwe1e-05_vcf_stats.txt
    Untracked:  workflow/Snakefile_simple.smk

Unstaged changes:
    Modified:   analysis/2022-05-03_pilot3_Cell-demultiplexing-Lenti.Rmd
    Modified:   config/config_pilot3.0_MN.yml
    Modified:   config/config_pilot3.0_iPSC.yml
    Modified:   workflow/demuxlet_jobs/demux_capture5.sh
    Modified:   workflow/rules_demultiplexing.smk
    Modified:   workflow/rules_prepare-genotype-data.smk
Note that any generated files, e.g. HTML, png, CSS, etc., are not included in this status report because it is ok for generated content to have uncommitted changes.
There are no past versions. Publish this analysis with
wflow_publish() to start tracking its development.
Cellranger stats
Cellranger generated web summaries are available for iPSCs and nuclei. I noticed my cellranger results differed from the WEHI results in that they use the intron_mode where intronic reads are included in the count matrix, this shouldn’t have a major impact on donor assignment, but may impact cell calling, so I’ve run the analysis in both modes. Here are the cellranger summary stats:
cr_stats_files <- c(paste0(p3_ipsc, "01_cellcalling-cellRanger/Capture5-GEX/outs/metrics_summary.csv"),
                    paste0(p4_ipsc, "01_cellRanger/C099_iPSC_GEX/outs/metrics_summary.csv"),
                    paste0(p4_nucl, "01_cellRanger/C099_nuclei_GEX/outs/metrics_summary.csv"),
                    paste0(p4_ipsc_Int, "01_cellRanger/C099_iPSC_GEX/outs/metrics_summary.csv"),
                    paste0(p4_nucl_Int, "01_cellRanger/C099_nuclei_GEX/outs/metrics_summary.csv"))

cr_stats <- t(vroom(cr_stats_files, show_col_types = FALSE))
colnames(cr_stats) <- c("p3_iPSC", "p4_iPSC", "p4_nuclei", "p4_iPSC_Int", "p4_nuclei_Int")
cr_stats
p3_iPSC p4_iPSC
Estimated Number of Cells "45971" "16924"
Mean Reads per Cell "14053" "11366"
Median Genes per Cell "2045" "1637"
Number of Reads "646007925" "192362267"
Valid Barcodes "97.8%" "96.8%"
Sequencing Saturation "22.1%" "20.4%"
Q30 Bases in Barcode "95.9%" "95.5%"
Q30 Bases in RNA Read "94.7%" "94.2%"
Q30 Bases in UMI "95.4%" "95.0%"
Reads Mapped to Genome "97.1%" "97.6%"
Reads Mapped Confidently to Genome "94.2%" "94.2%"
Reads Mapped Confidently to Intergenic Regions "5.1%" "4.7%"
Reads Mapped Confidently to Intronic Regions "28.6%" "21.2%"
Reads Mapped Confidently to Exonic Regions "60.5%" "68.3%"
Reads Mapped Confidently to Transcriptome "55.9%" "62.8%"
Reads Mapped Antisense to Gene "2.1%" "2.5%"
Fraction Reads in Cells "92.8%" "68.4%"
Total Genes Detected "26702" "23705"
Median UMI Counts per Cell "4779" "3617"
p4_nuclei p4_iPSC_Int
Estimated Number of Cells "16006" "18252"
Mean Reads per Cell "12537" "10539"
Median Genes per Cell " 558" "2214"
Number of Reads "200665646" "192362267"
Valid Barcodes "96.3%" "96.8%"
Sequencing Saturation "25.0%" "20.5%"
Q30 Bases in Barcode "95.4%" "95.5%"
Q30 Bases in RNA Read "93.9%" "94.2%"
Q30 Bases in UMI "95.0%" "95.0%"
Reads Mapped to Genome "96.3%" "97.6%"
Reads Mapped Confidently to Genome "90.5%" "94.2%"
Reads Mapped Confidently to Intergenic Regions "8.0%" "4.7%"
Reads Mapped Confidently to Intronic Regions "63.4%" "21.2%"
Reads Mapped Confidently to Exonic Regions "19.2%" "68.3%"
Reads Mapped Confidently to Transcriptome "15.2%" "76.5%"
Reads Mapped Antisense to Gene "2.6%" "10.6%"
Fraction Reads in Cells "48.9%" "72.2%"
Total Genes Detected "23964" "27775"
Median UMI Counts per Cell " 628" "4393"
p4_nuclei_Int
Estimated Number of Cells "15431"
Mean Reads per Cell "13004"
Median Genes per Cell "1994"
Number of Reads "200665646"
Valid Barcodes "96.3%"
Sequencing Saturation "25.1%"
Q30 Bases in Barcode "95.4%"
Q30 Bases in RNA Read "93.9%"
Q30 Bases in UMI "95.0%"
Reads Mapped to Genome "96.3%"
Reads Mapped Confidently to Genome "90.5%"
Reads Mapped Confidently to Intergenic Regions "8.0%"
Reads Mapped Confidently to Intronic Regions "63.4%"
Reads Mapped Confidently to Exonic Regions "19.2%"
Reads Mapped Confidently to Transcriptome "55.6%"
Reads Mapped Antisense to Gene "25.3%"
Fraction Reads in Cells "57.0%"
Total Genes Detected "28373"
Median UMI Counts per Cell "2722" Donor demultiplexing
Pilot 3 vs 4
Summary of the number of cells called as singlets, doublets, or unassigned using the optimized vireo approach (donor 197 separated):
vireo_donor_files <- c(paste0(p3_ipsc, "03_vireo-TX/Capture5-GEX/donor_ids.tsv"),
                       paste0(p4_ipsc, "03_vireo-TX/C099_iPSC_GEX/donor_ids.tsv"),
                       paste0(p4_nucl, "03_vireo-TX/C099_nuclei_GEX/donor_ids.tsv"),
                       paste0(p4_ipsc_Int, "03_vireo-TX/C099_iPSC_GEX/donor_ids.tsv"),
                       paste0(p4_nucl_Int, "03_vireo-TX/C099_nuclei_GEX/donor_ids.tsv"))

vireo_donors <- vroom(vireo_donor_files, id="path", show_col_types = FALSE) %>%
  mutate(id = basename(dirname(path)),
         experiment = ifelse(id == "Capture5-GEX", "p3_iPSC",
                             ifelse(id == "C099_iPSC_GEX", "p4_iPSC", "p4_nuclei")),
         experiment = ifelse(grepl("incIntrons", path), paste0(experiment, "_Int"), experiment))

vireo_donors <- vireo_donors %>%
  mutate(status = ifelse(donor_id=="unassigned", "unassigned",
                         ifelse(donor_id=="doublet", "doublet",
                                ifelse(donor_id==197, "d197", "non_197_singlets"))))


as.data.frame(table(vireo_donors$experiment, vireo_donors$status)) %>%
  pivot_wider(id_cols = Var1, names_from = Var2, values_from = Freq) %>%
  mutate(singlets = d197+non_197_singlets) %>%
  dplyr::select(ID=Var1, d197, singlets, non_197_singlets, doublet, unassigned)
# A tibble: 5 × 6
ID d197 singlets non_197_singlets doublet unassigned
<fct> <int> <int> <int> <int> <int>
1 p3_iPSC 7720 17435 9715 6162 10825
2 p4_iPSC 1694 10366 8672 553 6005
3 p4_iPSC_Int 1697 10358 8661 543 7351
4 p4_nuclei 1836 10136 8300 434 5436
5 p4_nuclei_Int 1848 10196 8348 423 4812While the degree to which donor 197 cells are dominating the sample is reduced, it is still by far the most abundant donor and there was not a notable increase in the number of cells assigned to other donors. Across the 141 donors, the change in the number of cells assigned to each donor by vireo ranged from -6026 (donor 197, more in pilot 3) to +301 (donor W132), with a median +3:
vireo_donor_stats <- vireo_donors %>%
  group_by(experiment, donor_id) %>% tally() %>%
  pivot_wider(id_cols=donor_id, names_from=experiment, values_from = n) %>%
  replace(is.na(.), 0) %>% mutate(delta = p4_iPSC - p3_iPSC) %>% arrange(-p3_iPSC)

summary(vireo_donor_stats[!(vireo_donor_stats$donor_id %in% c("unassigned", "doublet")), ]$delta)
Min. 1st Qu. Median Mean 3rd Qu. Max.
-6026.00 -1.00 3.00 -48.75 18.00 301.00 After removing 129, 197, unassigned, and doublets, there was no significant change in the number of cells assigned:
vireo_donor_stats_subset <- vireo_donor_stats %>% dplyr::select(-delta) %>%
  filter(!donor_id %in% c(197, 129, "doublet")) %>% pivot_longer(-donor_id)

fit <- lm(value ~ name, data = vireo_donor_stats_subset)
round(summary(fit)$coefficients, 3)
Estimate Std. Error t value Pr(>|t|)
(Intercept) 119.590 50.800 2.354 0.019
namep4_iPSC -21.687 71.842 -0.302 0.763
namep4_iPSC_Int -12.417 71.842 -0.173 0.863
namep4_nuclei -27.153 71.842 -0.378 0.706
namep4_nuclei_Int -31.146 71.842 -0.434 0.665p1 <- ggscatter(vireo_donor_stats, x = "p3_iPSC", y = "p4_iPSC", color="delta",
label = "donor_id", repel = TRUE, xlim=c(0, 11000), ylim=c(0,11000),
add = "reg.line", add.params = list(color = "blue"),
cor.coef = TRUE, cor.coeff.args = list(method = "pearson")) + geom_abline() +
scale_colour_gradient2(mid = "gray")
p2 <- vireo_donor_stats %>% filter(!donor_id %in% c(197, 129, "doublet", "unassigned")) %>%
ggscatter(x = "p3_iPSC", y = "p4_iPSC", color="delta",
label = "donor_id", repel = TRUE, add = "reg.line",
add.params = list(color = "blue"),
cor.coef = TRUE, cor.coeff.args = list(method = "pearson")) + geom_abline() +
scale_colour_gradient2(mid = "gray")
p3 <- ggscatter(vireo_donor_stats, x = "p3_iPSC", y = "p4_nuclei", color="delta",
label = "donor_id", repel = TRUE, xlim=c(0, 11000), ylim=c(0,11000),
add = "reg.line", add.params = list(color = "blue"),
cor.coef = TRUE, cor.coeff.args = list(method = "pearson")) + geom_abline() +
scale_colour_gradient2(mid = "gray")
p4 <- vireo_donor_stats %>% filter(!donor_id %in% c(197, 129, "doublet", "unassigned")) %>%
ggscatter(x = "p3_iPSC", y = "p4_nuclei", color="delta",
label = "donor_id", repel = TRUE, add = "reg.line",
add.params = list(color = "blue"),
cor.coef = TRUE, cor.coeff.args = list(method = "pearson")) + geom_abline() +
scale_colour_gradient2(mid = "gray")
plot_grid(p1, p2, p3, p4, labels="auto")`geom_smooth()` using formula 'y ~ x'
`geom_smooth()` using formula 'y ~ x'
`geom_smooth()` using formula 'y ~ x'
`geom_smooth()` using formula 'y ~ x'Warning: ggrepel: 143 unlabeled data points (too many overlaps). Consider
increasing max.overlapsWarning: ggrepel: 131 unlabeled data points (too many overlaps). Consider
increasing max.overlapsWarning: ggrepel: 143 unlabeled data points (too many overlaps). Consider
increasing max.overlapsWarning: ggrepel: 130 unlabeled data points (too many overlaps). Consider
increasing max.overlaps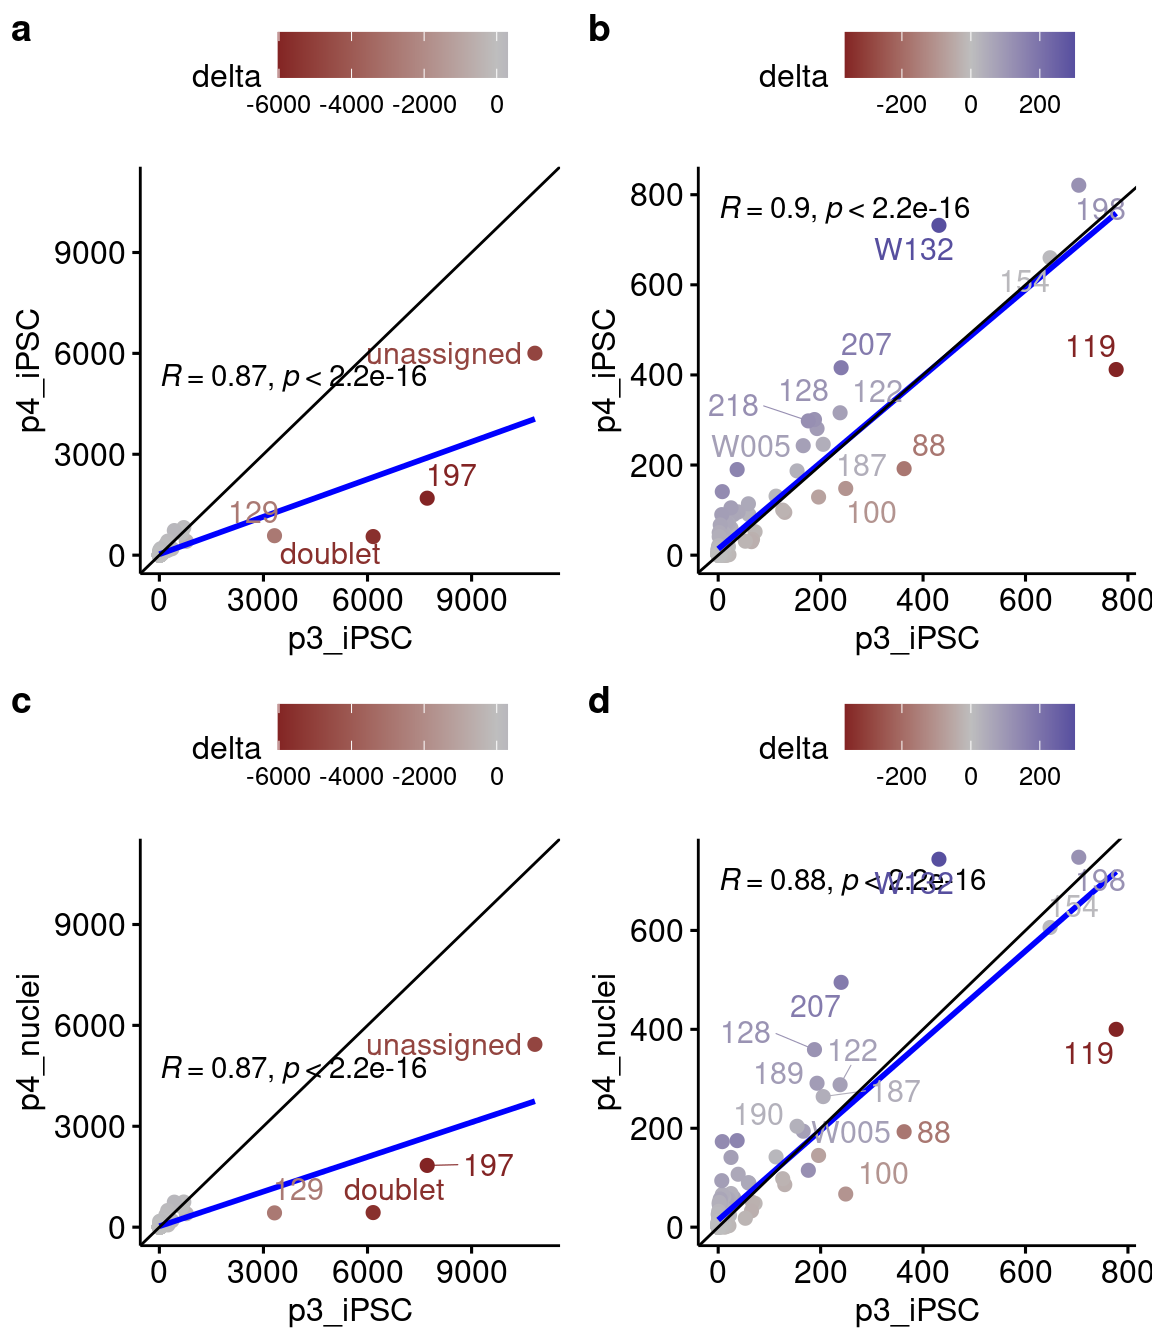
Number of cells assigned to each donor by vireo for iPS cells in pilot 3 (x-axis) v. pilot 4 (y-axis) (a/b) iPSCs and nuclei (c/d), with (a/c) all vireo calls and (b/d) with donors 197, 129, and unassigned and doublets removed.
Detailed vireo donor assignments sorted by pilot 3 iPSCs, colored by relative abundance of each donor:
vireo_donor_stats[, 1:6] %>% knitr::kable() %>%
  column_spec(2, color = "white", background = spec_color(log10(1+vireo_donor_stats$p3_iPSC))) %>%
  column_spec(3, color = "white", background = spec_color(log10(1+vireo_donor_stats$p4_iPSC))) %>%
  column_spec(4, color = "white", background = spec_color(log10(1+vireo_donor_stats$p4_nuclei))) %>%
  column_spec(5, color = "white", background = spec_color(log10(1+vireo_donor_stats$p4_iPSC_Int))) %>%
column_spec(6, color = "white", background = spec_color(log10(1+vireo_donor_stats$p4_nuclei_Int)))| donor_id | p3_iPSC | p4_iPSC | p4_iPSC_Int | p4_nuclei | p4_nuclei_Int |
|---|---|---|---|---|---|
| unassigned | 10825 | 6005 | 7351 | 5436 | 4812 |
| 197 | 7720 | 1694 | 1697 | 1836 | 1848 |
| doublet | 6162 | 553 | 543 | 434 | 423 |
| 129 | 3319 | 579 | 579 | 425 | 424 |
| 119 | 777 | 412 | 409 | 400 | 400 |
| 198 | 704 | 821 | 818 | 748 | 755 |
| 154 | 648 | 660 | 659 | 606 | 613 |
| W132 | 431 | 732 | 735 | 744 | 750 |
| 88 | 363 | 192 | 192 | 193 | 192 |
| 100 | 249 | 148 | 146 | 67 | 68 |
| 207 | 240 | 416 | 412 | 495 | 506 |
| 122 | 238 | 316 | 318 | 288 | 289 |
| 187 | 205 | 246 | 247 | 264 | 267 |
| W187 | 196 | 129 | 127 | 145 | 148 |
| 189 | 193 | 281 | 277 | 291 | 296 |
| 128 | 188 | 301 | 304 | 359 | 363 |
| 218 | 176 | 298 | 302 | 115 | 116 |
| W005 | 166 | 243 | 244 | 194 | 193 |
| 190 | 154 | 187 | 188 | 204 | 205 |
| 210 | 130 | 95 | 96 | 86 | 87 |
| 104 | 126 | 100 | 101 | 98 | 99 |
| 192 | 113 | 131 | 132 | 142 | 142 |
| 127 | 72 | 52 | 51 | 48 | 48 |
| 107 | 67 | 35 | 33 | 50 | 50 |
| 237 | 65 | 30 | 30 | 33 | 33 |
| 214 | 60 | 90 | 91 | 89 | 89 |
| 102 | 59 | 114 | 111 | 90 | 91 |
| 92 | 53 | 31 | 30 | 18 | 19 |
| W014 | 39 | 96 | 96 | 107 | 105 |
| 227 | 37 | 190 | 191 | 175 | 174 |
| 123 | 30 | 90 | 90 | 60 | 62 |
| 194 | 25 | 60 | 60 | 68 | 69 |
| 221 | 25 | 105 | 106 | 141 | 146 |
| 76 | 22 | 42 | 42 | 24 | 24 |
| 238 | 21 | 45 | 44 | 38 | 39 |
| donor147 | 21 | 1 | 2 | 3 | 4 |
| 105 | 20 | 19 | 20 | 24 | 24 |
| 196 | 20 | 70 | 71 | 57 | 56 |
| W112 | 19 | 32 | 32 | 21 | 21 |
| donor139 | 18 | 2 | 1 | 4 | 2 |
| donor144 | 18 | 1 | 0 | 3 | 2 |
| T234 | 17 | 4 | 5 | 9 | 8 |
| 220 | 16 | 72 | 70 | 56 | 56 |
| donor145 | 16 | 0 | 1 | 5 | 0 |
| donor137 | 15 | 0 | 1 | 1 | 3 |
| donor149 | 15 | 1 | 1 | 5 | 1 |
| 124 | 14 | 36 | 37 | 29 | 30 |
| 131 | 14 | 31 | 29 | 34 | 33 |
| 231 | 12 | 2 | 2 | 0 | 0 |
| donor140 | 12 | 1 | 0 | 6 | 3 |
| donor146 | 12 | 0 | 2 | 3 | 3 |
| W222 | 12 | 1 | 1 | 2 | 2 |
| 118 | 11 | 48 | 49 | 61 | 61 |
| 93 | 11 | 11 | 11 | 24 | 25 |
| donor141 | 11 | 1 | 1 | 4 | 2 |
| 113 | 10 | 44 | 44 | 39 | 39 |
| donor142 | 10 | 0 | 0 | 7 | 3 |
| donor143 | 10 | 1 | 0 | 2 | 4 |
| 240 | 9 | 9 | 10 | 21 | 21 |
| donor136 | 9 | 1 | 2 | 4 | 4 |
| donor148 | 9 | 1 | 0 | 5 | 1 |
| 208 | 8 | 11 | 10 | 6 | 6 |
| 797 | 8 | 141 | 139 | 173 | 174 |
| donor138 | 8 | 2 | 0 | 2 | 1 |
| W162 | 8 | 51 | 50 | 19 | 19 |
| W263 | 8 | 51 | 51 | 66 | 66 |
| 121 | 7 | 17 | 19 | 20 | 20 |
| 130 | 7 | 90 | 89 | 94 | 96 |
| T233 | 7 | 0 | 1 | 2 | 1 |
| W104 | 6 | 37 | 34 | 29 | 29 |
| W134 | 6 | 25 | 26 | 26 | 27 |
| 145 | 5 | 0 | 0 | 0 | 0 |
| 188 | 5 | 11 | 11 | 10 | 10 |
| 217 | 5 | 52 | 52 | 49 | 51 |
| 90 | 5 | 10 | 10 | 8 | 8 |
| 110 | 4 | 18 | 18 | 14 | 15 |
| 239 | 4 | 8 | 8 | 3 | 2 |
| 74 | 4 | 7 | 7 | 8 | 8 |
| 75 | 4 | 0 | 1 | 1 | 1 |
| 82 | 4 | 9 | 9 | 16 | 16 |
| 99 | 4 | 67 | 65 | 57 | 60 |
| W001 | 4 | 26 | 24 | 30 | 29 |
| 138 | 3 | 3 | 4 | 6 | 6 |
| 142 | 3 | 6 | 5 | 14 | 14 |
| 146 | 3 | 9 | 9 | 1 | 1 |
| T232 | 3 | 8 | 8 | 4 | 4 |
| 186 | 2 | 3 | 3 | 10 | 10 |
| 191 | 2 | 13 | 13 | 14 | 15 |
| 200 | 2 | 4 | 4 | 9 | 9 |
| 202 | 2 | 50 | 48 | 46 | 45 |
| 796 | 2 | 3 | 3 | 8 | 9 |
| 84 | 2 | 41 | 41 | 50 | 51 |
| 87 | 2 | 17 | 17 | 21 | 22 |
| W221 | 2 | 15 | 14 | 15 | 15 |
| 101 | 1 | 8 | 8 | 8 | 9 |
| 120 | 1 | 0 | 0 | 2 | 2 |
| 141 | 1 | 2 | 1 | 2 | 1 |
| 199 | 1 | 9 | 8 | 7 | 7 |
| 232 | 1 | 2 | 2 | 2 | 2 |
| 723 | 1 | 0 | 0 | 0 | 0 |
| 745 | 1 | 10 | 10 | 12 | 12 |
| 750 | 1 | 17 | 17 | 20 | 22 |
| 78 | 1 | 3 | 3 | 3 | 3 |
| 89 | 1 | 10 | 10 | 2 | 2 |
| W058 | 1 | 1 | 2 | 4 | 4 |
| W093 | 1 | 0 | 1 | 0 | 0 |
| W103 | 1 | 21 | 21 | 32 | 32 |
| W113 | 1 | 0 | 0 | 3 | 3 |
| 106 | 0 | 1 | 1 | 0 | 0 |
| 108 | 0 | 2 | 2 | 1 | 1 |
| 111 | 0 | 1 | 1 | 1 | 1 |
| 112 | 0 | 3 | 3 | 3 | 3 |
| 114 | 0 | 15 | 15 | 26 | 26 |
| 117 | 0 | 1 | 2 | 0 | 0 |
| 126 | 0 | 1 | 1 | 0 | 0 |
| 139 | 0 | 5 | 5 | 0 | 1 |
| 144 | 0 | 1 | 1 | 4 | 4 |
| 152 | 0 | 6 | 7 | 5 | 5 |
| 155 | 0 | 6 | 6 | 9 | 9 |
| 182 | 0 | 3 | 3 | 2 | 3 |
| 183 | 0 | 1 | 1 | 3 | 3 |
| 184 | 0 | 13 | 13 | 8 | 8 |
| 195 | 0 | 12 | 12 | 4 | 4 |
| 209 | 0 | 6 | 7 | 4 | 4 |
| 215 | 0 | 8 | 9 | 10 | 10 |
| 216 | 0 | 2 | 2 | 1 | 1 |
| 219 | 0 | 3 | 3 | 1 | 1 |
| 228 | 0 | 4 | 3 | 4 | 4 |
| 235 | 0 | 1 | 2 | 1 | 1 |
| 739 | 0 | 1 | 1 | 3 | 3 |
| 751 | 0 | 1 | 0 | 1 | 1 |
| 77 | 0 | 5 | 5 | 11 | 9 |
| 79 | 0 | 1 | 1 | 2 | 2 |
| 795 | 0 | 11 | 11 | 8 | 8 |
| 81 | 0 | 1 | 1 | 0 | 0 |
| 86 | 0 | 1 | 2 | 2 | 2 |
| 91 | 0 | 1 | 1 | 2 | 2 |
| 98 | 0 | 2 | 1 | 2 | 2 |
| T181 | 0 | 2 | 2 | 0 | 0 |
| T235 | 0 | 1 | 1 | 0 | 0 |
| W164 | 0 | 5 | 5 | 5 | 6 |
| W220 | 0 | 1 | 1 | 0 | 0 |
| 116 | 0 | 0 | 1 | 0 | 0 |
| 125 | 0 | 0 | 0 | 7 | 7 |
| 234 | 0 | 0 | 0 | 4 | 4 |
| 83 | 0 | 0 | 0 | 1 | 1 |
| W069 | 0 | 0 | 0 | 3 | 3 |
sessionInfo()R version 4.1.1 (2021-08-10)
Platform: x86_64-pc-linux-gnu (64-bit)
Running under: Rocky Linux 8.5 (Green Obsidian)
Matrix products: default
BLAS/LAPACK: /usr/lib64/libopenblasp-r0.3.12.so
locale:
[1] LC_CTYPE=en_AU.UTF-8 LC_NUMERIC=C
[3] LC_TIME=en_AU.UTF-8 LC_COLLATE=en_AU.UTF-8
[5] LC_MONETARY=en_AU.UTF-8 LC_MESSAGES=en_AU.UTF-8
[7] LC_PAPER=en_AU.UTF-8 LC_NAME=C
[9] LC_ADDRESS=C LC_TELEPHONE=C
[11] LC_MEASUREMENT=en_AU.UTF-8 LC_IDENTIFICATION=C
attached base packages:
[1] stats graphics grDevices utils datasets methods base
other attached packages:
[1] kableExtra_1.3.4 vroom_1.5.7 viridis_0.6.2 viridisLite_0.4.0
[5] cowplot_1.1.1 ggpubr_0.4.0 ggplot2_3.3.6 data.table_1.14.2
[9] tidyr_1.2.0 dplyr_1.0.9
loaded via a namespace (and not attached):
[1] ggrepel_0.9.1 Rcpp_1.0.9 lattice_0.20-45 svglite_2.1.0
[5] assertthat_0.2.1 rprojroot_2.0.2 digest_0.6.29 utf8_1.2.2
[9] R6_2.5.1 backports_1.4.1 evaluate_0.15 httr_1.4.3
[13] highr_0.9 pillar_1.7.0 rlang_1.0.4 rstudioapi_0.13
[17] car_3.0-12 jquerylib_0.1.4 Matrix_1.4-0 rmarkdown_2.11
[21] labeling_0.4.2 splines_4.1.1 webshot_0.5.2 stringr_1.4.0
[25] bit_4.0.4 munsell_0.5.0 broom_0.7.10 compiler_4.1.1
[29] httpuv_1.6.5 xfun_0.30 systemfonts_1.0.4 pkgconfig_2.0.3
[33] mgcv_1.8-39 htmltools_0.5.2 tidyselect_1.1.2 tibble_3.1.7
[37] gridExtra_2.3 workflowr_1.6.2 fansi_1.0.3 crayon_1.5.1
[41] tzdb_0.2.0 withr_2.5.0 later_1.3.0 grid_4.1.1
[45] nlme_3.1-152 jsonlite_1.8.0 gtable_0.3.0 lifecycle_1.0.1
[49] DBI_1.1.3 git2r_0.29.0 magrittr_2.0.3 scales_1.2.0
[53] cli_3.3.0 stringi_1.7.8 carData_3.0-5 farver_2.1.1
[57] ggsignif_0.6.3 fs_1.5.2 promises_1.2.0.1 xml2_1.3.3
[61] bslib_0.3.1 ellipsis_0.3.2 generics_0.1.3 vctrs_0.4.1
[65] tools_4.1.1 bit64_4.0.5 glue_1.6.2 purrr_0.3.4
[69] parallel_4.1.1 abind_1.4-5 fastmap_1.1.0 yaml_2.3.5
[73] colorspace_2.0-3 rstatix_0.7.0 rvest_1.0.2 knitr_1.37
[77] sass_0.4.0