Predictive performannce
Last updated: 2024-01-01
Checks: 7 0
Knit directory:
mage_2020_marker-gene-benchmarking/
This reproducible R Markdown analysis was created with workflowr (version 1.7.0). The Checks tab describes the reproducibility checks that were applied when the results were created. The Past versions tab lists the development history.
Great! Since the R Markdown file has been committed to the Git repository, you know the exact version of the code that produced these results.
Great job! The global environment was empty. Objects defined in the global environment can affect the analysis in your R Markdown file in unknown ways. For reproduciblity it’s best to always run the code in an empty environment.
The command set.seed(20190102) was run prior to running
the code in the R Markdown file. Setting a seed ensures that any results
that rely on randomness, e.g. subsampling or permutations, are
reproducible.
Great job! Recording the operating system, R version, and package versions is critical for reproducibility.
Nice! There were no cached chunks for this analysis, so you can be confident that you successfully produced the results during this run.
Great job! Using relative paths to the files within your workflowr project makes it easier to run your code on other machines.
Great! You are using Git for version control. Tracking code development and connecting the code version to the results is critical for reproducibility.
The results in this page were generated with repository version 2632193. See the Past versions tab to see a history of the changes made to the R Markdown and HTML files.
Note that you need to be careful to ensure that all relevant files for
the analysis have been committed to Git prior to generating the results
(you can use wflow_publish or
wflow_git_commit). workflowr only checks the R Markdown
file, but you know if there are other scripts or data files that it
depends on. Below is the status of the Git repository when the results
were generated:
Ignored files:
    Ignored:    .Renviron
    Ignored:    .Rhistory
    Ignored:    .Rproj.user/
    Ignored:    .snakemake/
    Ignored:    NSForest/.Rhistory
    Ignored:    NSForest/NS-Forest_v3_Extended_Binary_Markers_Supplmental.csv
    Ignored:    NSForest/NS-Forest_v3_Full_Results.csv
    Ignored:    NSForest/NSForest3_medianValues.csv
    Ignored:    NSForest/NSForest_v3_Final_Result.csv
    Ignored:    NSForest/__pycache__/
    Ignored:    NSForest/data/
    Ignored:    RankCorr/picturedRocks/__pycache__/
    Ignored:    benchmarks/
    Ignored:    config/
    Ignored:    data/cellmarker/
    Ignored:    data/downloaded_data/
    Ignored:    data/expert_annotations/
    Ignored:    data/expert_mgs/
    Ignored:    data/raw_data/
    Ignored:    data/real_data/
    Ignored:    data/sim_data/
    Ignored:    data/sim_mgs/
    Ignored:    data/special_real_data/
    Ignored:    figures/
    Ignored:    logs/
    Ignored:    results/
    Ignored:    weights/

Unstaged changes:
    Deleted:    analysis/expert-mgs-direction.Rmd
    Modified:   smash-fork
Note that any generated files, e.g. HTML, png, CSS, etc., are not included in this status report because it is ok for generated content to have uncommitted changes.
These are the previous versions of the repository in which changes were
made to the R Markdown
(analysis/predictive-performance.Rmd) and HTML
(public/predictive-performance.html) files. If you’ve
configured a remote Git repository (see ?wflow_git_remote),
click on the hyperlinks in the table below to view the files as they
were in that past version.
| File | Version | Author | Date | Message |
|---|---|---|---|---|
| Rmd | 2632193 | Jeffrey Pullin | 2024-01-01 | Implement revisions |
| Rmd | 70dee30 | Jeffrey Pullin | 2023-12-04 | Add new ‘maximum sum’ classifier analysis |
| Rmd | 9487c1e | Jeffrey Pullin | 2023-06-17 | Add draft of dataset characteristic section analysis |
| Rmd | 686c7b2 | Jeffrey Pullin | 2023-06-11 | Add blood datasets to pred-perf comparison |
| Rmd | d3539cb | Jeffrey Pullin | 2023-06-10 | Add ‘blood’ datasets |
| Rmd | 59f00aa | Jeffrey Pullin | 2023-05-14 | Add cell type difficulty analysis |
| html | fcecf65 | Jeffrey Pullin | 2022-09-09 | Build site. |
| Rmd | 0c2eafc | Jeffrey Pullin | 2022-09-09 | Update website |
| html | af96b34 | Jeffrey Pullin | 2022-08-30 | Build site. |
| html | a4e328e | Jeffrey Pullin | 2022-08-29 | Build site. |
| Rmd | 464852e | Jeffrey Pullin | 2022-08-29 | Add SVM classifier |
| html | 0e47874 | Jeffrey Pullin | 2022-05-04 | Build site. |
| html | 8b989e1 | Jeffrey Pullin | 2022-05-02 | Build site. |
| html | 0548273 | Jeffrey Pullin | 2022-05-02 | Build site. |
| Rmd | 50bca7c | Jeffrey Pullin | 2022-05-02 | workflowr::wflow_publish(all = TRUE, republish = TRUE) |
| Rmd | 708cfdd | Jeffrey Pullin | 2022-02-18 | Add first draft of predictive performance comparison |
Aim
To compare the predictive performance of the marker gene sets different methods select.
library(SingleCellExperiment)
library(dplyr)
library(ggplot2)
library(tidyr)
library(class)
library(scater)
library(forcats)
library(purrr)

source(here::here("code", "analysis-utils.R"))
source(here::here("code", "plot-utils.R"))
plot_classifier_metric <- function(data, metric) {
plot_metric <- metric_lookup[metric]
plot_data_label <- dataset_lookup[data$data_id[[1]]]
plot_classifier <- switch(
data$classifier[[1]],
knn = "KNN",
svm = "SVM",
sum_max = "\nMaximum summed expression"
)
# https://github.com/tidyverse/ggplot2/issues/2799
cf <- coord_flip(ylim = c(0.5, 1))
cf$default <- TRUE
plot_data <- data %>%
select(!!sym(metric), pars, method)
rm(data)
# FIXME: Add check of whether `metric` is in data.
plot_data %>%
mutate(
plot_pars = pars_lookup[pars],
plot_method = method_lookup[method]
) %>%
mutate(plot_pars = fct_reorder(factor(plot_pars), !!sym(metric))) %>%
ggplot(aes(x = plot_pars, y = !!sym(metric), colour = plot_method)) +
geom_boxplot() +
package_colour +
cf +
labs(
x = "Method",
colour = "Package",
y = plot_metric,
title = paste0("Multiclass prediction ", plot_data_label, ", ",
plot_metric, ", ", plot_classifier)
) +
theme_bw()
}
plot_confusion_matrix <- function(data, pars) {
plot_data <- dataset_lookup[data$data_id[[1]]]
plot_pars <- pars_lookup[pars]
plot_classifier <- switch(
data$classifier[[1]],
knn = "KNN",
svm = "SVM",
sum = "SUM"
)
data %>%
filter(pars == !!pars) %>%
pull(confusion_mat) %>%
pluck(1) %>%
as_tibble() %>%
ggplot(aes(x = prediction, y = true)) +
geom_tile(aes(fill = n), col = "black") +
geom_text(aes(label = n)) +
scale_fill_gradient(low = "white", high = "forestgreen") +
labs(
x = "Predicted cell type",
y = "True cell type",
fill = "Number of cells",
title = paste0(plot_data, " data, ", plot_pars,
" method, ", plot_classifier)
) +
theme_bw() +
theme(
panel.grid.major = element_blank(),
panel.grid.minor = element_blank(),
panel.border = element_blank(),
axis.ticks.y = element_blank(),
axis.text.x = element_text(angle = 45, vjust = 1, hjust = 1)
)
}pred_perf_data <- retrieve_real_data_parameters() %>%
select(-c(fit_method, covariate, rankby, lambda, test_use, rankby_abs, func,
test.type, pval.type, metric, test.use)) %>%
expand_grid(classifier = c("svm", "knn", "sum_max")) %>%
rowwise() %>%
mutate(
pred_perf_filename = paste0("pred_perf-", data_id, "-", method_name, "-",
classifier, ".rds"),
pred_perf_path = here::here("results", "pred_perf", pred_perf_filename),
pred_perf = list(readRDS(pred_perf_path))
) %>%
select(-data_id) %>%
unnest(pred_perf)Results
pbmc3k
pred_perf_data %>%
  filter(data_id == "pbmc3k", classifier == "knn") %>%
  plot_classifier_metric("median_f1_score")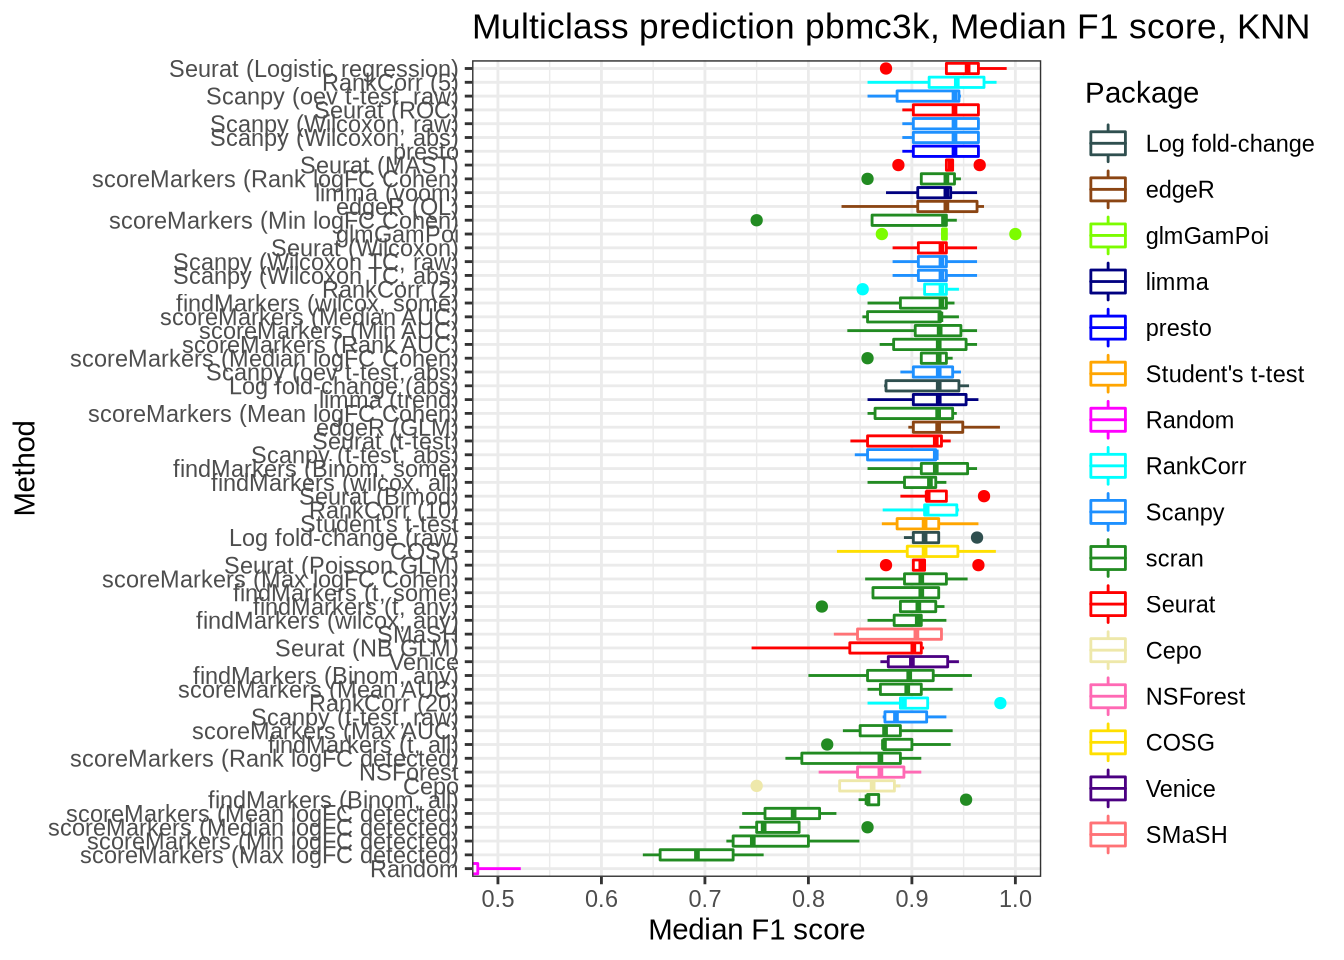
pred_perf_data %>%
  filter(data_id == "pbmc3k", classifier == "svm") %>%
  plot_classifier_metric("median_f1_score")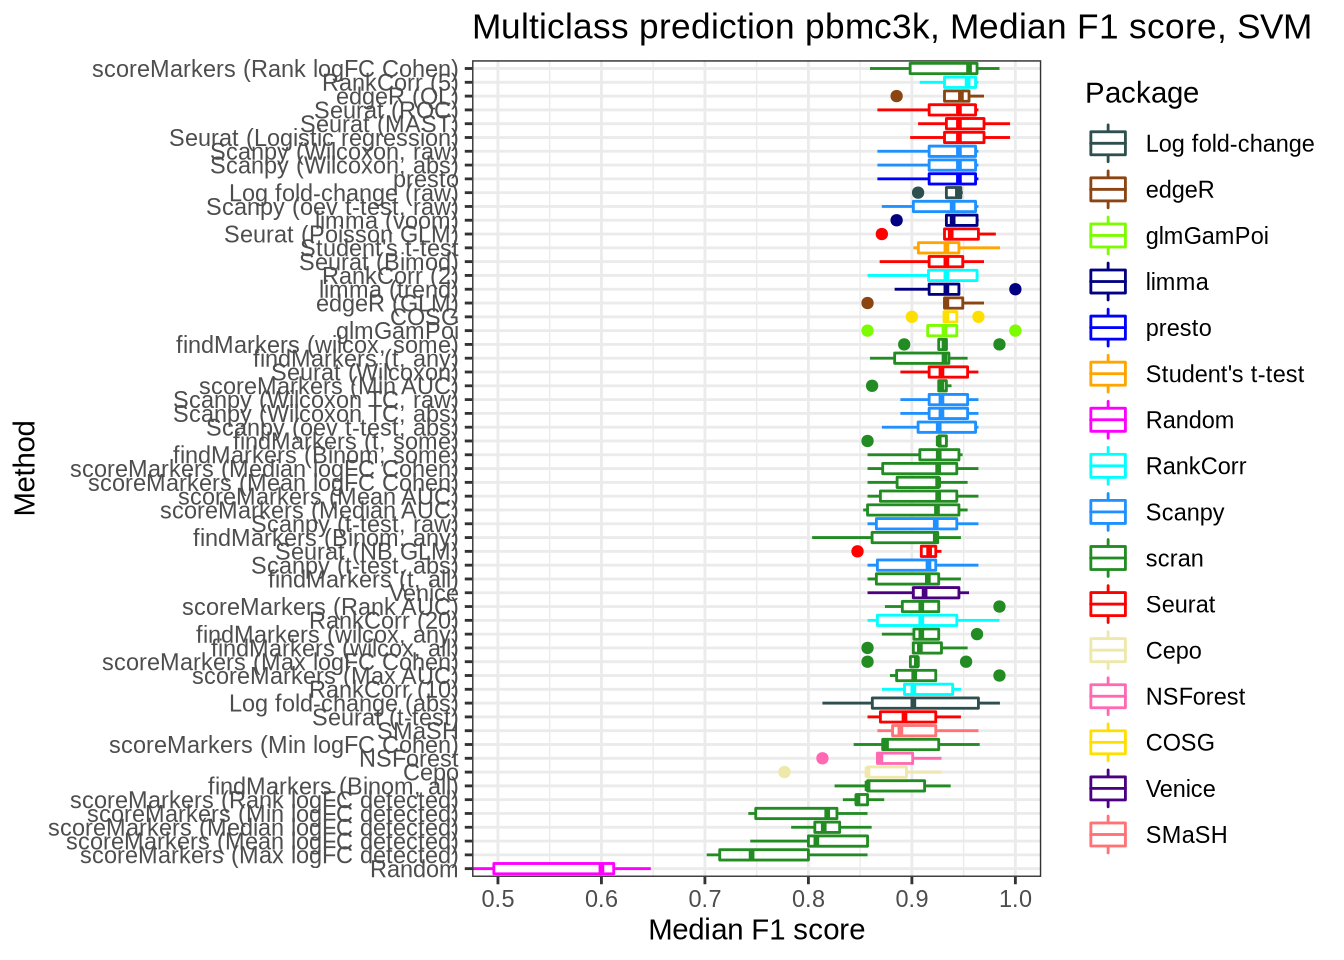
pred_perf_data %>%
  filter(data_id == "pbmc3k", classifier == "sum_max") %>%
  plot_classifier_metric("median_f1_score") +
  coord_flip(ylim = c(0.0, 1))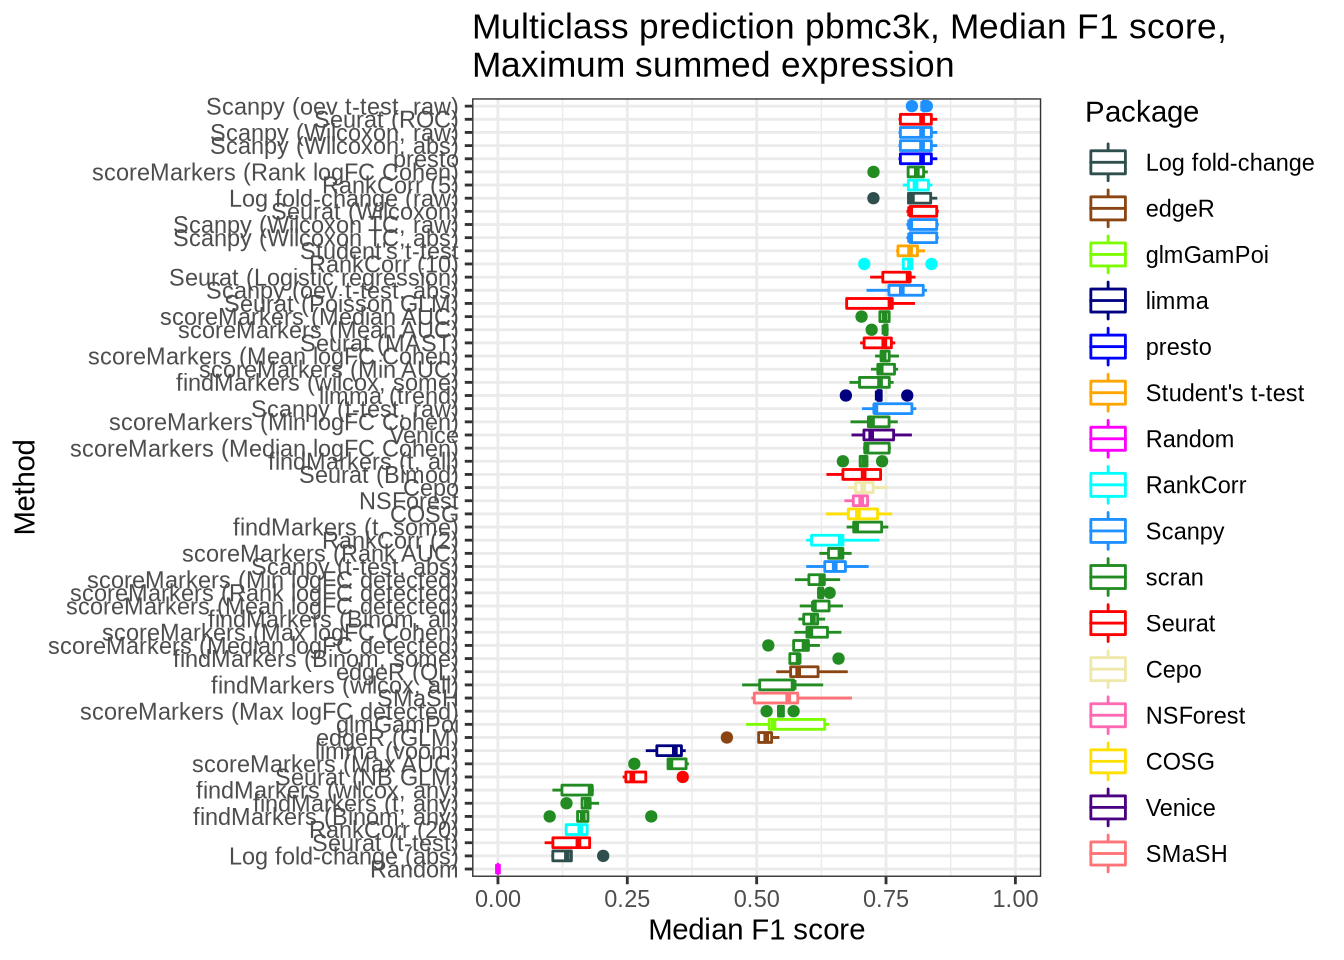
pbmc3k_seurat_wilcox_confmat <- pred_perf_data %>%
  filter(data_id == "pbmc3k", fold == "1", classifier == "knn") %>%
  plot_confusion_matrix("seurat_wilcox")

pbmc3k_seurat_wilcox_confmat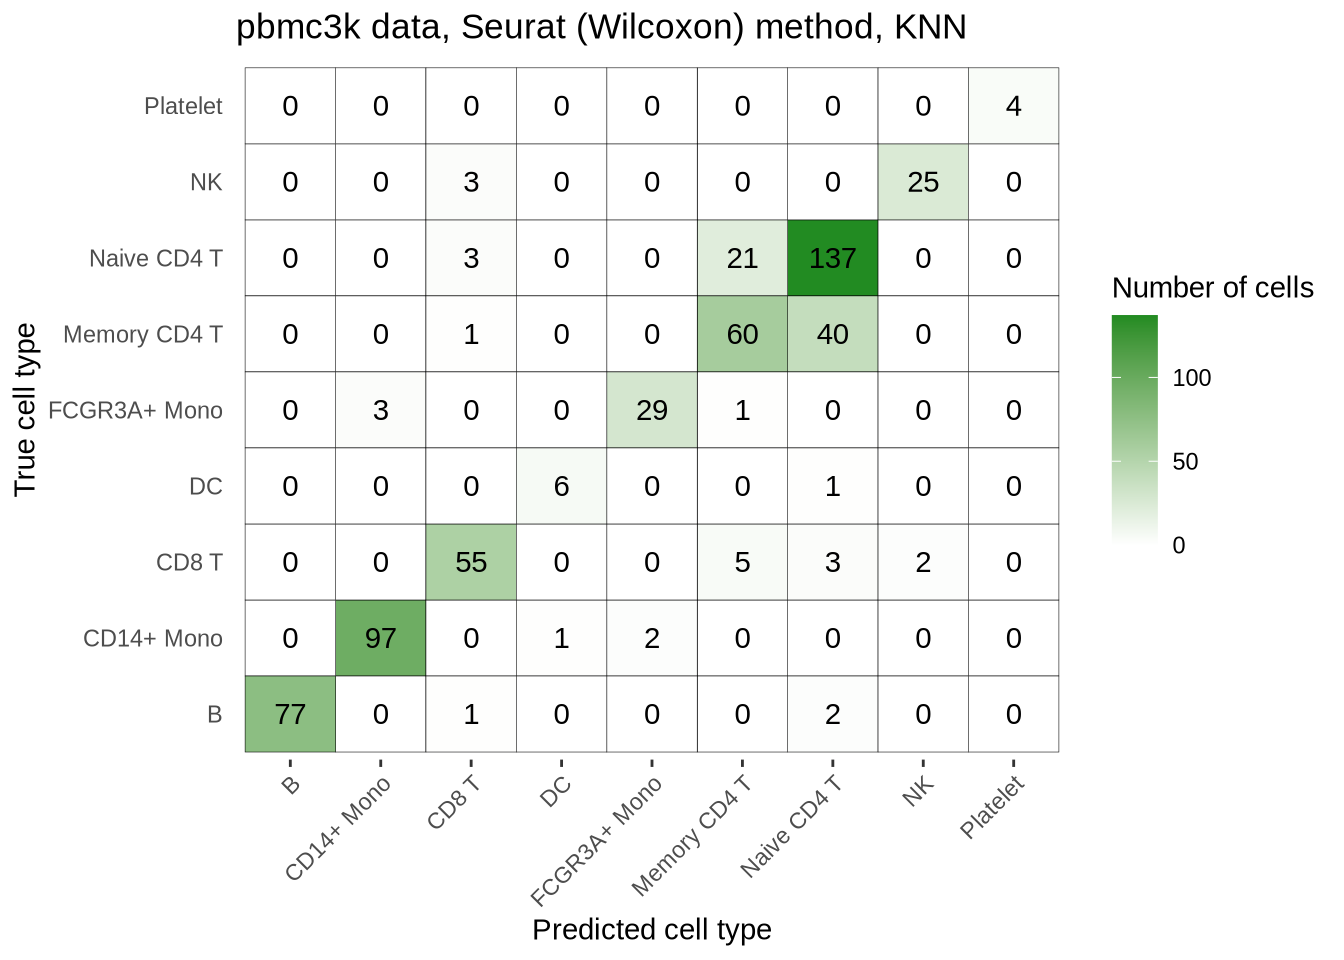
saveRDS(
  pbmc3k_seurat_wilcox_confmat,
  here::here("figures", "raw", "pbmc3k-seurat-wilcox-confmat.rds")
)
Endothelial data
pred_perf_data %>%
  filter(data_id == "endothelial", classifier == "knn") %>%
plot_classifier_metric("mean_f1_score") 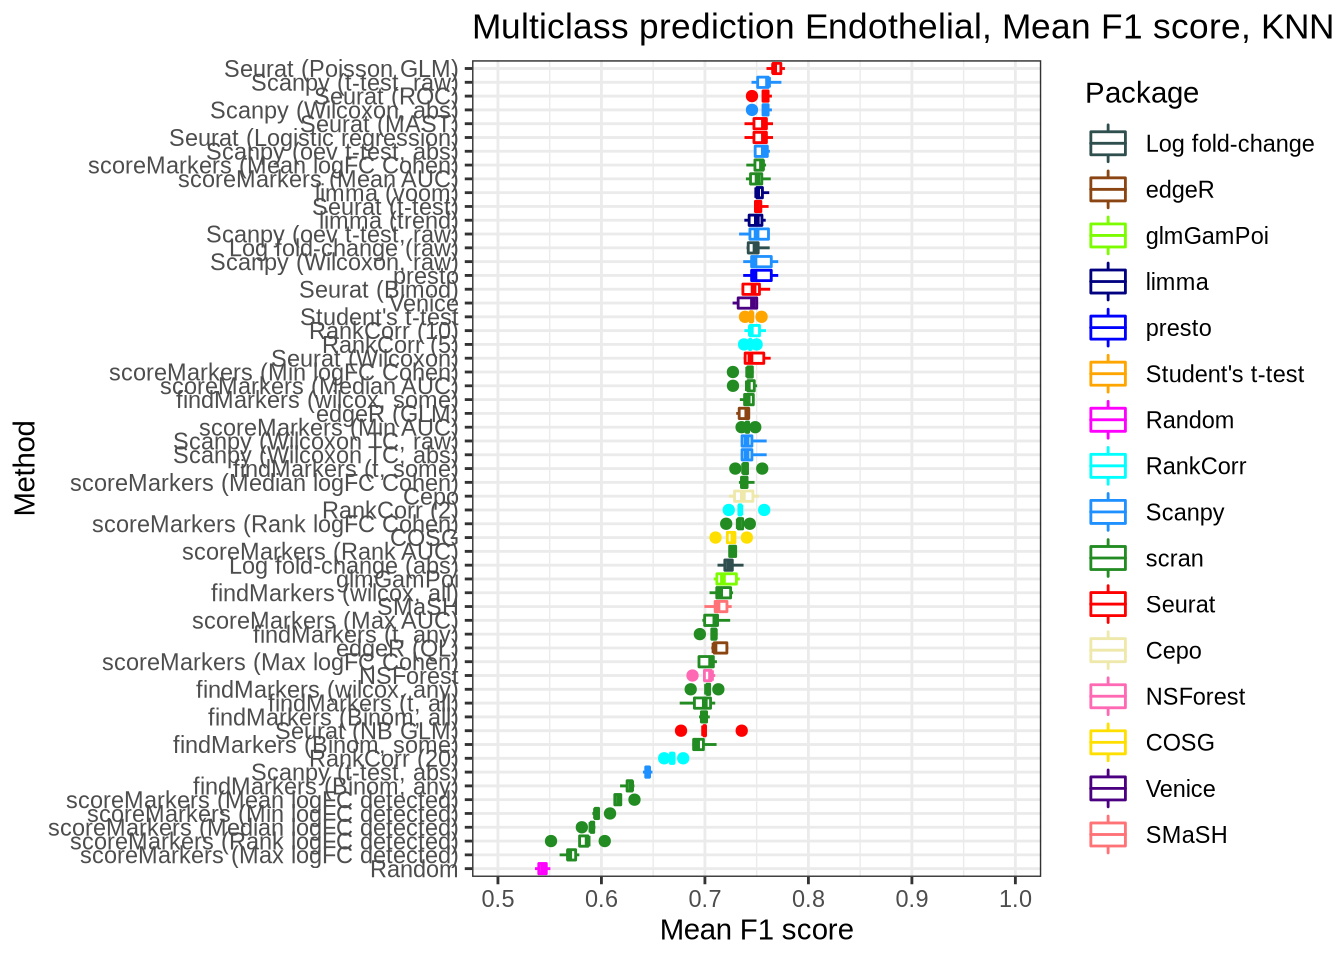
pred_perf_data %>%
  filter(data_id == "endothelial", classifier == "svm") %>%
plot_classifier_metric("mean_f1_score") 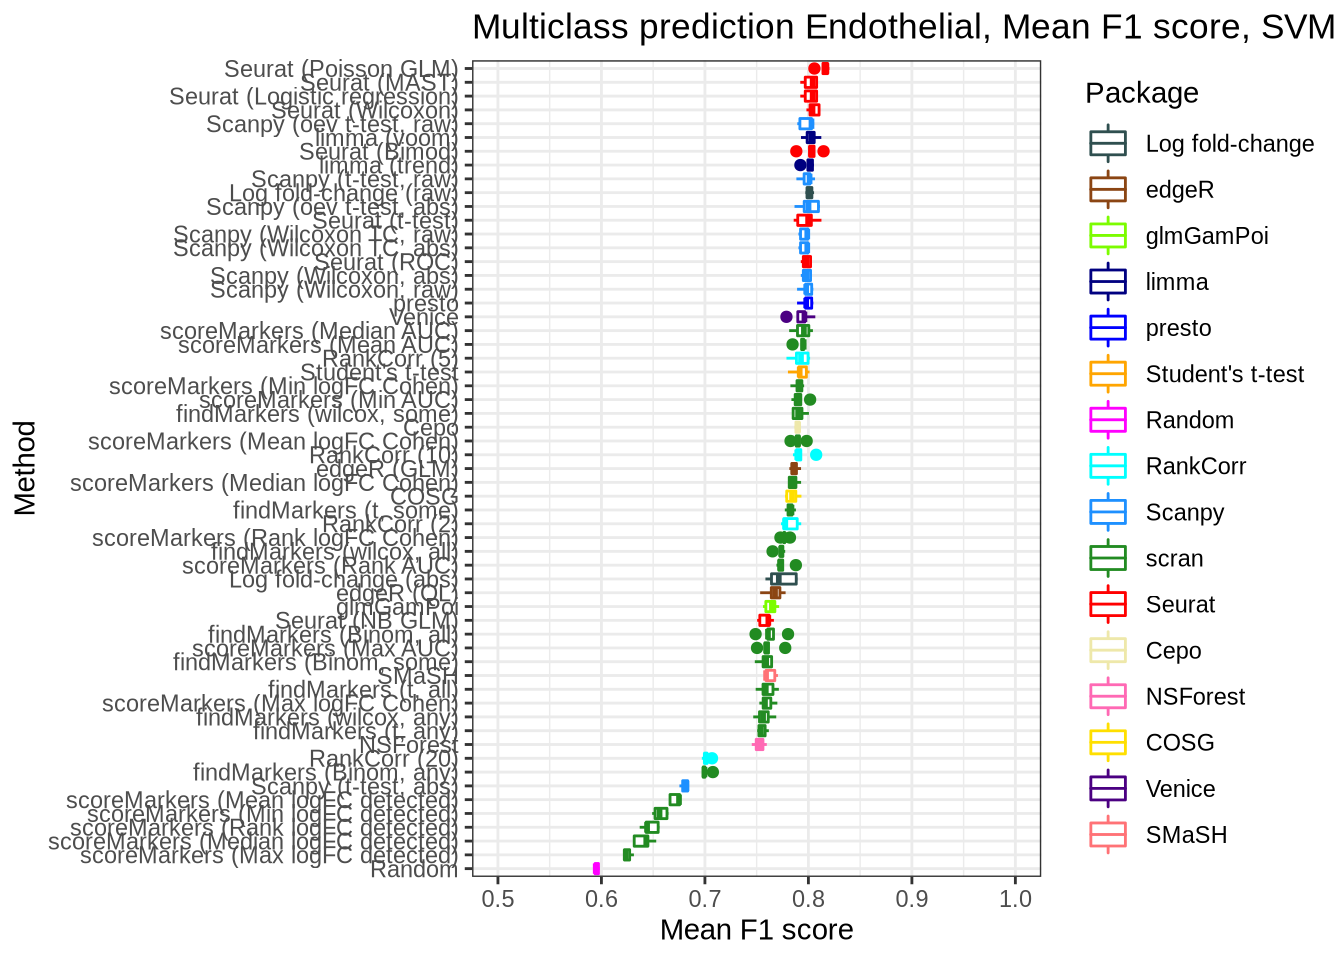
Zeisel
pred_perf_data %>%
  filter(data_id == "zeisel", classifier == "knn") %>%
plot_classifier_metric("mean_f1_score") 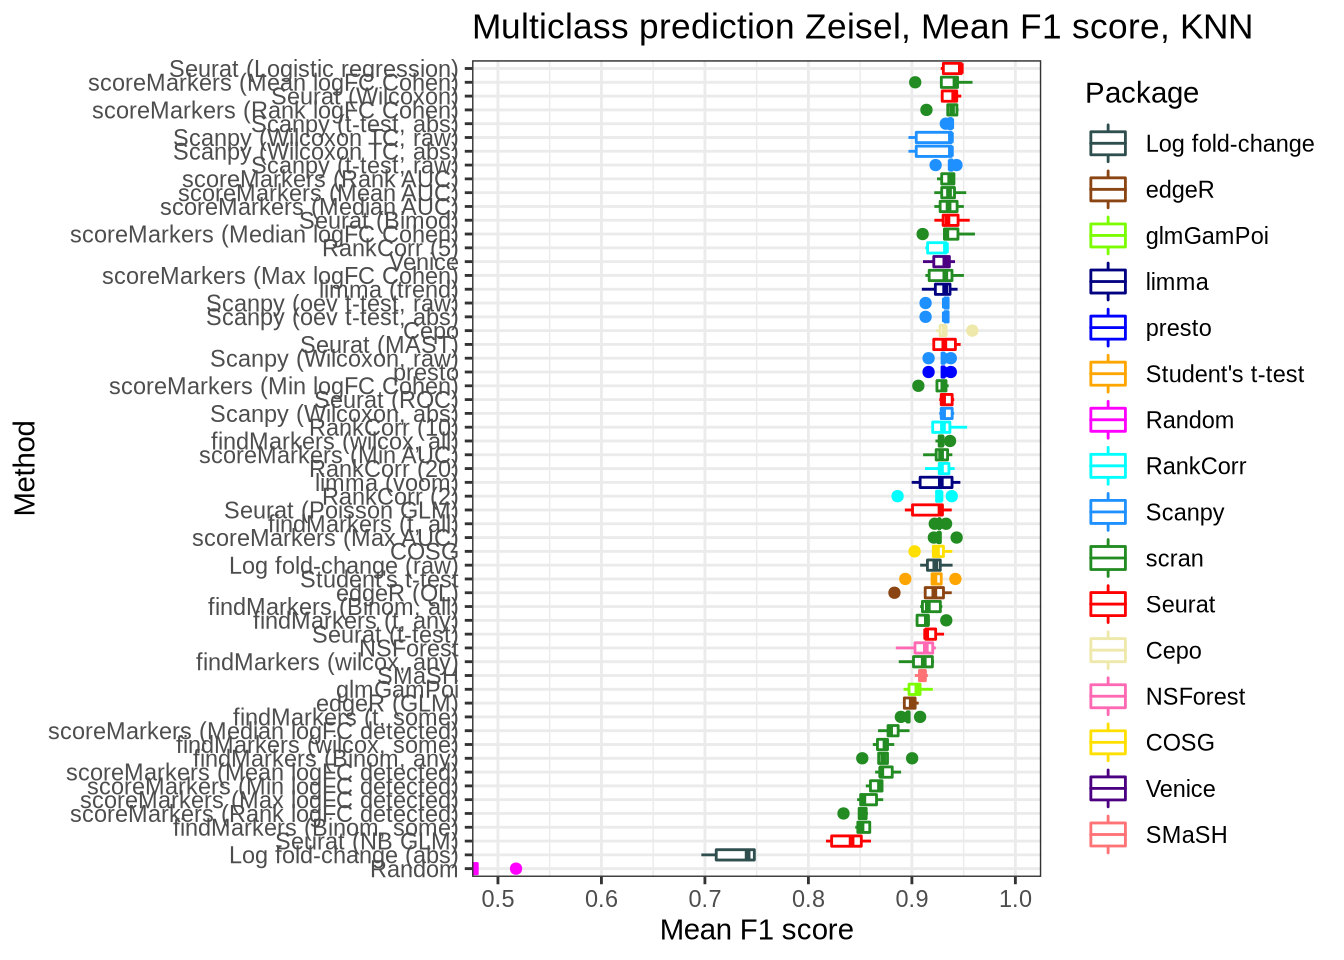
pred_perf_data %>%
  filter(data_id == "zeisel", classifier == "svm") %>%
plot_classifier_metric("mean_f1_score") 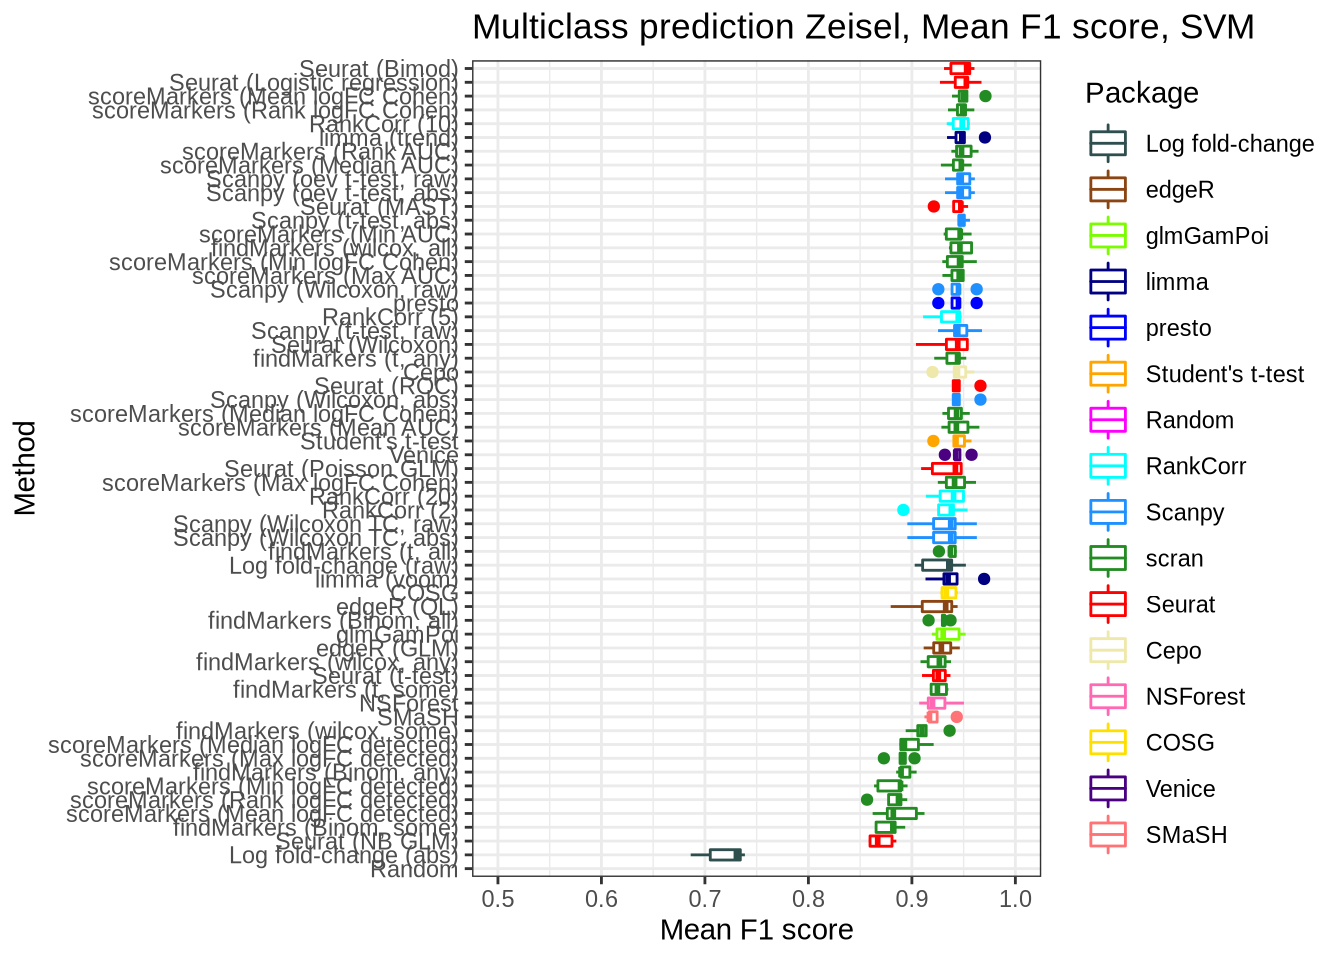
Paul
pred_perf_data %>%
  filter(data_id == "paul", classifier == "knn") %>%
plot_classifier_metric("mean_f1_score") 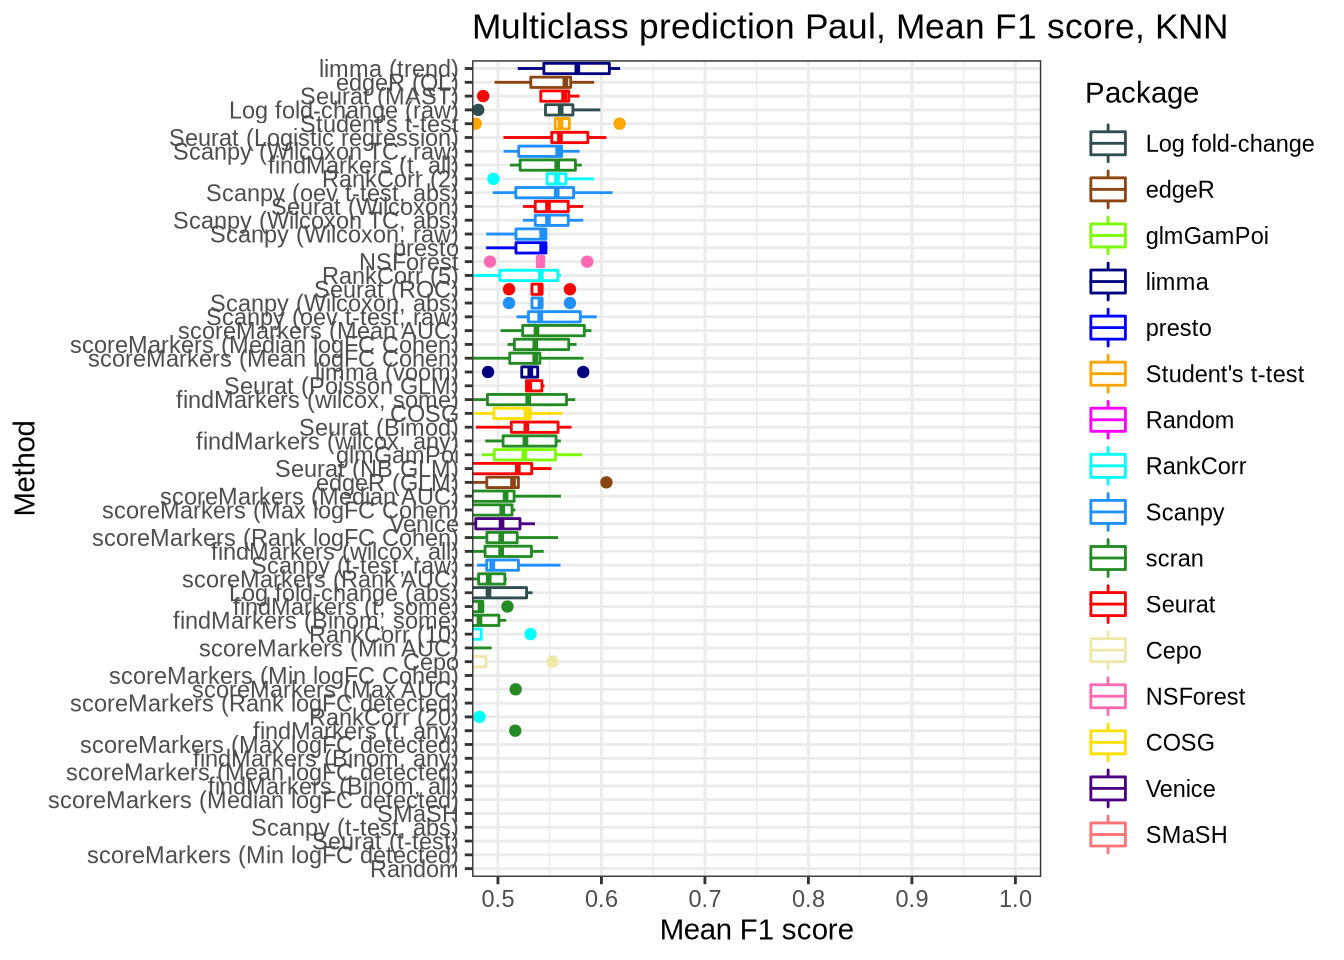
pred_perf_data %>%
  filter(data_id == "paul", classifier == "svm") %>%
plot_classifier_metric("mean_f1_score") 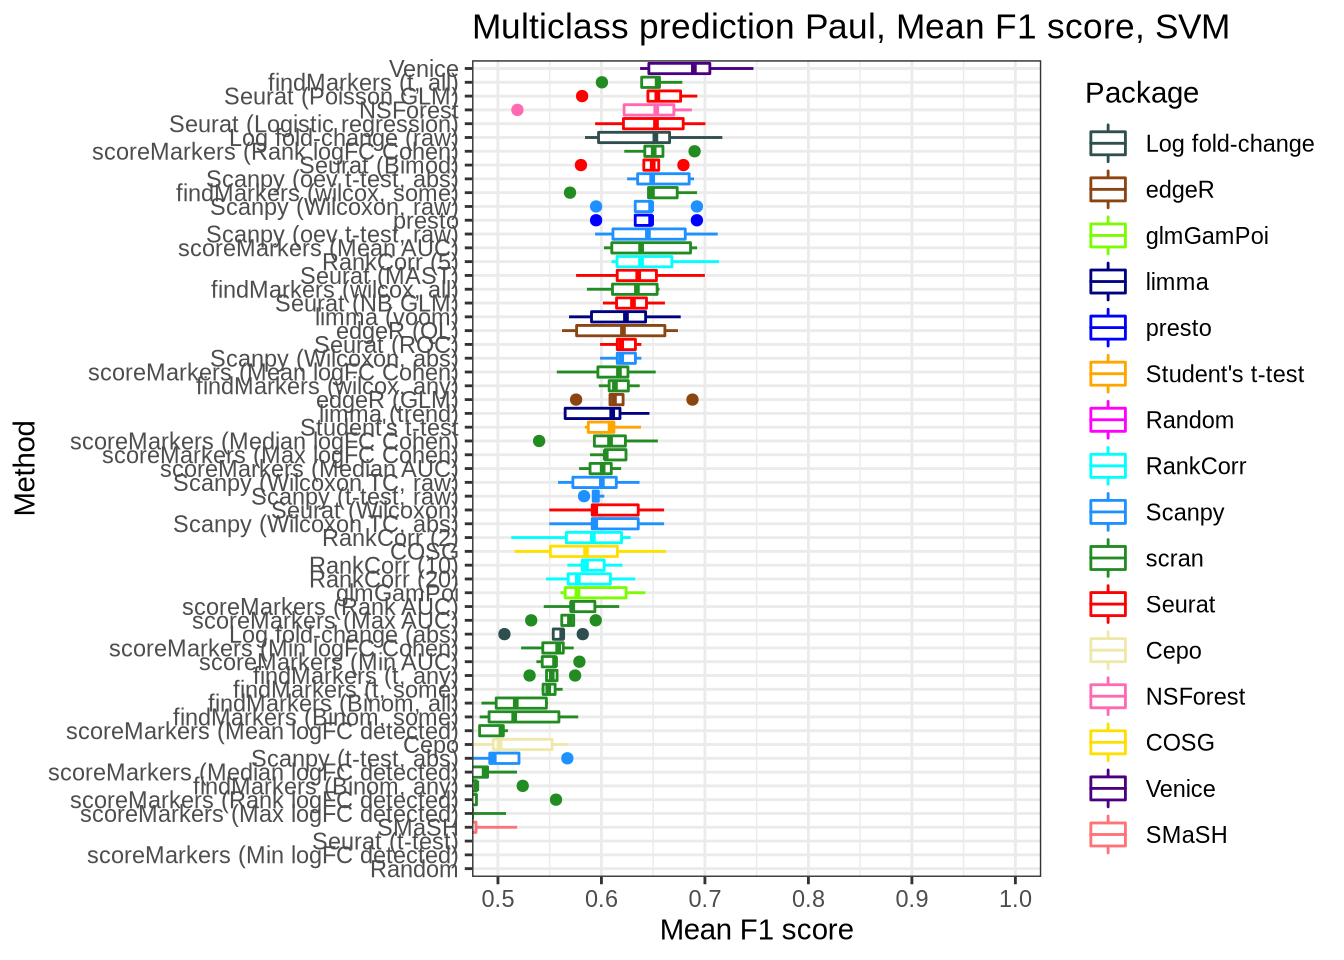
SMaRT-seq3
pred_perf_data %>%
  filter(data_id == "ss3_pbmc", classifier == "knn") %>%
plot_classifier_metric("mean_f1_score") 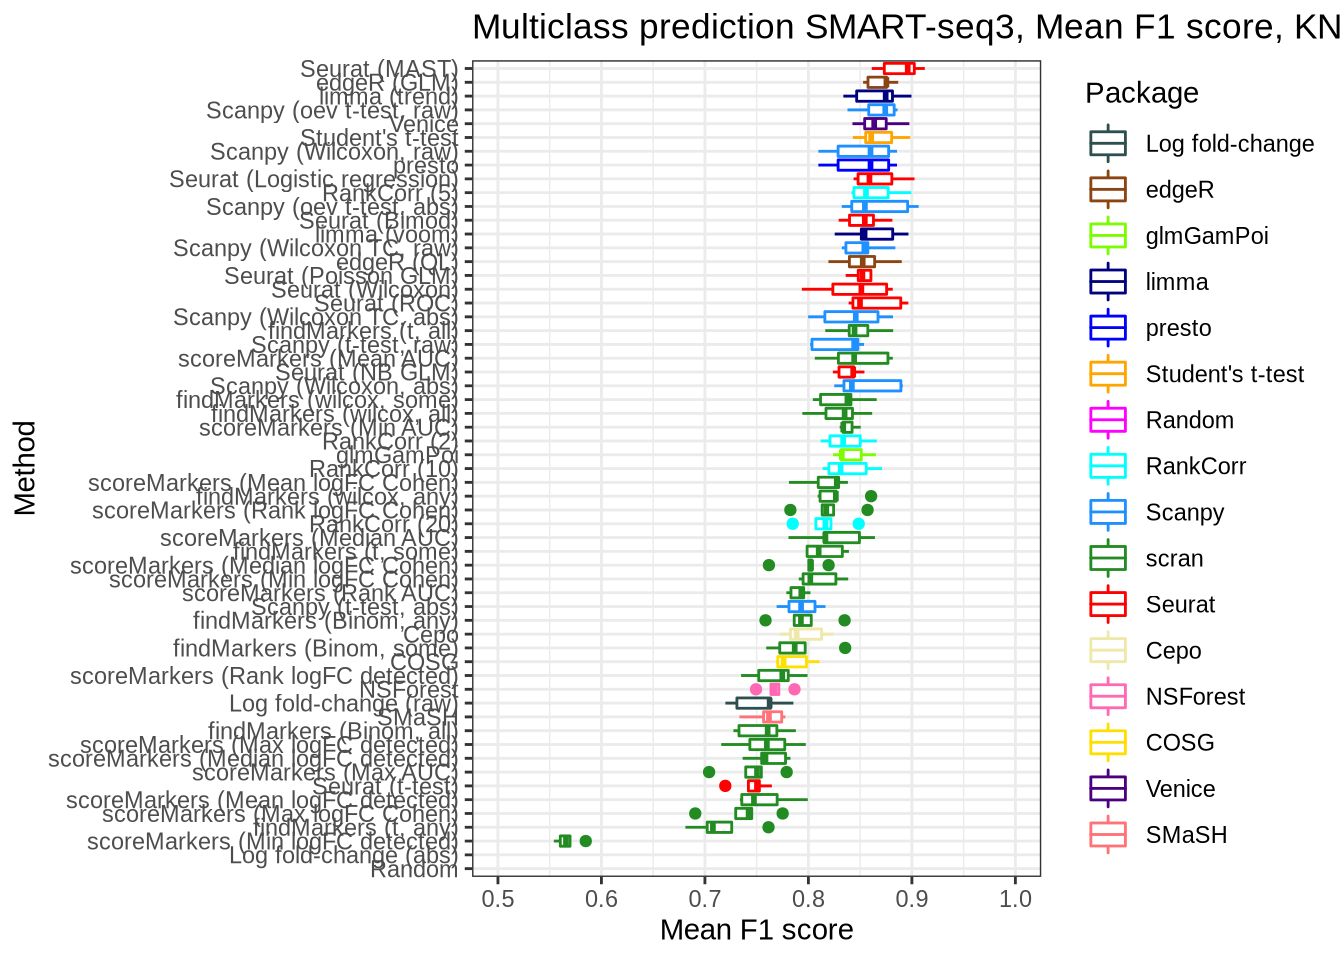
pred_perf_data %>%
  filter(data_id == "ss3_pbmc", classifier == "svm") %>%
plot_classifier_metric("mean_f1_score") 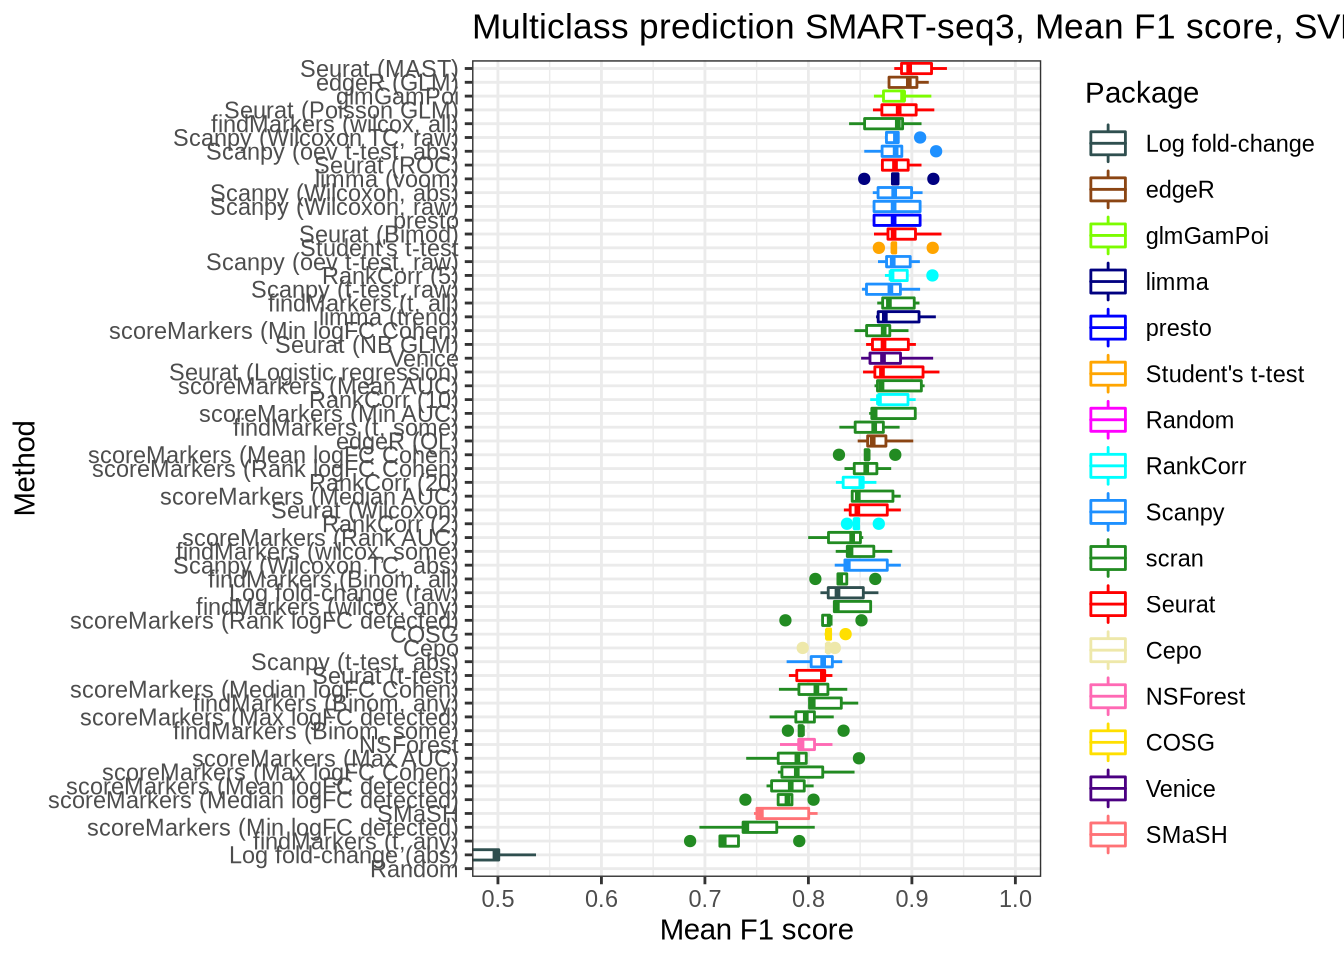
Mesenchymal
pred_perf_data %>%
  filter(data_id == "mesenchymal", classifier == "knn") %>%
plot_classifier_metric("mean_f1_score") 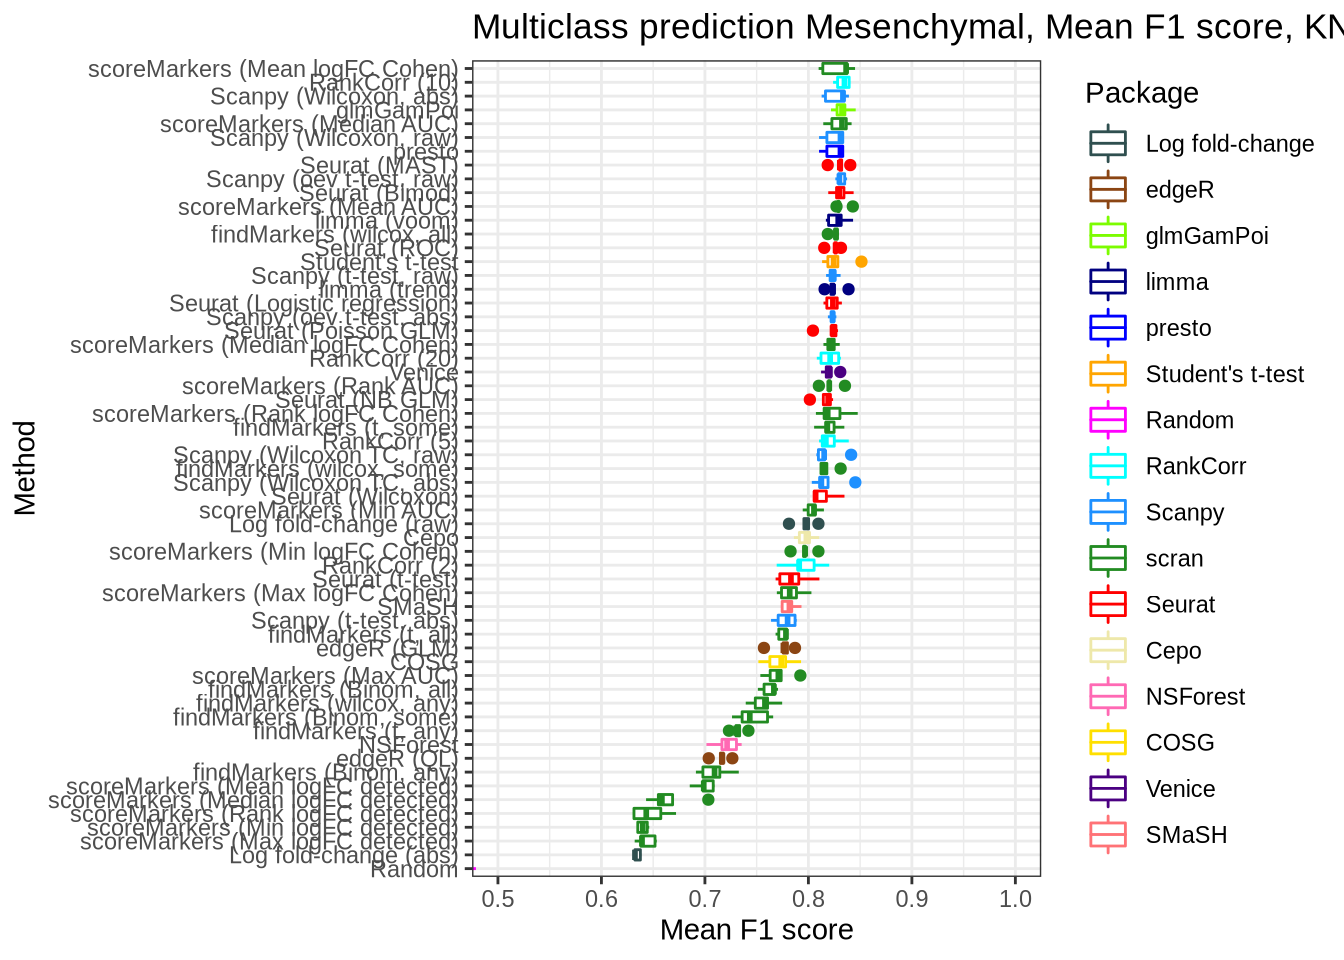
pred_perf_data %>%
  filter(data_id == "mesenchymal", classifier == "svm") %>%
plot_classifier_metric("mean_f1_score") 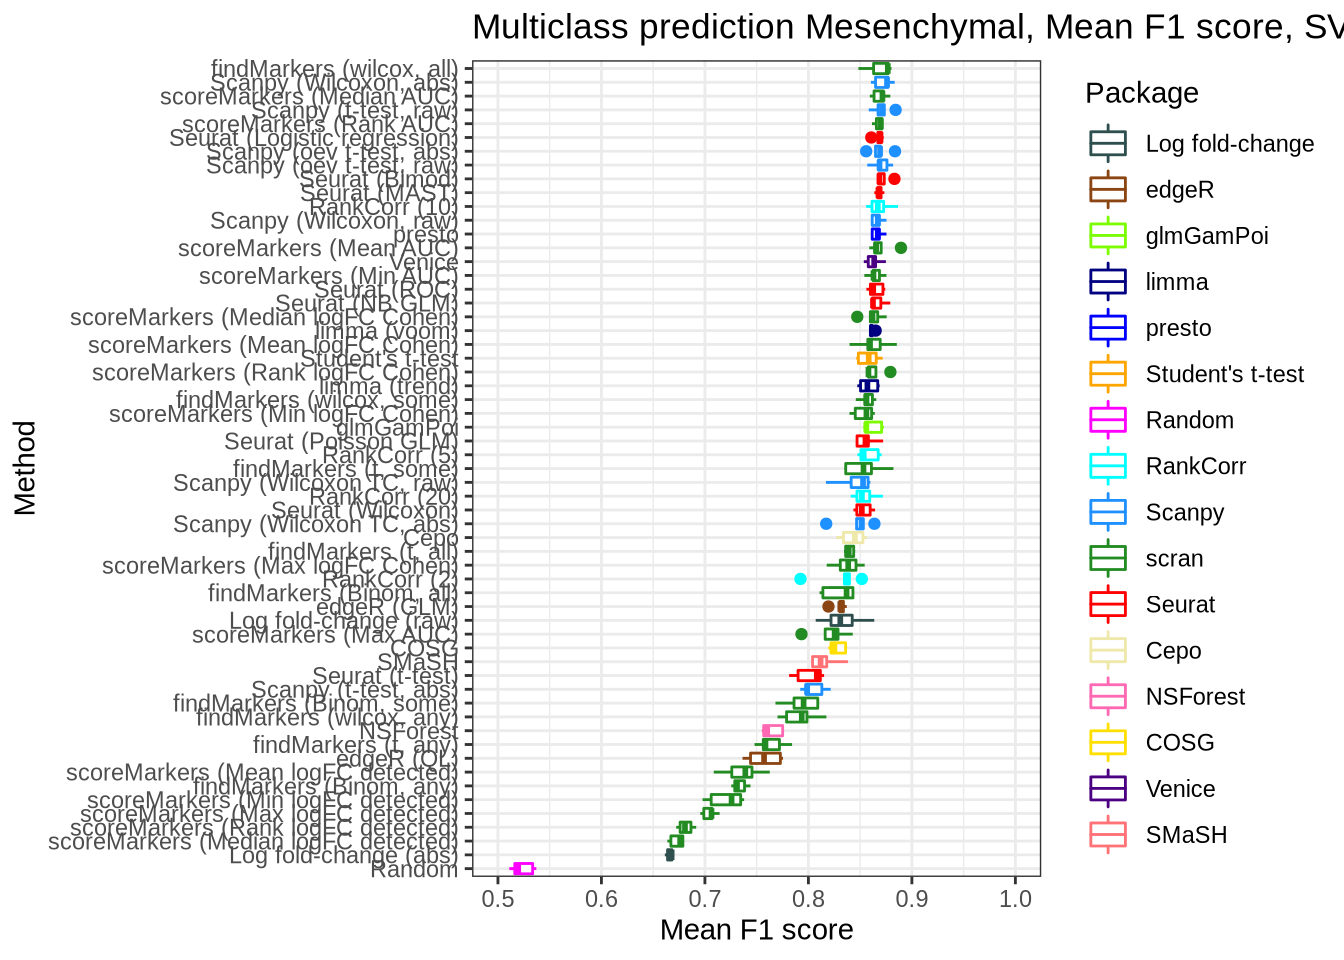
Lawlor
pred_perf_data %>%
  filter(data_id == "lawlor", classifier == "knn") %>%
plot_classifier_metric("mean_f1_score") 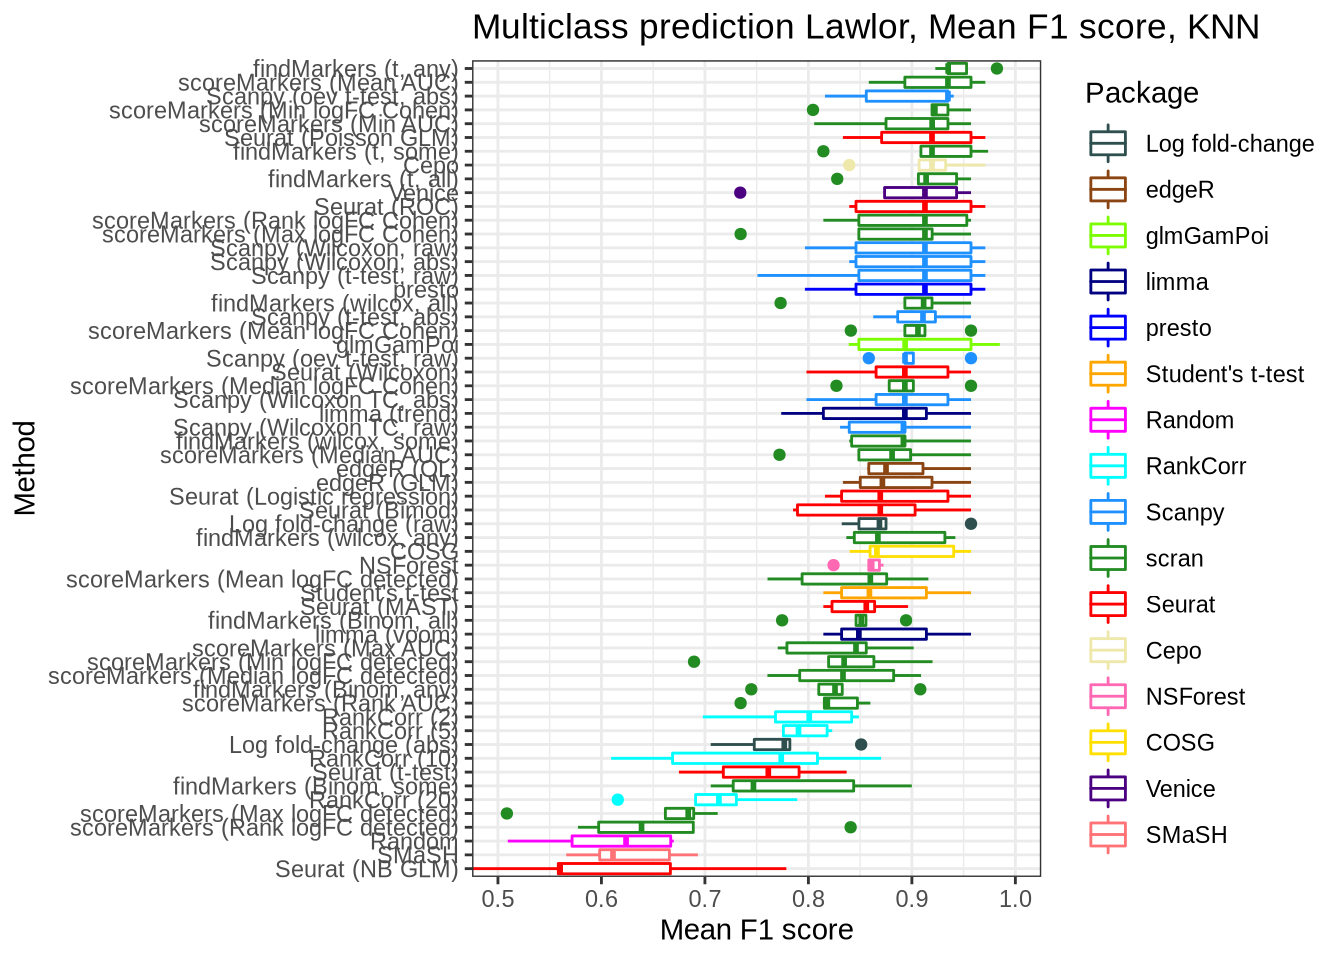
pred_perf_data %>%
  filter(data_id == "lawlor", classifier == "svm") %>%
  plot_classifier_metric("mean_f1_score") +
  coord_flip(ylim = c(0.0, 0.6))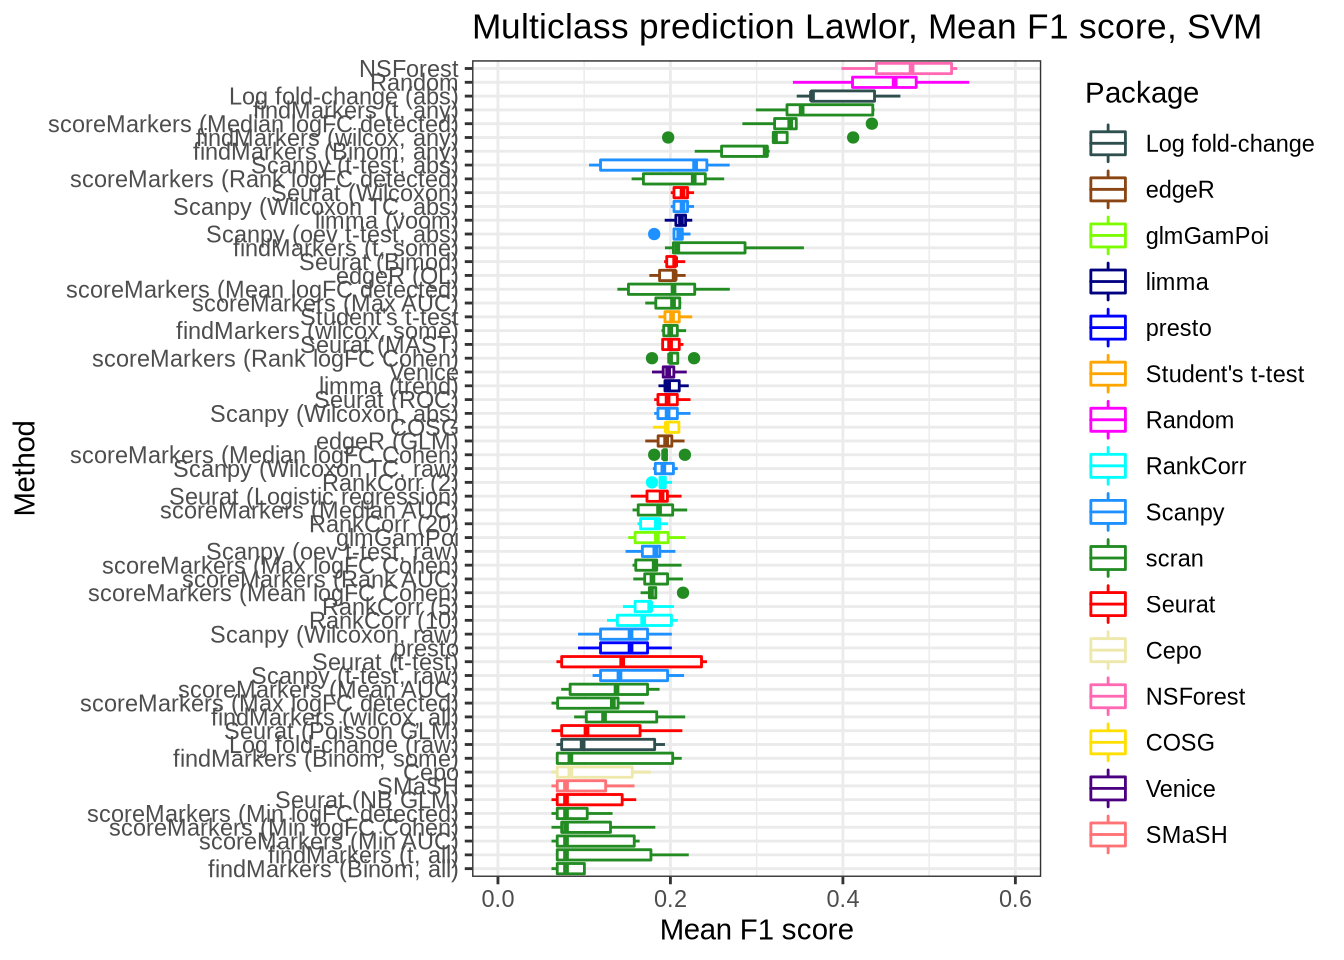
Astrocyte
pred_perf_data %>%
  filter(data_id == "astrocyte", classifier == "knn") %>%
plot_classifier_metric("mean_f1_score") 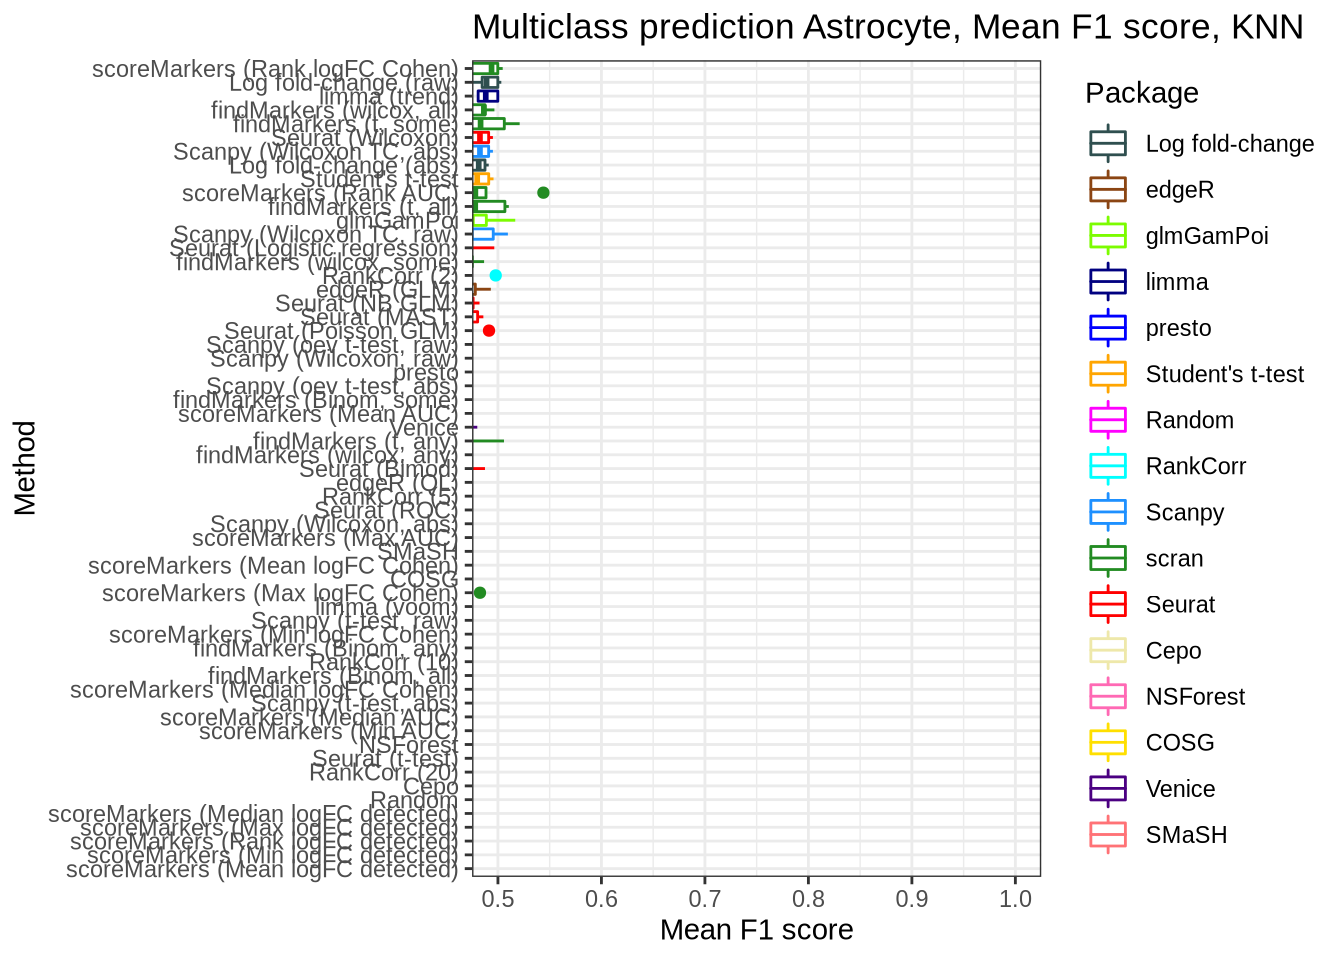
pred_perf_data %>%
  filter(data_id == "astrocyte", classifier == "svm") %>%
plot_classifier_metric("mean_f1_score") 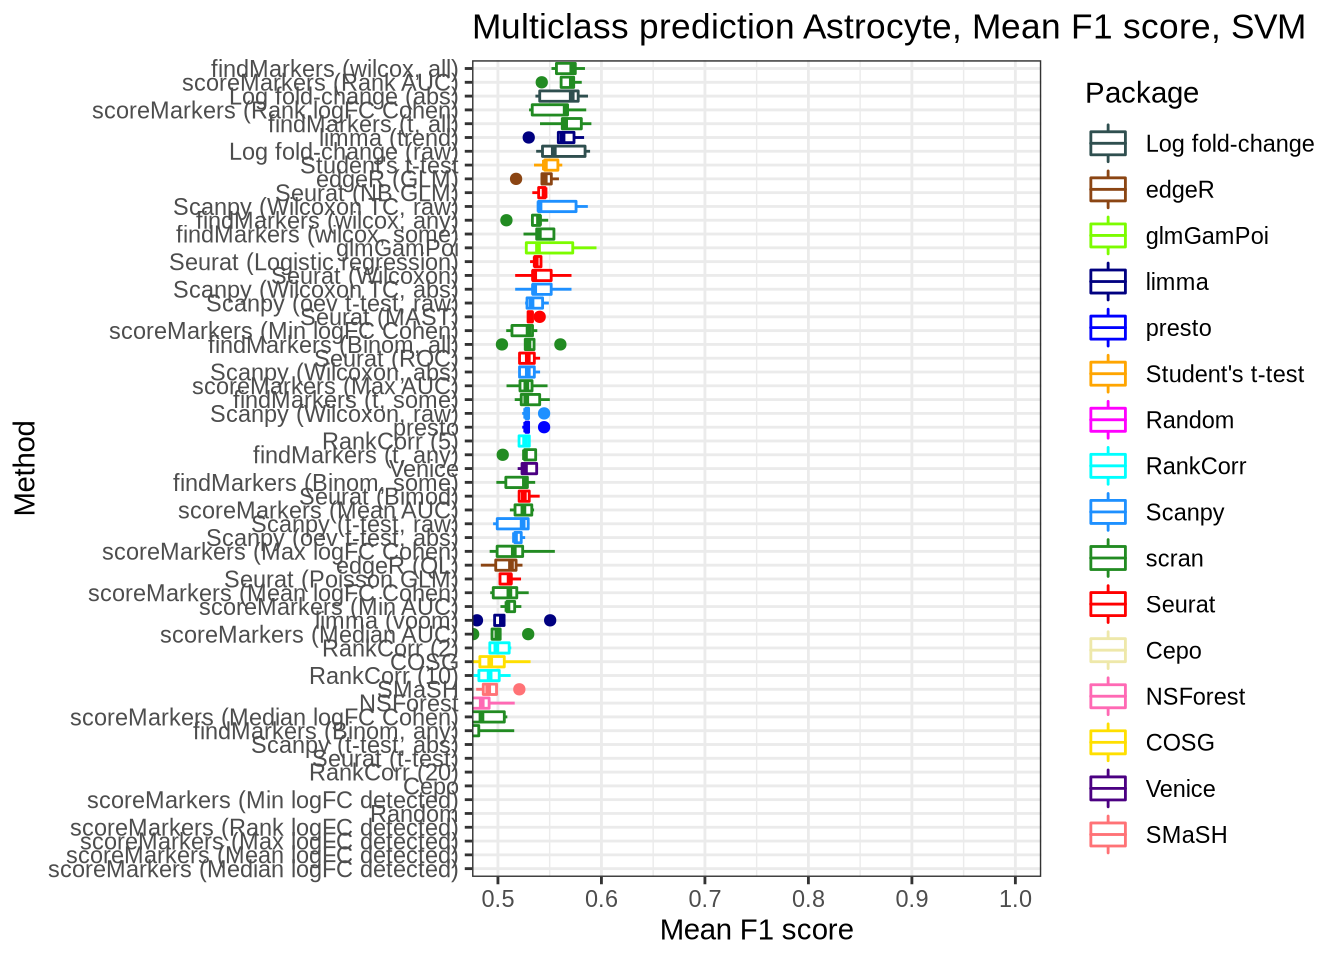
Zhao
zhao_pred_perf <- pred_perf_data %>%
  filter(data_id == "zhao", classifier == "knn") %>%
  plot_classifier_metric("median_f1_score") +
  coord_flip(ylim = c(0.5, 0.85))

zhao_pred_perf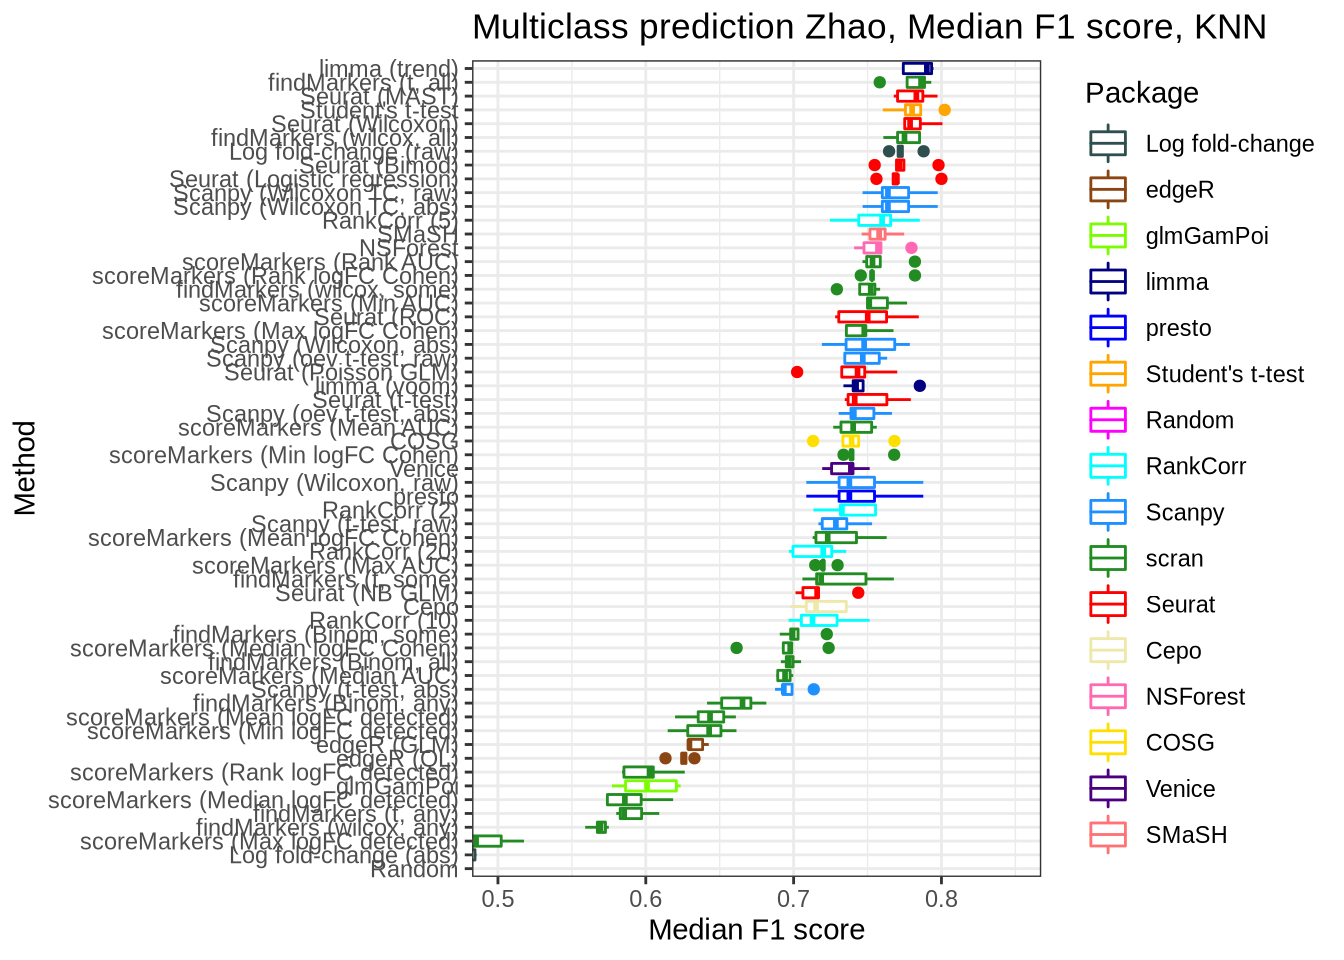
saveRDS(
  zhao_pred_perf,
  here::here("figures", "raw", "zhao-pred-perf.rds")
)

zhao_pred_perf_svm <- pred_perf_data %>%
  filter(data_id == "zhao", classifier == "svm") %>%
  plot_classifier_metric("median_f1_score") +
  coord_flip(ylim = c(0.5, 0.95))

zhao_pred_perf_svm 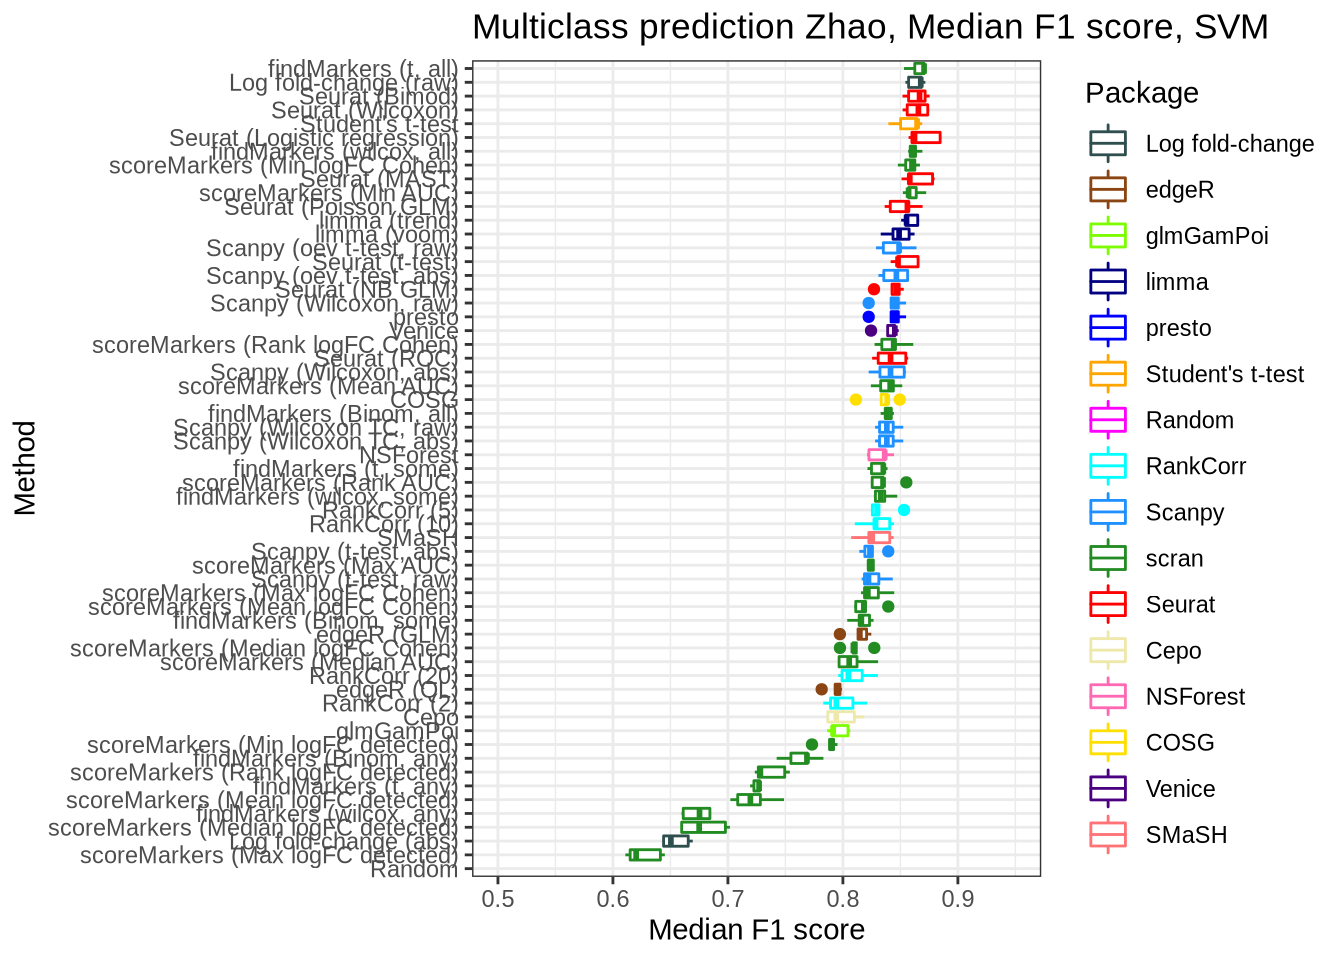
saveRDS(
  zhao_pred_perf_svm,
  here::here("figures", "raw", "zhao-pred-perf-svm.rds")
)

zhao_pred_perf_sum_max <- pred_perf_data %>%
  filter(data_id == "zhao", classifier == "sum_max") %>%
  plot_classifier_metric("median_f1_score") +
  coord_flip(ylim = c(0, 1))

zhao_pred_perf_sum_max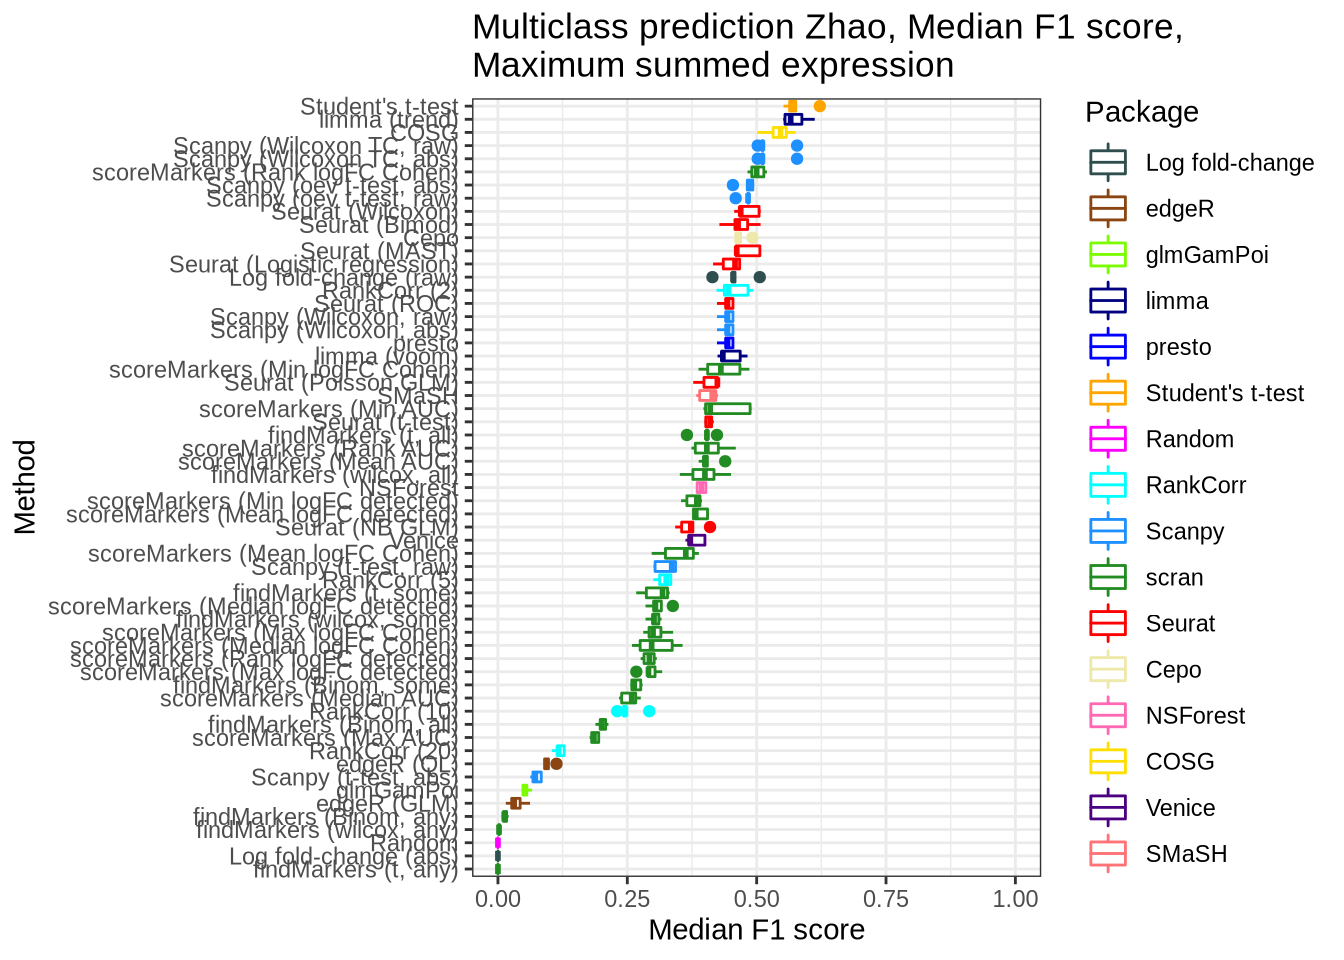
saveRDS(
  zhao_pred_perf_sum_max,
  here::here("figures", "raw", "zhao-pred-perf-sum_max.rds")
)
Overall
overall_multiclass_pred_rank_knn_plot <- pred_perf_data %>%
  filter(classifier == "knn") %>%
  group_by(data_id, pars, method) %>%
  summarise(median_f1_score = median(median_f1_score), .groups = "drop") %>%
  group_by(data_id) %>%
  mutate(rank = rank(median_f1_score)) %>%
  ungroup() %>%
  mutate(
    plot_method = method_lookup[method],
    plot_pars = pars_lookup[pars],
    plot_data_id = dataset_lookup[data_id]
  ) %>%
  # This step encodes the ranking by rank.
  mutate(plot_pars = fct_reorder(factor(plot_pars), rank, .fun = median)) %>%
  ggplot(aes(x = plot_data_id, y = plot_pars)) +
  geom_tile(aes(fill = rank), colour = "black") +
  scale_fill_distiller(palette = "RdYlBu",
                       breaks = seq(1, 56, by = 5),
                       labels = seq(56, 1, by = -5)) +
  theme_bw() +
  labs(
    title = "Median F1-score rank across datasets, KNN",
    x = "Dataset",
    y = "Method",
    fill = "Rank",
  ) +
  theme(
    panel.grid.major = element_blank(),
    panel.grid.minor = element_blank(),
    panel.border = element_blank(),
    axis.ticks.y = element_blank(),
    axis.text.x = element_text(angle = 45, vjust = 1, hjust = 1)
  )
overall_multiclass_pred_rank_knn_plot![]()
overall_multiclass_pred_rank_svm_plot <- pred_perf_data %>%
  filter(data_id != "lawlor") %>%
  filter(classifier == "svm") %>%
  group_by(data_id, pars, method) %>%
  summarise(median_f1_score = median(median_f1_score), .groups = "drop") %>%
  group_by(data_id) %>%
  mutate(rank = rank(median_f1_score)) %>%
  ungroup() %>%
  mutate(
    plot_method = method_lookup[method],
    plot_pars = pars_lookup[pars],
    plot_data_id = dataset_lookup[data_id]
  ) %>%
  # This step encodes the ranking by rank.
  mutate(plot_pars = fct_reorder(factor(plot_pars), rank, .fun = median)) %>%
  ggplot(aes(x = plot_data_id, y = plot_pars)) +
  geom_tile(aes(fill = rank), colour = "black") +
  scale_fill_distiller(palette = "RdYlBu",
                       breaks = seq(1, 56, by = 5),
                       labels = seq(56, 1, by = -5)) +
  theme_bw() +
  labs(
    title = "Median F1-score rank across datasets, SVM",
    x = "Dataset",
    y = "Method",
    fill = "Rank",
  ) +
  theme(
    panel.grid.major = element_blank(),
    panel.grid.minor = element_blank(),
    panel.border = element_blank(),
    axis.ticks.y = element_blank(),
    axis.text.x = element_text(angle = 45, vjust = 1, hjust = 1)
  )
overall_multiclass_pred_z_score_knn_plot <- pred_perf_data %>%
filter(classifier == "knn") %>%
group_by(data_id, pars, method) %>%
summarise(median_f1_score = median(median_f1_score), .groups = "drop") %>%
group_by(data_id) %>%
mutate(score = scale(median_f1_score)[, 1]) %>%
ungroup() %>%
mutate(
plot_method = method_lookup[method],
plot_pars = pars_lookup[pars],
plot_data_id = dataset_lookup[data_id]
) %>%
mutate(plot_pars = fct_reorder(factor(plot_pars), score, .fun = mean)) %>%
ggplot(aes(x = plot_data_id, y = plot_pars)) +
geom_tile(aes(fill = score), colour = "black") +
scale_fill_distiller(palette = "RdYlBu") +
theme_bw() +
labs(
title = "Mean z-score F1-score across datasets, KNN",
x = "Dataset",
y = "Method",
fill = "z-score",
) +
theme(
panel.grid.major = element_blank(),
panel.grid.minor = element_blank(),
panel.border = element_blank(),
axis.ticks.y = element_blank(),
axis.text.x = element_text(angle = 45, vjust = 1, hjust = 1)
)
saveRDS(
overall_multiclass_pred_z_score_knn_plot,
here::here("figures", "raw", "overall-mc-pred-plot-z-score-knn.rds")
)
overall_multiclass_pred_z_score_svm_plot <- pred_perf_data %>%
filter(data_id != "lawlor") %>%
filter(classifier == "svm") %>%
group_by(data_id, pars, method) %>%
summarise(median_f1_score = median(median_f1_score), .groups = "drop") %>%
group_by(data_id) %>%
mutate(score = scale(median_f1_score)[, 1]) %>%
ungroup() %>%
mutate(
plot_method = method_lookup[method],
plot_pars = pars_lookup[pars],
plot_data_id = dataset_lookup[data_id]
) %>%
mutate(plot_pars = fct_reorder(factor(plot_pars), score, .fun = mean)) %>%
ggplot(aes(x = plot_data_id, y = plot_pars)) +
geom_tile(aes(fill = score), colour = "black") +
scale_fill_distiller(palette = "RdYlBu") +
theme_bw() +
labs(
title = "Mean z-score F1-score across datasets, SVM",
x = "Dataset",
y = "Method",
fill = "z-score",
) +
theme(
panel.grid.major = element_blank(),
panel.grid.minor = element_blank(),
panel.border = element_blank(),
axis.ticks.y = element_blank(),
axis.text.x = element_text(angle = 45, vjust = 1, hjust = 1)
)
saveRDS(
overall_multiclass_pred_z_score_svm_plot,
here::here("figures", "raw", "overall-mc-pred-plot-z-score-svm.rds")
)
overall_multiclass_pred_z_score_sum_max_plot <- pred_perf_data %>%
filter(classifier == "sum_max") %>%
group_by(data_id, pars, method) %>%
summarise(median_f1_score = median(median_f1_score), .groups = "drop") %>%
group_by(data_id) %>%
mutate(score = scale(median_f1_score)[, 1]) %>%
ungroup() %>%
mutate(
plot_method = method_lookup[method],
plot_pars = pars_lookup[pars],
plot_data_id = dataset_lookup[data_id]
) %>%
mutate(plot_pars = fct_reorder(factor(plot_pars), score, .fun = mean)) %>%
ggplot(aes(x = plot_data_id, y = plot_pars)) +
geom_tile(aes(fill = score), colour = "black") +
scale_fill_distiller(palette = "RdYlBu") +
theme_bw() +
labs(
title =
"Mean z-score F1-score across datasets,\nMaximum summed gene expression",
x = "Dataset",
y = "Method",
fill = "z-score",
) +
theme(
panel.grid.major = element_blank(),
panel.grid.minor = element_blank(),
panel.border = element_blank(),
axis.ticks.y = element_blank(),
axis.text.x = element_text(angle = 45, vjust = 1, hjust = 1)
)
saveRDS(
overall_multiclass_pred_z_score_sum_max_plot,
here::here("figures", "raw", "overall-mc-pred-plot-z-score-sum_max.rds")
)
devtools::session_info()─ Session info ──────────────────────────────────────────────────────────────
hash: weary cat, man: curly hair, hammer and wrench
setting value
version R version 4.1.2 (2021-11-01)
os Red Hat Enterprise Linux 9.2 (Plow)
system x86_64, linux-gnu
ui X11
language (EN)
collate en_AU.UTF-8
ctype en_AU.UTF-8
tz Australia/Melbourne
date 2024-01-01
pandoc 2.18 @ /apps/easybuild-2022/easybuild/software/MPI/GCC/11.3.0/OpenMPI/4.1.4/RStudio-Server/2022.07.2+576-Java-11-R-4.1.2/bin/pandoc/ (via rmarkdown)
─ Packages ───────────────────────────────────────────────────────────────────
package * version date (UTC) lib source
assertthat 0.2.1 2019-03-21 [2] CRAN (R 4.1.2)
beachmat 2.10.0 2021-10-26 [1] Bioconductor
beeswarm 0.4.0 2021-06-01 [2] CRAN (R 4.1.2)
Biobase * 2.54.0 2021-10-26 [1] Bioconductor
BiocGenerics * 0.40.0 2021-10-26 [1] Bioconductor
BiocNeighbors 1.12.0 2021-10-26 [1] Bioconductor
BiocParallel 1.28.3 2021-12-09 [1] Bioconductor
BiocSingular 1.10.0 2021-10-26 [1] Bioconductor
bitops 1.0-7 2021-04-24 [2] CRAN (R 4.1.2)
bslib 0.3.1 2021-10-06 [1] CRAN (R 4.1.0)
cachem 1.0.6 2021-08-19 [1] CRAN (R 4.1.0)
callr 3.7.0 2021-04-20 [2] CRAN (R 4.1.2)
class * 7.3-19 2021-05-03 [2] CRAN (R 4.1.2)
cli 3.6.1 2023-03-23 [1] CRAN (R 4.1.0)
colorspace 2.1-0 2023-01-23 [1] CRAN (R 4.1.0)
crayon 1.5.1 2022-03-26 [1] CRAN (R 4.1.0)
DBI 1.1.2 2021-12-20 [1] CRAN (R 4.1.0)
DelayedArray 0.20.0 2021-10-26 [1] Bioconductor
DelayedMatrixStats 1.16.0 2021-10-26 [1] Bioconductor
desc 1.4.0 2021-09-28 [2] CRAN (R 4.1.2)
devtools 2.4.2 2021-06-07 [2] CRAN (R 4.1.2)
digest 0.6.29 2021-12-01 [1] CRAN (R 4.1.0)
dplyr * 1.0.9 2022-04-28 [1] CRAN (R 4.1.0)
ellipsis 0.3.2 2021-04-29 [2] CRAN (R 4.1.2)
evaluate 0.14 2019-05-28 [2] CRAN (R 4.1.2)
fansi 1.0.4 2023-01-22 [1] CRAN (R 4.1.0)
farver 2.1.1 2022-07-06 [1] CRAN (R 4.1.0)
fastmap 1.1.0 2021-01-25 [2] CRAN (R 4.1.2)
forcats * 0.5.1 2021-01-27 [2] CRAN (R 4.1.2)
fs 1.5.2 2021-12-08 [1] CRAN (R 4.1.0)
generics 0.1.3 2022-07-05 [1] CRAN (R 4.1.0)
GenomeInfoDb * 1.30.0 2021-10-26 [1] Bioconductor
GenomeInfoDbData 1.2.7 2021-12-03 [1] Bioconductor
GenomicRanges * 1.46.1 2021-11-18 [1] Bioconductor
ggbeeswarm 0.6.0 2017-08-07 [2] CRAN (R 4.1.2)
ggplot2 * 3.3.6 2022-05-03 [1] CRAN (R 4.1.0)
ggrepel 0.9.1 2021-01-15 [2] CRAN (R 4.1.2)
git2r 0.28.0 2021-01-10 [2] CRAN (R 4.1.2)
glue 1.6.0 2021-12-17 [1] CRAN (R 4.1.0)
gridExtra 2.3 2017-09-09 [2] CRAN (R 4.1.2)
gtable 0.3.0 2019-03-25 [2] CRAN (R 4.1.2)
here 1.0.1 2020-12-13 [1] CRAN (R 4.1.0)
highr 0.9 2021-04-16 [2] CRAN (R 4.1.2)
htmltools 0.5.2 2021-08-25 [1] CRAN (R 4.1.0)
httpuv 1.6.5 2022-01-05 [1] CRAN (R 4.1.0)
IRanges * 2.28.0 2021-10-26 [1] Bioconductor
irlba 2.3.5 2021-12-06 [1] CRAN (R 4.1.0)
jquerylib 0.1.4 2021-04-26 [2] CRAN (R 4.1.2)
jsonlite 1.8.0 2022-02-22 [1] CRAN (R 4.1.0)
knitr 1.36 2021-09-29 [1] CRAN (R 4.1.0)
labeling 0.4.2 2020-10-20 [2] CRAN (R 4.1.2)
later 1.3.0 2021-08-18 [1] CRAN (R 4.1.0)
lattice 0.20-45 2021-09-22 [2] CRAN (R 4.1.2)
lifecycle 1.0.1 2021-09-24 [1] CRAN (R 4.1.0)
magrittr 2.0.3 2022-03-30 [1] CRAN (R 4.1.0)
Matrix 1.3-4 2021-06-01 [2] CRAN (R 4.1.2)
MatrixGenerics * 1.6.0 2021-10-26 [1] Bioconductor
matrixStats * 0.62.0 2022-04-19 [1] CRAN (R 4.1.0)
memoise 2.0.1 2021-11-26 [1] CRAN (R 4.1.0)
munsell 0.5.0 2018-06-12 [2] CRAN (R 4.1.2)
pillar 1.7.0 2022-02-01 [1] CRAN (R 4.1.0)
pkgbuild 1.2.0 2020-12-15 [2] CRAN (R 4.1.2)
pkgconfig 2.0.3 2019-09-22 [2] CRAN (R 4.1.2)
pkgload 1.2.3 2021-10-13 [2] CRAN (R 4.1.2)
prettyunits 1.1.1 2020-01-24 [2] CRAN (R 4.1.2)
processx 3.5.2 2021-04-30 [2] CRAN (R 4.1.2)
promises 1.2.0.1 2021-02-11 [2] CRAN (R 4.1.2)
ps 1.7.1 2022-06-18 [1] CRAN (R 4.1.0)
purrr * 0.3.4 2020-04-17 [2] CRAN (R 4.1.2)
R6 2.5.1 2021-08-19 [1] CRAN (R 4.1.0)
RColorBrewer 1.1-3 2022-04-03 [1] CRAN (R 4.1.0)
Rcpp 1.0.8.3 2022-03-17 [1] CRAN (R 4.1.0)
RCurl 1.98-1.5 2021-09-17 [1] CRAN (R 4.1.0)
remotes 2.4.2 2021-11-30 [1] CRAN (R 4.1.0)
rlang 1.0.3 2022-06-27 [1] CRAN (R 4.1.0)
rmarkdown 2.14 2022-04-25 [1] CRAN (R 4.1.0)
rprojroot 2.0.3 2022-04-02 [1] CRAN (R 4.1.0)
rstudioapi 0.14 2022-08-22 [1] CRAN (R 4.1.0)
rsvd 1.0.5 2021-04-16 [1] CRAN (R 4.1.0)
S4Vectors * 0.32.3 2021-11-21 [1] Bioconductor
sass 0.4.1 2022-03-23 [1] CRAN (R 4.1.0)
ScaledMatrix 1.2.0 2021-10-26 [1] Bioconductor
scales 1.2.1 2022-08-20 [1] CRAN (R 4.1.0)
scater * 1.22.0 2021-10-26 [1] Bioconductor
scuttle * 1.4.0 2021-10-26 [1] Bioconductor
sessioninfo 1.2.0 2021-10-31 [2] CRAN (R 4.1.2)
SingleCellExperiment * 1.16.0 2021-10-26 [1] Bioconductor
sparseMatrixStats 1.6.0 2021-10-26 [1] Bioconductor
stringi 1.7.6 2021-11-29 [1] CRAN (R 4.1.0)
stringr 1.4.0 2019-02-10 [2] CRAN (R 4.1.2)
SummarizedExperiment * 1.24.0 2021-10-26 [1] Bioconductor
testthat 3.1.0 2021-10-04 [2] CRAN (R 4.1.2)
tibble 3.1.7 2022-05-03 [1] CRAN (R 4.1.0)
tidyr * 1.2.0 2022-02-01 [1] CRAN (R 4.1.0)
tidyselect 1.1.2 2022-02-21 [1] CRAN (R 4.1.0)
usethis 2.1.3 2021-10-27 [2] CRAN (R 4.1.2)
utf8 1.2.3 2023-01-31 [1] CRAN (R 4.1.0)
vctrs 0.4.1 2022-04-13 [1] CRAN (R 4.1.0)
vipor 0.4.5 2017-03-22 [2] CRAN (R 4.1.2)
viridis 0.6.2 2021-10-13 [1] CRAN (R 4.1.0)
viridisLite 0.4.2 2023-05-02 [1] CRAN (R 4.1.0)
whisker 0.4 2019-08-28 [2] CRAN (R 4.1.2)
withr 2.5.0 2022-03-03 [1] CRAN (R 4.1.0)
workflowr 1.7.0 2021-12-21 [1] CRAN (R 4.1.0)
xfun 0.31 2022-05-10 [1] CRAN (R 4.1.0)
XVector 0.34.0 2021-10-26 [1] Bioconductor
yaml 2.3.5 2022-02-21 [1] CRAN (R 4.1.0)
zlibbioc 1.40.0 2021-10-26 [1] Bioconductor
[1] /home/jpullin/R/x86_64-pc-linux-gnu-library/4.1
[2] /apps/easybuild-2022/easybuild/software/MPI/GCC/11.3.0/OpenMPI/4.1.4/R/4.1.2/lib64/R/library
──────────────────────────────────────────────────────────────────────────────