Time analysis
Last updated: 2024-01-01
Checks: 7 0
Knit directory:
mage_2020_marker-gene-benchmarking/
This reproducible R Markdown analysis was created with workflowr (version 1.7.0). The Checks tab describes the reproducibility checks that were applied when the results were created. The Past versions tab lists the development history.
Great! Since the R Markdown file has been committed to the Git repository, you know the exact version of the code that produced these results.
Great job! The global environment was empty. Objects defined in the global environment can affect the analysis in your R Markdown file in unknown ways. For reproduciblity it’s best to always run the code in an empty environment.
The command set.seed(20190102) was run prior to running
the code in the R Markdown file. Setting a seed ensures that any results
that rely on randomness, e.g. subsampling or permutations, are
reproducible.
Great job! Recording the operating system, R version, and package versions is critical for reproducibility.
Nice! There were no cached chunks for this analysis, so you can be confident that you successfully produced the results during this run.
Great job! Using relative paths to the files within your workflowr project makes it easier to run your code on other machines.
Great! You are using Git for version control. Tracking code development and connecting the code version to the results is critical for reproducibility.
The results in this page were generated with repository version 2632193. See the Past versions tab to see a history of the changes made to the R Markdown and HTML files.
Note that you need to be careful to ensure that all relevant files for
the analysis have been committed to Git prior to generating the results
(you can use wflow_publish or
wflow_git_commit). workflowr only checks the R Markdown
file, but you know if there are other scripts or data files that it
depends on. Below is the status of the Git repository when the results
were generated:
Ignored files:
    Ignored:    .Renviron
    Ignored:    .Rhistory
    Ignored:    .Rproj.user/
    Ignored:    .snakemake/
    Ignored:    NSForest/.Rhistory
    Ignored:    NSForest/NS-Forest_v3_Extended_Binary_Markers_Supplmental.csv
    Ignored:    NSForest/NS-Forest_v3_Full_Results.csv
    Ignored:    NSForest/NSForest3_medianValues.csv
    Ignored:    NSForest/NSForest_v3_Final_Result.csv
    Ignored:    NSForest/__pycache__/
    Ignored:    NSForest/data/
    Ignored:    RankCorr/picturedRocks/__pycache__/
    Ignored:    benchmarks/
    Ignored:    config/
    Ignored:    data/cellmarker/
    Ignored:    data/downloaded_data/
    Ignored:    data/expert_annotations/
    Ignored:    data/expert_mgs/
    Ignored:    data/raw_data/
    Ignored:    data/real_data/
    Ignored:    data/sim_data/
    Ignored:    data/sim_mgs/
    Ignored:    data/special_real_data/
    Ignored:    figures/
    Ignored:    logs/
    Ignored:    results/
    Ignored:    weights/

Unstaged changes:
    Deleted:    analysis/expert-mgs-direction.Rmd
    Modified:   smash-fork
Note that any generated files, e.g. HTML, png, CSS, etc., are not included in this status report because it is ok for generated content to have uncommitted changes.
These are the previous versions of the repository in which changes were
made to the R Markdown (analysis/time.Rmd) and HTML
(public/time.html) files. If you’ve configured a remote Git
repository (see ?wflow_git_remote), click on the hyperlinks
in the table below to view the files as they were in that past version.
| File | Version | Author | Date | Message |
|---|---|---|---|---|
| html | fcecf65 | Jeffrey Pullin | 2022-09-09 | Build site. |
| html | af96b34 | Jeffrey Pullin | 2022-08-30 | Build site. |
| html | 0e47874 | Jeffrey Pullin | 2022-05-04 | Build site. |
| html | 781c4f8 | Jeffrey Pullin | 2022-05-02 | Build site. |
| html | 8b989e1 | Jeffrey Pullin | 2022-05-02 | Build site. |
| html | 0548273 | Jeffrey Pullin | 2022-05-02 | Build site. |
| Rmd | 50bca7c | Jeffrey Pullin | 2022-05-02 | workflowr::wflow_publish(all = TRUE, republish = TRUE) |
| html | 50bca7c | Jeffrey Pullin | 2022-05-02 | workflowr::wflow_publish(all = TRUE, republish = TRUE) |
| html | 5cc008f | Jeffrey Pullin | 2022-02-09 | Build site. |
| Rmd | d1aca16 | Jeffrey Pullin | 2022-02-09 | Refresh website |
| html | d1aca16 | Jeffrey Pullin | 2022-02-09 | Refresh website |
| Rmd | aca9ad2 | Jeffrey Pullin | 2021-11-29 | Various changes made in the last days before thesis submission |
| Rmd | ddb1eeb | Jeffrey Pullin | 2021-09-28 | Update time analyses |
| Rmd | 16c471e | Jeffrey Pullin | 2021-09-22 | Polish time plots |
| Rmd | e552e95 | Jeffrey Pullin | 2021-09-21 | Extend time analysis |
| Rmd | 17f2a0f | Jeffrey Pullin | 2021-08-07 | Add new plots and analysis for lab meeting 5/8/2021 |
| Rmd | ef9f1c7 | Jeffrey Pullin | 2021-08-02 | Add code to plot time of methods on real data |
| Rmd | 864677c | Jeffrey Pullin | 2021-07-21 | Add mini wilcoxon speed analysis |
| html | 61ee246 | Jeffrey Pullin | 2021-04-13 | Build site. |
| Rmd | b5b2a88 | Jeffrey Pullin | 2021-04-13 | Add new results |
| Rmd | 3a4cb2e | Jeffrey Pullin | 2021-03-16 | Update 16/3/2021 |
| html | ca82ce0 | Jeffrey Pullin | 2021-02-16 | Build site. |
| html | 2863555 | Jeffrey Pullin | 2021-02-10 | Build site. |
| Rmd | ffe660c | Jeffrey Pullin | 2021-02-09 | Update 9/2/2021 |
library(tibble)
library(dplyr)
library(ggplot2)
library(tidyr)
library(purrr)
library(forcats)
library(patchwork)
library(stringr)
library(ggrepel)

source(here::here("code", "analysis-utils.R"))
source(here::here("code", "plot-utils.R"))
Aim
Measure the time different methods take to run.
Simulated data
sim_pars <- retrive_simulation_parameters()

num_cells_time_data <- sim_pars %>%
  filter(sim_label == "num_cells") %>%
  rowwise() %>%
  mutate(time = readRDS(full_filename)$time) %>%
  ungroup()

num_clusters_time_data <- sim_pars %>%
  filter(sim_label == "num_clusters") %>%
  rowwise() %>%
  mutate(time = readRDS(full_filename)$time) %>%
  ungroup()
All methods, number of cells
label_pars <- c(
  "scanpy_wilcoxontiecorrect_rankby_abs",
  "scanpy_t_rankby_abs",
  "edger_ql",
  "scran_t_any",
  "nsforest",
  "scran_wilcox_some",
  "cepo",
  "rankcorr_2",
  "seurat_negbinom",
  "limma_trend",
  "glmgampoi",
  "seurat_t",
  "seurat_MAST",
  "scanpy_wilcoxon_rankby_abs",
  "presto"
)

time_by_num_cells_plot <- num_cells_time_data %>%
  # Remove methods we implemented.
  filter(!(pars %in% c("lm_two_sample", "logfc_abs", "logfc_raw", "random"))) %>%
  group_by(pars, method, batchCells) %>%
  summarise(time = mean(time), .groups = "drop") %>%
  mutate(method = method_lookup[method]) %>%
  ggplot(aes(x = batchCells, y = time, colour = method)) +
  geom_point() +
  geom_smooth(se = FALSE, formula = y ~ x, method = "loess", span = 1) +
  geom_text_repel(
    aes(label = if_else(
      pars %in% label_pars & batchCells == 100000,
      pars_lookup[pars],
      ""),
    ),
    hjust = -0.1, colour = "black", size = 3, xlim = c(101000, NA)
  ) +
  external_package_colour +
  coord_cartesian(xlim = c(1000, 120000)) +
  scale_x_continuous(
    breaks = c(1000, 25000, 50000, 75000, 100000),
  ) +
  scale_y_log10(
    breaks = c(1, 10, 60, 600, 3600, 10800, 21600),
    labels = c("1s", "10s", "1m", "10min", "1hr", "3hr", "6hr")
  )  +
  labs(
    title = "Runtime vs. total number of cells",
    x = "Number of cells",
    y = "Time (s)",
    colour = "Package"
  ) +
  guides(color = "none") +
  theme_bw()

time_by_num_cells_plot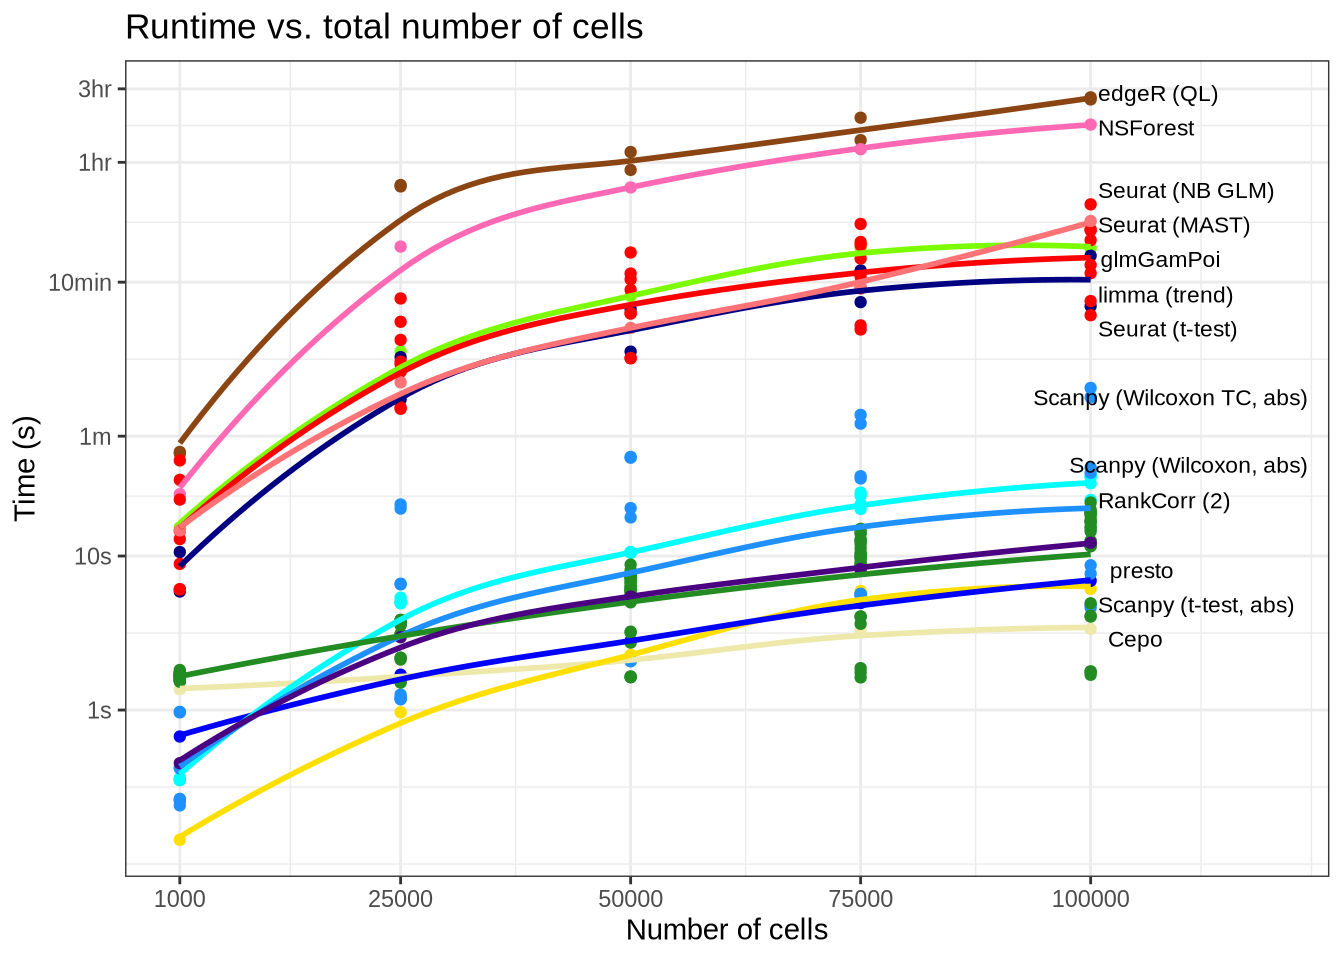
saveRDS(time_by_num_cells_plot, here::here("figures", "raw", "time-num-cells.rds"))All methods, number of clusters
label_pars <- c(
  "scanpy_wilcoxontiecorrect_rankby_abs",
  "scanpy_t_rankby_abs",
  "edger_ql",
  "scran_t_any",
  "nsforest",
  "scran_wilcox_some",
  "cepo",
  "rankcorr_2",
  "seurat_negbinom",
  "limma_trend",
  "glmgampoi",
  "seurat_t",
  "seurat_MAST",
  "scanpy_wilcoxon_rankby_abs",
  "presto"
)

time_by_num_clusters_plot <- num_clusters_time_data %>%
  # Remove methods we implemented.
  filter(!(pars %in% c("lm_two_sample", "logfc_abs", "logfc_raw", "random"))) %>%
  group_by(pars, method, n_clus) %>%
  summarise(time = mean(time), .groups = "drop") %>%
  mutate(method = method_lookup[method]) %>%
  ggplot(aes(x = n_clus, y = time, colour = method)) +
  geom_point() +
  geom_smooth(se = FALSE, formula = y ~ x, method = "loess", span = 1) +
  external_package_colour +
  geom_text_repel(
    aes(label = if_else(
      pars %in% label_pars & n_clus == 20,
      pars_lookup[pars],
      ""),
    ),
    hjust = -0.1, colour = "black", size = 3,  xlim = c(20.5, NA)
  ) +
  coord_cartesian(xlim = c(5, 24)) +
  scale_x_continuous(
    breaks = c(5, 10, 15, 20),
  ) +
  scale_y_log10(
    breaks = c(1, 10, 60, 600, 3600),
    labels = c("1s", "10s", "1m", "10min", "1hr")
  )  +
  labs(
    title = "Runtime vs. number of clusters",
    x = "Number of clusters",
    y = "Time (s)",
    colour = "Package"
  ) +
  guides(color = "none") +
  theme_bw()

time_by_num_clusters_plot
Warning: ggrepel: 1 unlabeled data points (too many overlaps). Consider
increasing max.overlaps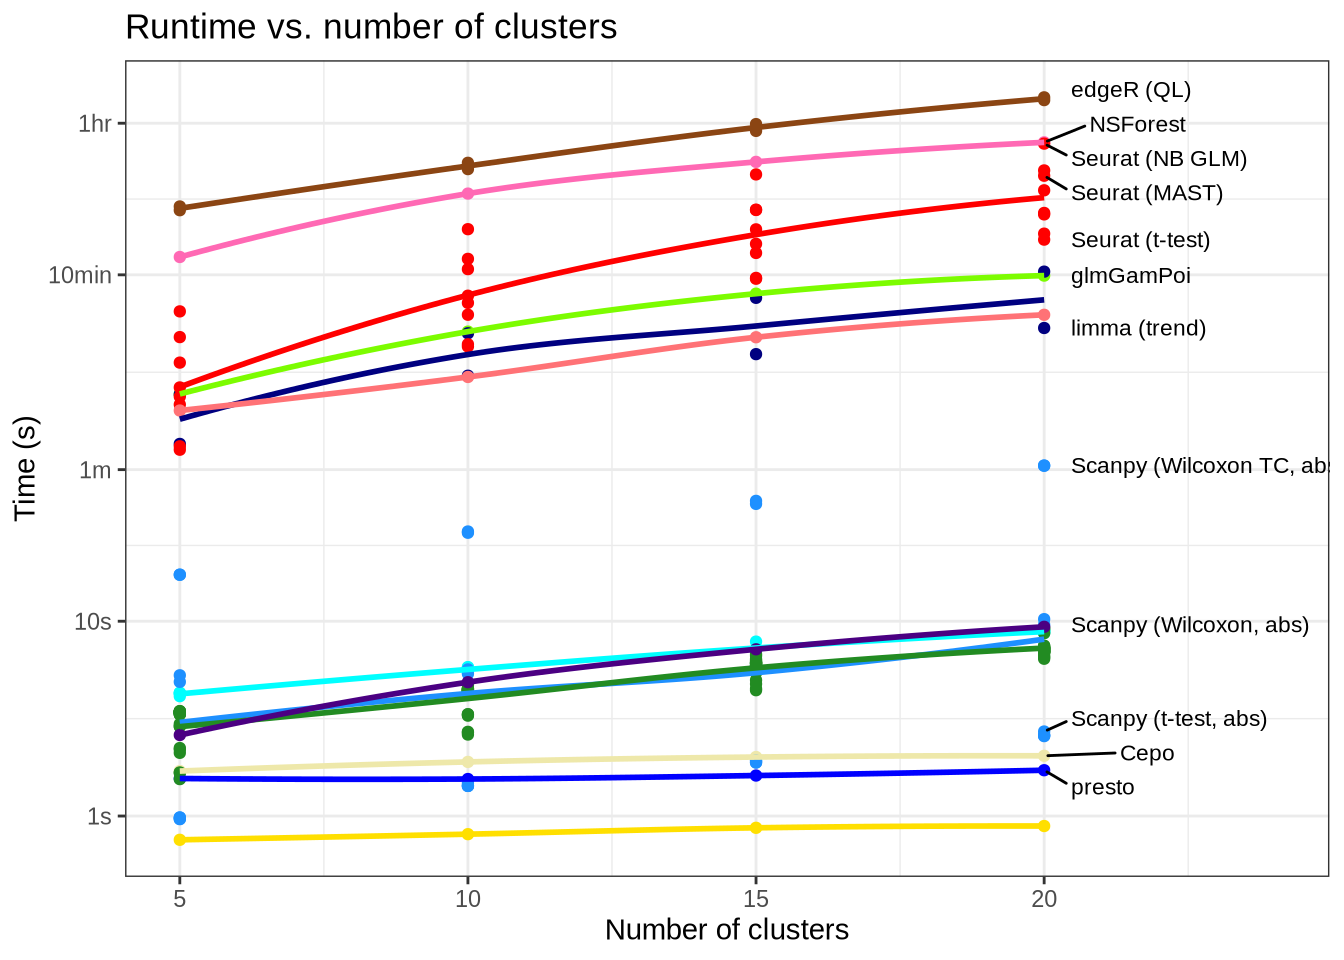
saveRDS(time_by_num_clusters_plot, here::here("figures", "raw", "time-num-clusters.rds"))Specific time values
num_cells_time_data %>%
 # Remove methods we implemented.
 filter(!(pars %in% c("lm_two_sample", "logfc_abs", "logfc_raw", "random"))) %>%
 group_by(pars, method, batchCells) %>%
 summarise(time = mean(time), .groups = "drop") %>%
 mutate(
   min = time / 60,
   hour = min / 60
 ) %>%
 filter(pars %in% c("edger_ql", "presto",
                    "seurat_wilcox", "scanpy_wilcoxontiecorrect_rankby_abs",
                    "scran_wilcox_any")) %>%
 print(n = 40)
# A tibble: 20 × 6
pars method batchCells time min hour
<chr> <chr> <int> <dbl> <dbl> <dbl>
1 edger_ql edger 1000 4.74e+1 7.90e-1 1.32e-2
2 edger_ql edger 25000 2.56e+3 4.27e+1 7.12e-1
3 edger_ql edger 50000 4.20e+3 7.00e+1 1.17e+0
4 edger_ql edger 75000 7.01e+3 1.17e+2 1.95e+0
5 edger_ql edger 100000 9.51e+3 1.59e+2 2.64e+0
6 presto presto 1000 6.73e-1 1.12e-2 1.87e-4
7 presto presto 25000 1.69e+0 2.82e-2 4.71e-4
8 presto presto 50000 2.82e+0 4.69e-2 7.82e-4
9 presto presto 75000 4.95e+0 8.26e-2 1.38e-3
10 presto presto 100000 6.91e+0 1.15e-1 1.92e-3
11 scanpy_wilcoxontiecorrect_rankby_a… scanpy 1000 9.73e-1 1.62e-2 2.70e-4
12 scanpy_wilcoxontiecorrect_rankby_a… scanpy 25000 2.03e+1 3.39e-1 5.65e-3
13 scanpy_wilcoxontiecorrect_rankby_a… scanpy 50000 4.40e+1 7.33e-1 1.22e-2
14 scanpy_wilcoxontiecorrect_rankby_a… scanpy 75000 7.24e+1 1.21e+0 2.01e-2
15 scanpy_wilcoxontiecorrect_rankby_a… scanpy 100000 1.07e+2 1.79e+0 2.98e-2
16 seurat_wilcox seurat 1000 8.89e+0 1.48e-1 2.47e-3
17 seurat_wilcox seurat 25000 1.57e+2 2.62e+0 4.37e-2
18 seurat_wilcox seurat 50000 6.82e+2 1.14e+1 1.89e-1
19 seurat_wilcox seurat 75000 1.04e+3 1.74e+1 2.90e-1
20 seurat_wilcox seurat 100000 1.32e+3 2.20e+1 3.67e-1Seurat methods, number of cells
num_cells_time_data %>%
  filter(method == "seurat") %>%
  group_by(pars, test.use, batchCells) %>%
  summarise(time = mean(time), .groups = "drop") %>%
  mutate(test.use = test.use_lookup[test.use]) %>%
  ggplot(aes(x = batchCells, y = time, colour = test.use)) +
  geom_jitter(width = 200) +
  scale_x_continuous(
    breaks = c(1000, 25000, 50000, 75000, 100000)
  ) +
  scale_y_log10(
    breaks = c(1, 10, 60, 600, 3600, 10800),
    labels = c("1s", "10s", "1m", "10min", "1hr", "3hr")
  )  +
  labs(
    title = "Runtime vs total number of cells",
    x = "Number of cells",
    y = "Time (s)",
    colour = "Parameters"
  ) +
  theme_bw()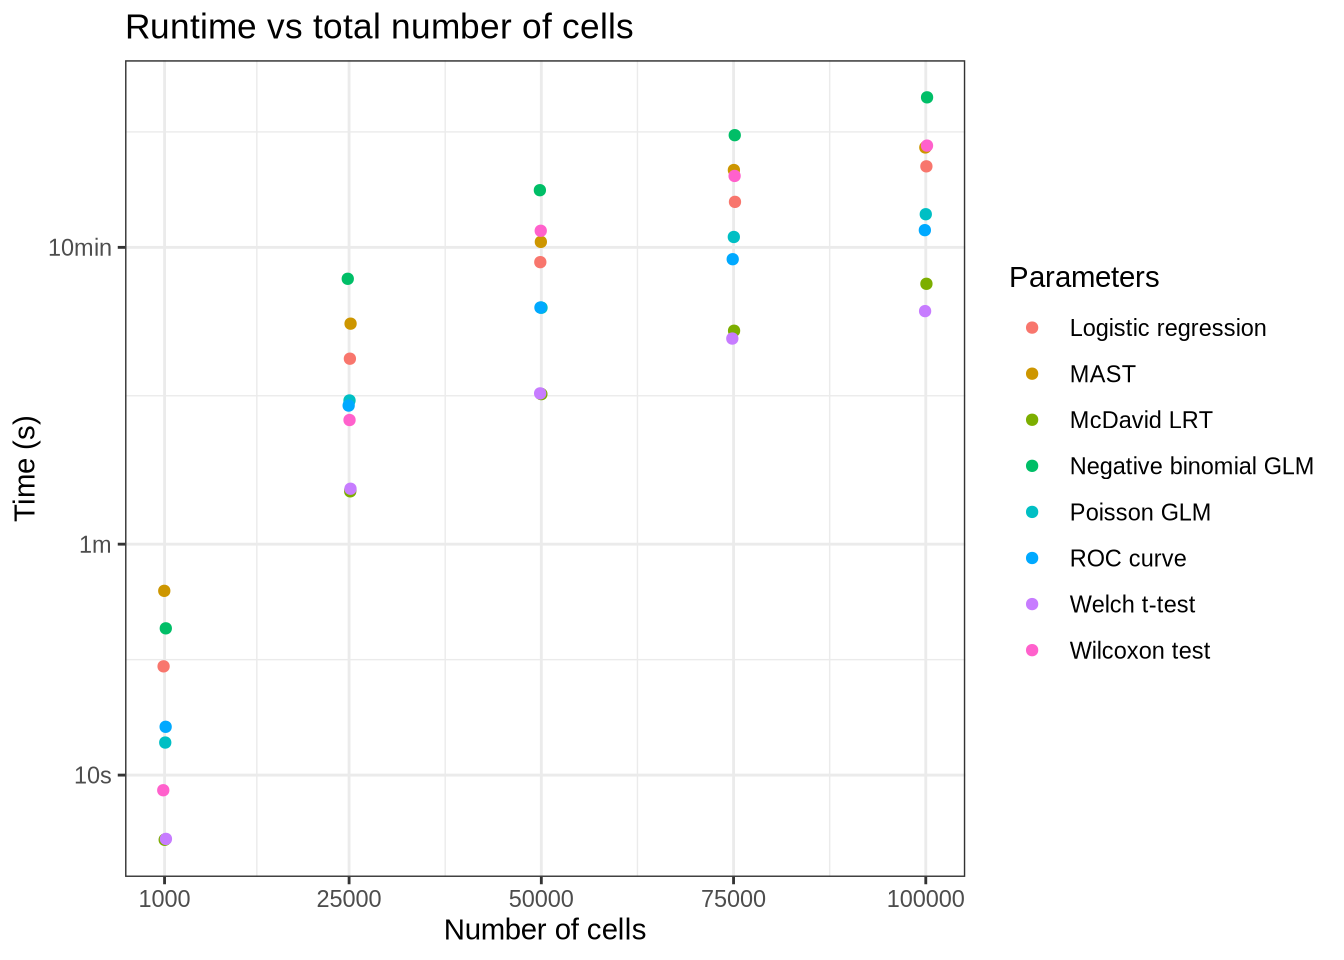
scran methods, number of cells
num_cells_time_data %>%
  filter(method == "scran") %>%
  group_by(pars, test.type, pval.type, batchCells) %>%
  summarise(time = mean(time), .groups = "drop") %>%
  mutate(scran_pars = paste0(test.type, "_", pval.type)) %>%
  ggplot(aes(x = batchCells, y = time, colour = scran_pars)) +
  geom_point() +
  scale_x_continuous(
    breaks = c(1000, 25000, 50000, 75000, 100000)
  ) +
  labs(
    title = "Runtime vs total number of cells",
    x = "Number of cells",
    y = "Time (s)",
    colour = "Parameters"
  ) +
  theme_bw()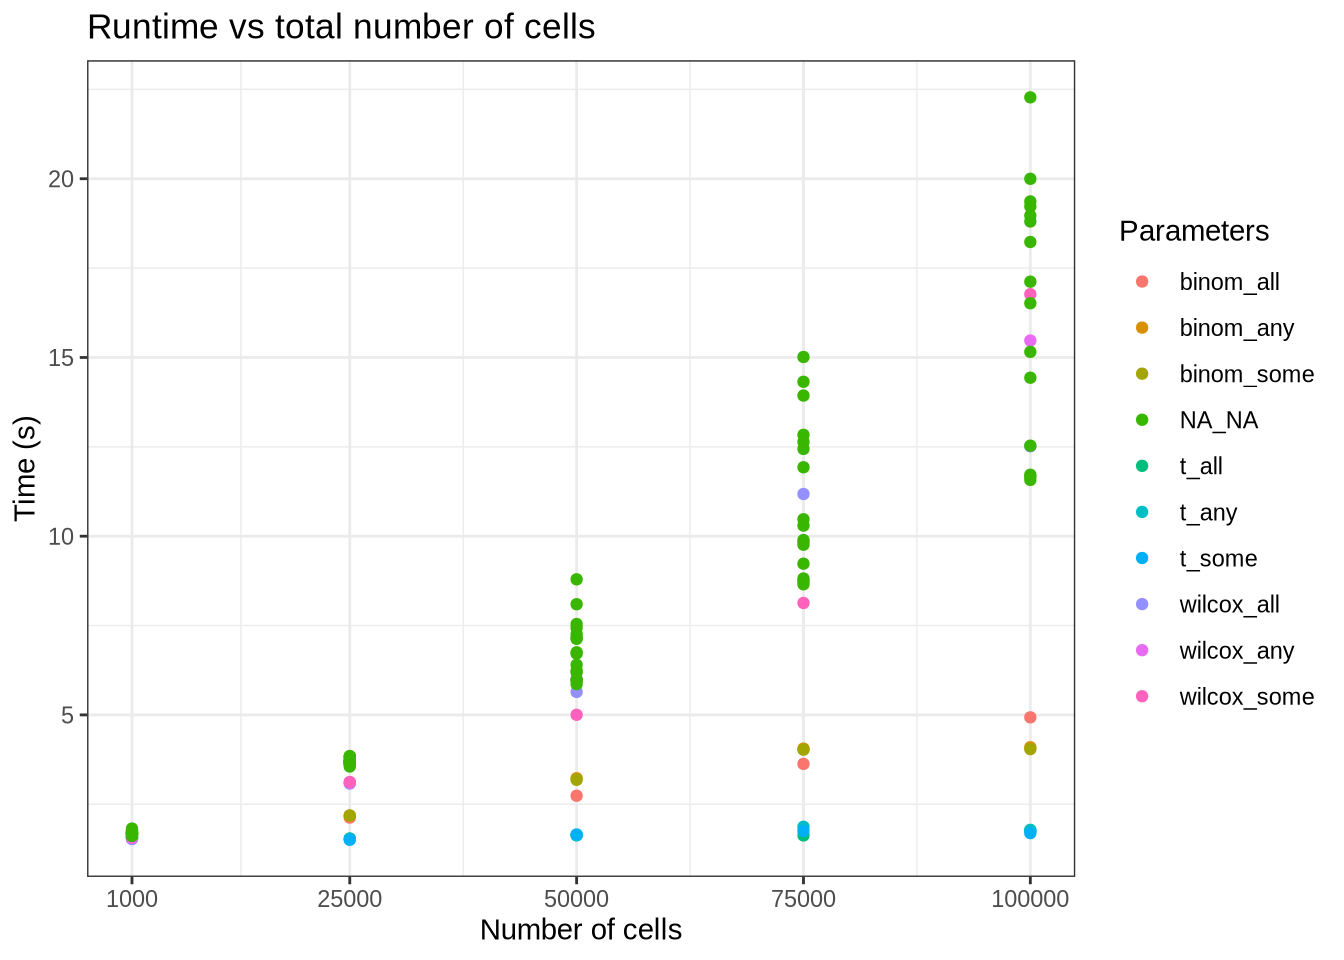
Scanpy methods, number of cells
num_cells_time_data %>%
  filter(method == "scanpy") %>%
  group_by(pars, test_use, rankby_abs, batchCells) %>%
  summarise(time = mean(time), .groups = "drop") %>%
  mutate(rankby_abs = if_else(rankby_abs == "True", "abs", "raw")) %>%
  mutate(scran_pars = paste0(test_use, "_", rankby_abs)) %>%
  ggplot(aes(x = batchCells, y = time, colour = scran_pars)) +
  geom_point() +
  scale_x_continuous(
    breaks = c(1000, 25000, 50000, 75000, 100000)
  ) +
  labs(
    title = "Runtime vs total number of cells",
    x = "Number of cells",
    y = "Time (s)",
    colour = "Parameters"
  ) +
  theme_bw()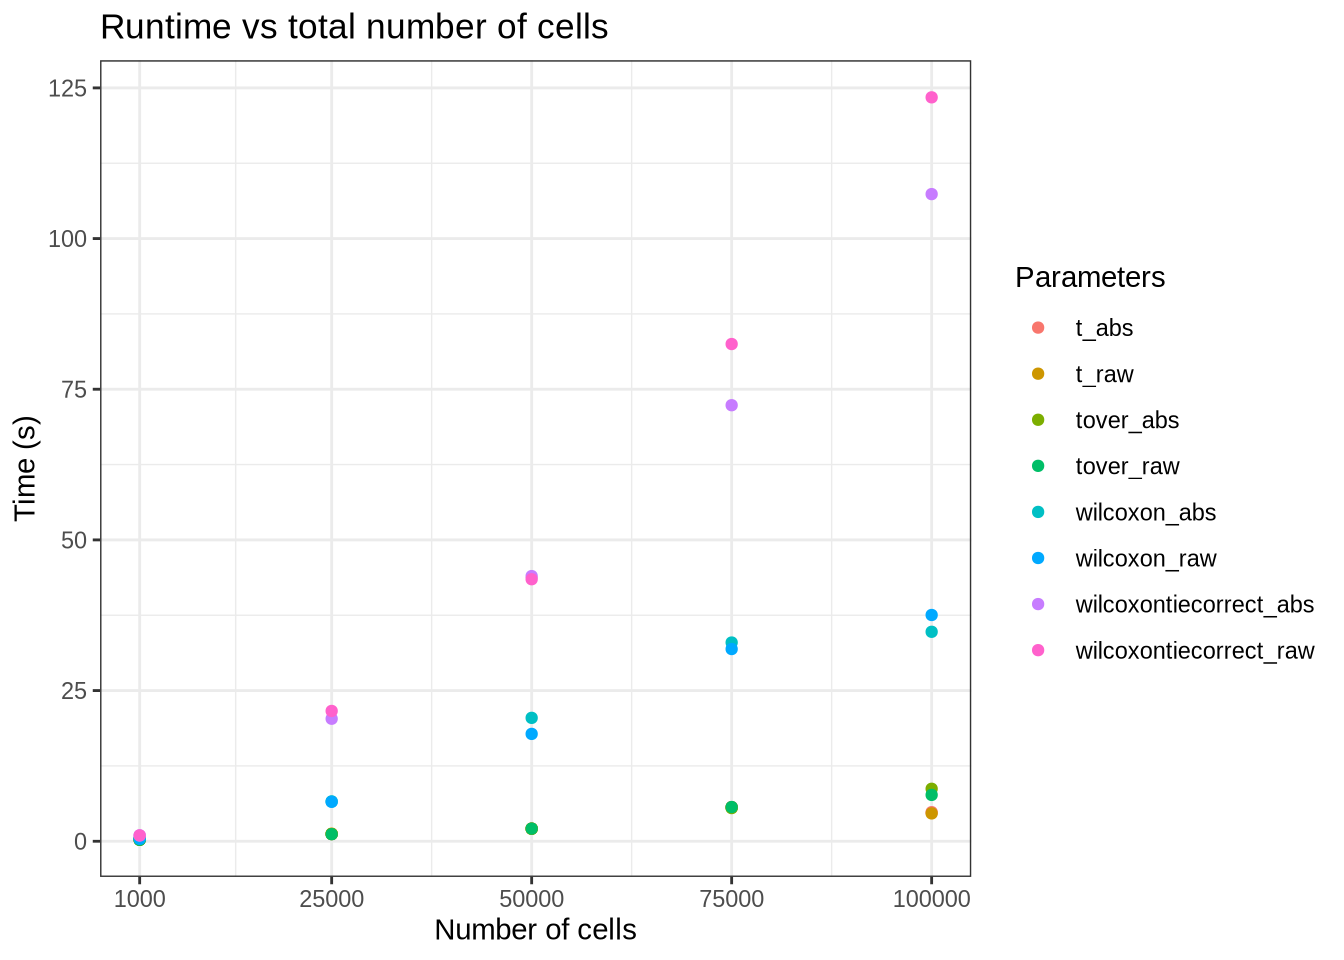
Real data
real_data_data <- retrieve_real_data_parameters() %>%
  rowwise() %>%
  mutate(time = readRDS(full_filename)$time) %>%
  ungroup()
pbmc3k
real_data_data %>%
  filter(data_id == "pbmc3k") %>%
  filter(!(pars %in% c("lm_two_sample", "random"))) %>%
  mutate(
    pars = pars_lookup[pars],
    plot_method = method_lookup[method]
  ) %>%
  mutate(pars = fct_reorder(factor(pars), time)) %>%
  mutate(ms = 1000 * time) %>%
  ggplot(aes(x = pars, y = ms, colour = plot_method)) +
  geom_point(alpha = 0.8, size = 3) +
  external_package_colour +
  scale_y_log10(
    breaks = c(500, 1000, 10000, 60000, 600000),
    labels = c("0.5s", "1s", "10s", "1m", "10min")
  ) +
  coord_flip() +
  labs(
    y = "Time (log scale)",
    x = "Method",
    title = "pbmc3k data",
    colour = "Package"
  ) +
  theme_bw()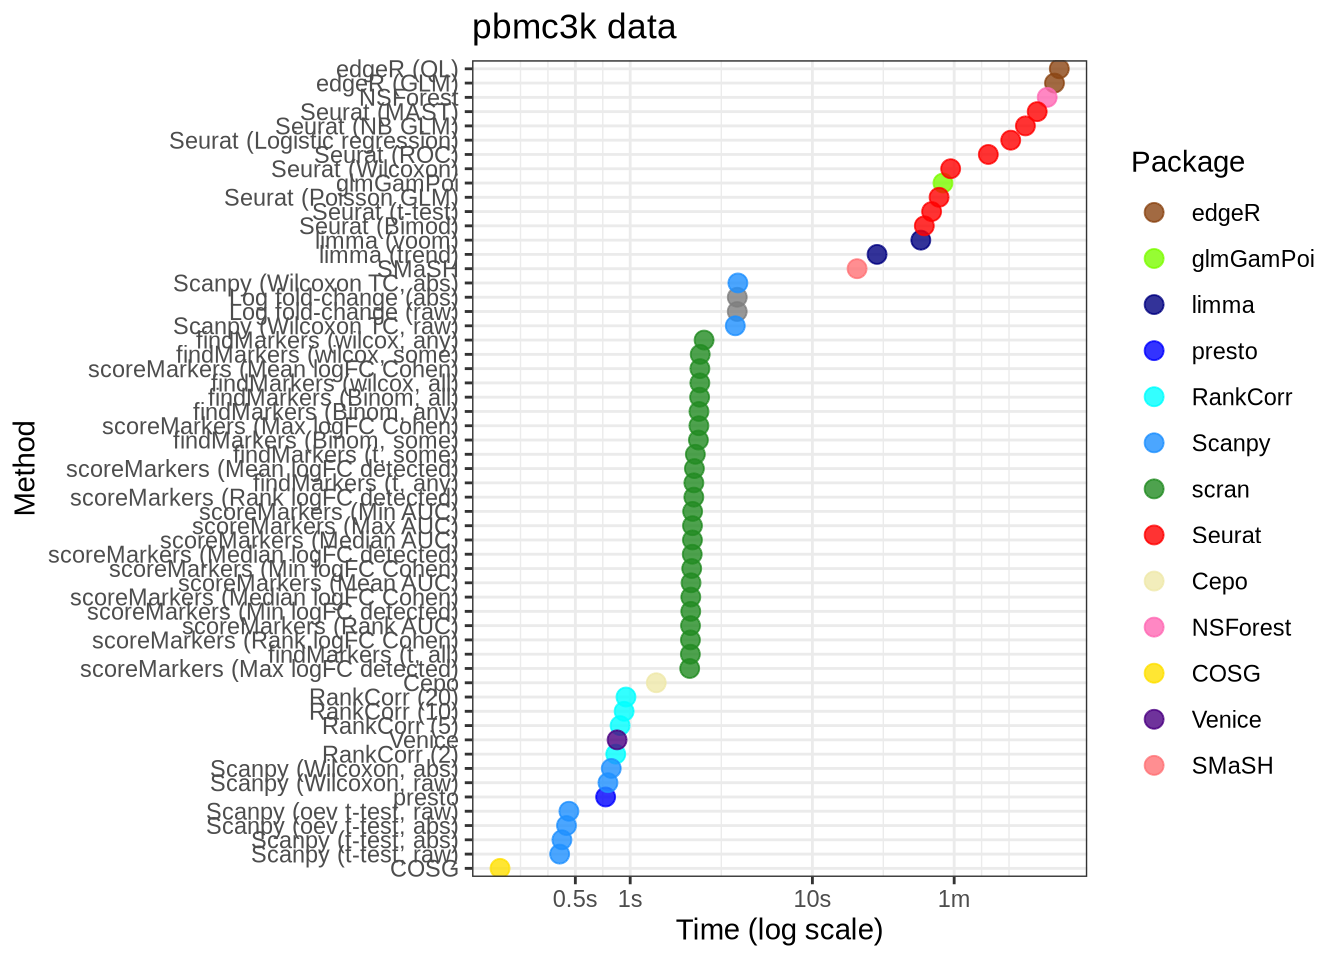
Lawlor
real_data_data %>%
  filter(data_id == "lawlor") %>%
  filter(!(pars %in% c("lm_two_sample", "random"))) %>%
  mutate(
    pars = pars_lookup[pars],
    plot_method = method_lookup[method]
  ) %>%
  mutate(pars = fct_reorder(factor(pars), time)) %>%
  mutate(ms = 1000 * time) %>%
  ggplot(aes(x = pars, y = ms, colour = plot_method)) +
  geom_point(alpha = 0.8, size = 3) +
  external_package_colour +
  scale_y_log10(
    breaks = c(500, 1000, 10000, 60000, 600000),
    labels = c("0.5s", "1s", "10s", "1m", "10min")
  ) +
  coord_flip() +
  labs(
    y = "Time (log scale)",
    x = "Method",
    title = "Lawlor data",
    colour = "Package"
  ) +
  theme_bw()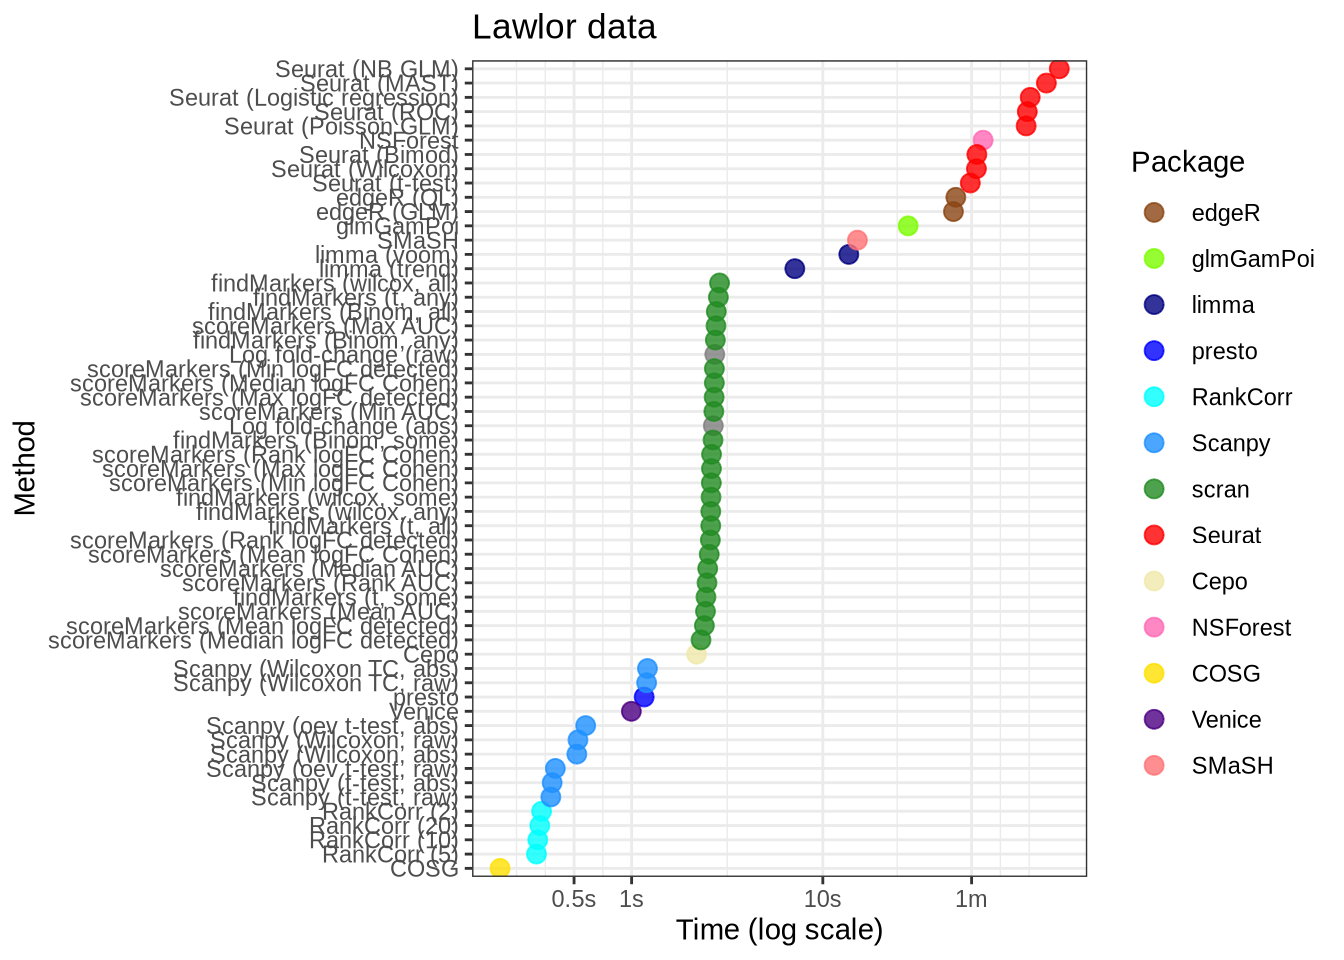
Zeisel
real_data_data %>%
  filter(data_id == "zeisel") %>%
  filter(!(pars %in% c("lm_two_sample", "random"))) %>%
  mutate(
    pars = pars_lookup[pars],
    plot_method = method_lookup[method]
  ) %>%
  mutate(pars = fct_reorder(factor(pars), time)) %>%
  mutate(ms = 1000 * time) %>%
  ggplot(aes(x = pars, y = ms, colour = plot_method)) +
  geom_point(alpha = 0.8, size = 3) +
  external_package_colour +
  scale_y_log10(
    breaks = c(500, 1000, 10000, 60000, 600000),
    labels = c("0.5s", "1s", "10s", "1m", "10min")
  ) +
  coord_flip() +
  labs(
    y = "Time (log scale)",
    x = "Method",
    title = "Zeisel data",
    colour = "Package"
  ) +
  theme_bw()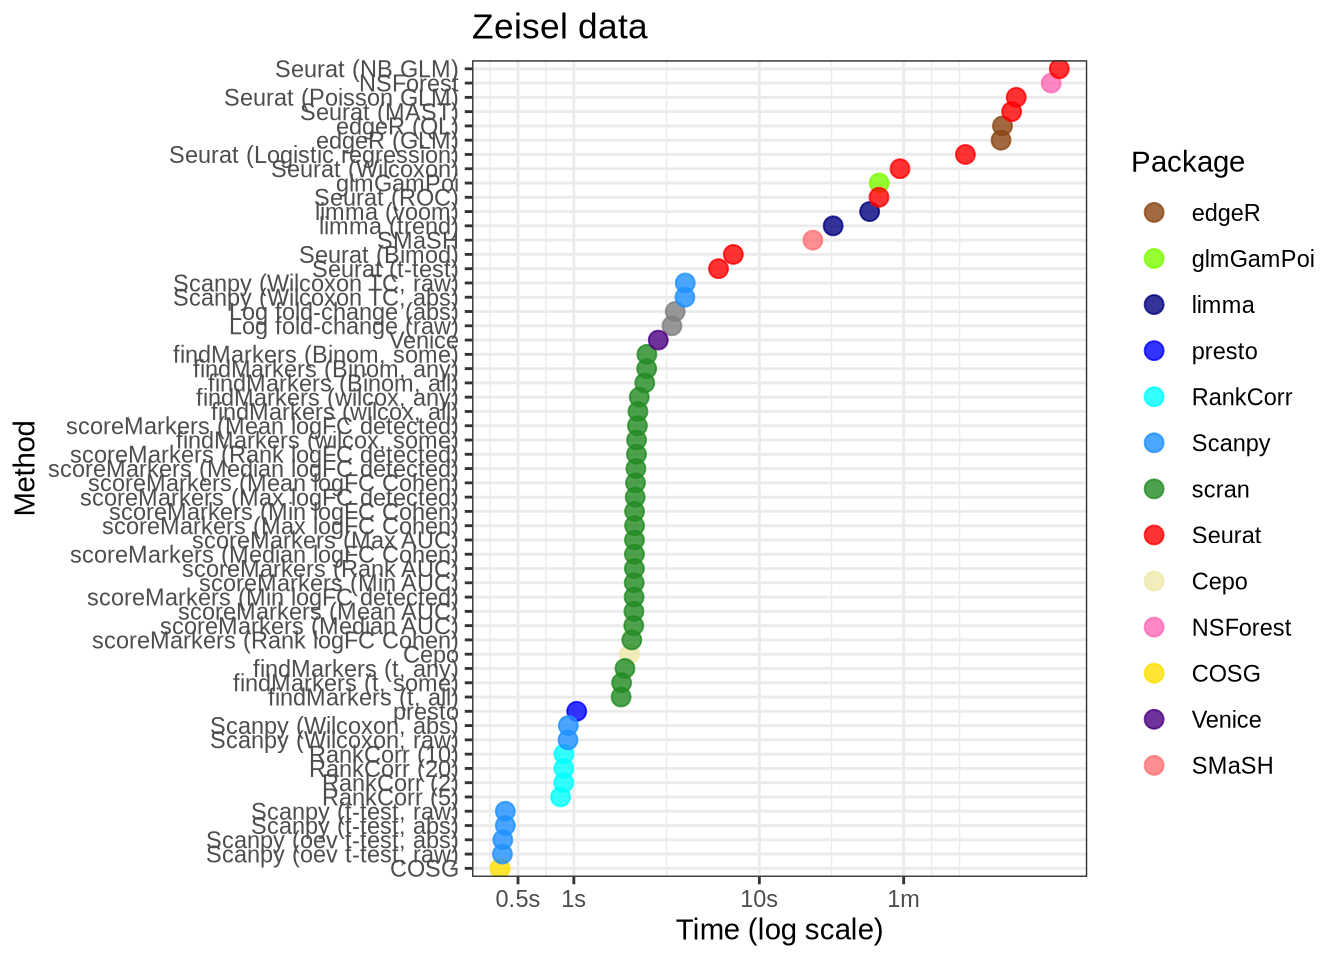
Endothelial
real_data_data %>%
  filter(data_id == "endothelial") %>%
  filter(!(pars %in% c("lm_two_sample", "difference_log_fc", "random"))) %>%
  mutate(
    pars = pars_lookup[pars],
    plot_method = method_lookup[method]
  ) %>%
  mutate(pars = fct_reorder(factor(pars), time)) %>%
  mutate(ms = 1000 * time) %>%
  ggplot(aes(x = pars, y = ms, colour = plot_method)) +
  geom_point(size = 3) +
  external_package_colour +
  scale_y_log10(
    breaks = c(1000, 10000, 60000, 600000, 3600000, 18000000),
    labels = c("1s", "10s", "1m", "10min", "1hr", "5hr")
  ) +
  coord_flip() +
  labs(
    y = "Time (log scale)",
    x = "Method",
    title = "Endothelial data",
    colour = "Package"
  ) +
  theme_bw()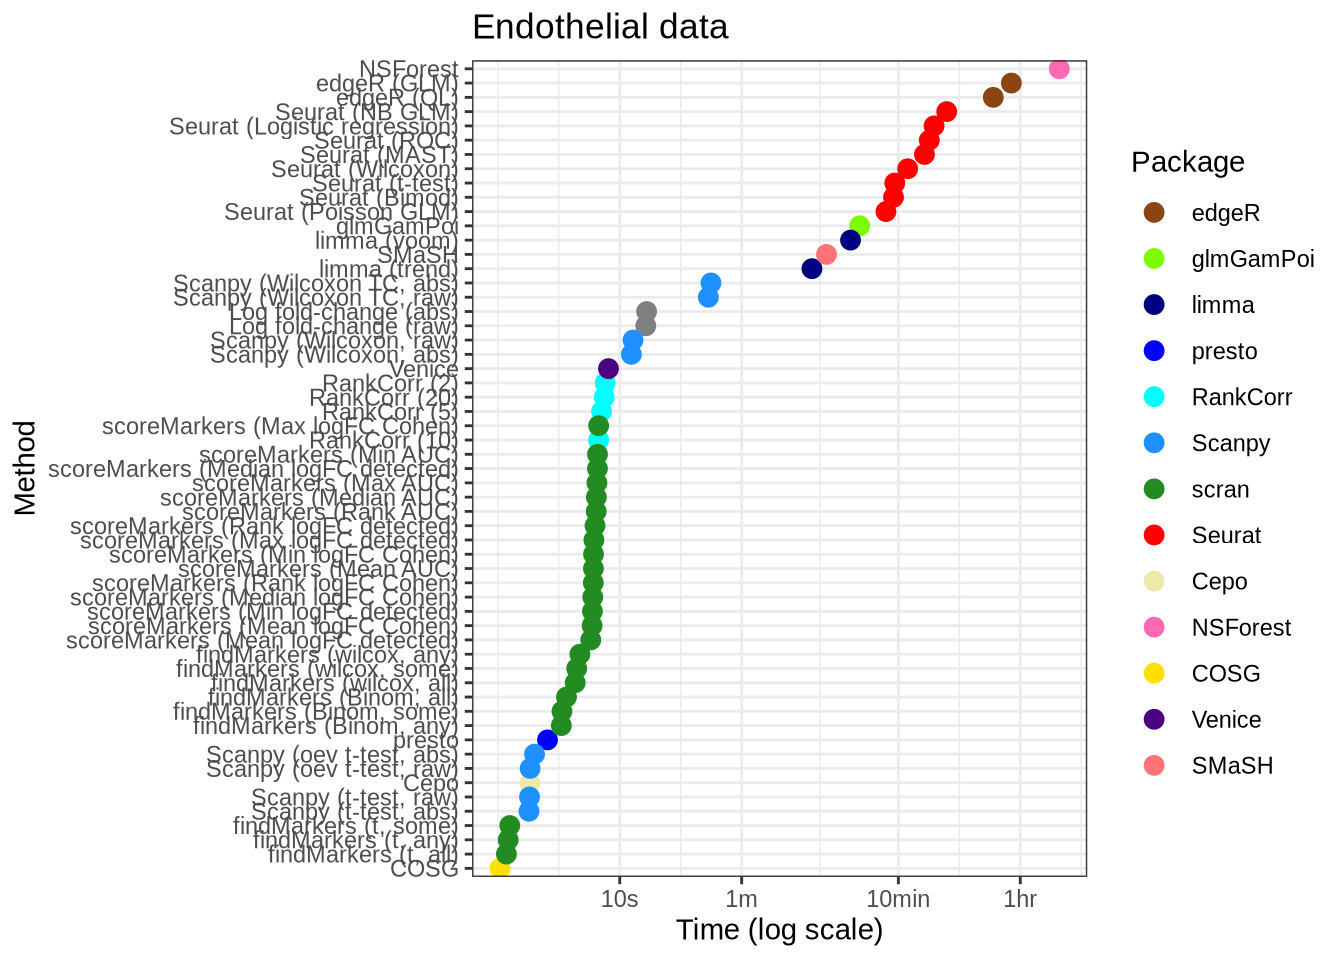
Zhao
zhao_time <- real_data_data %>%
  filter(data_id == "zhao") %>%
  filter(!(pars %in% c("lm_two_sample", "logfc_abs", "logfc_raw", "random"))) %>%
   mutate(
    pars = pars_lookup[pars],
    plot_method = method_lookup[method]
  ) %>%
  mutate(pars = fct_reorder(factor(pars), time)) %>%
  mutate(ms = 1000 * time) %>%
  ggplot(aes(x = pars, y = ms, colour = plot_method)) +
  geom_point(size = 3) +
  external_package_colour +
  scale_y_log10(
    breaks = c(1000, 10000, 60000, 600000, 3600000, 18000000, 43200000),
    labels = c("1s", "10s", "1m", "10min", "1hr", "5hr", "12hr")
  ) +
  coord_flip() +
  labs(
    y = "Time (log scale)",
    x = "Method",
    title = "Zhao data",
    colour = "Package"
  ) +
  theme_bw()

zhao_time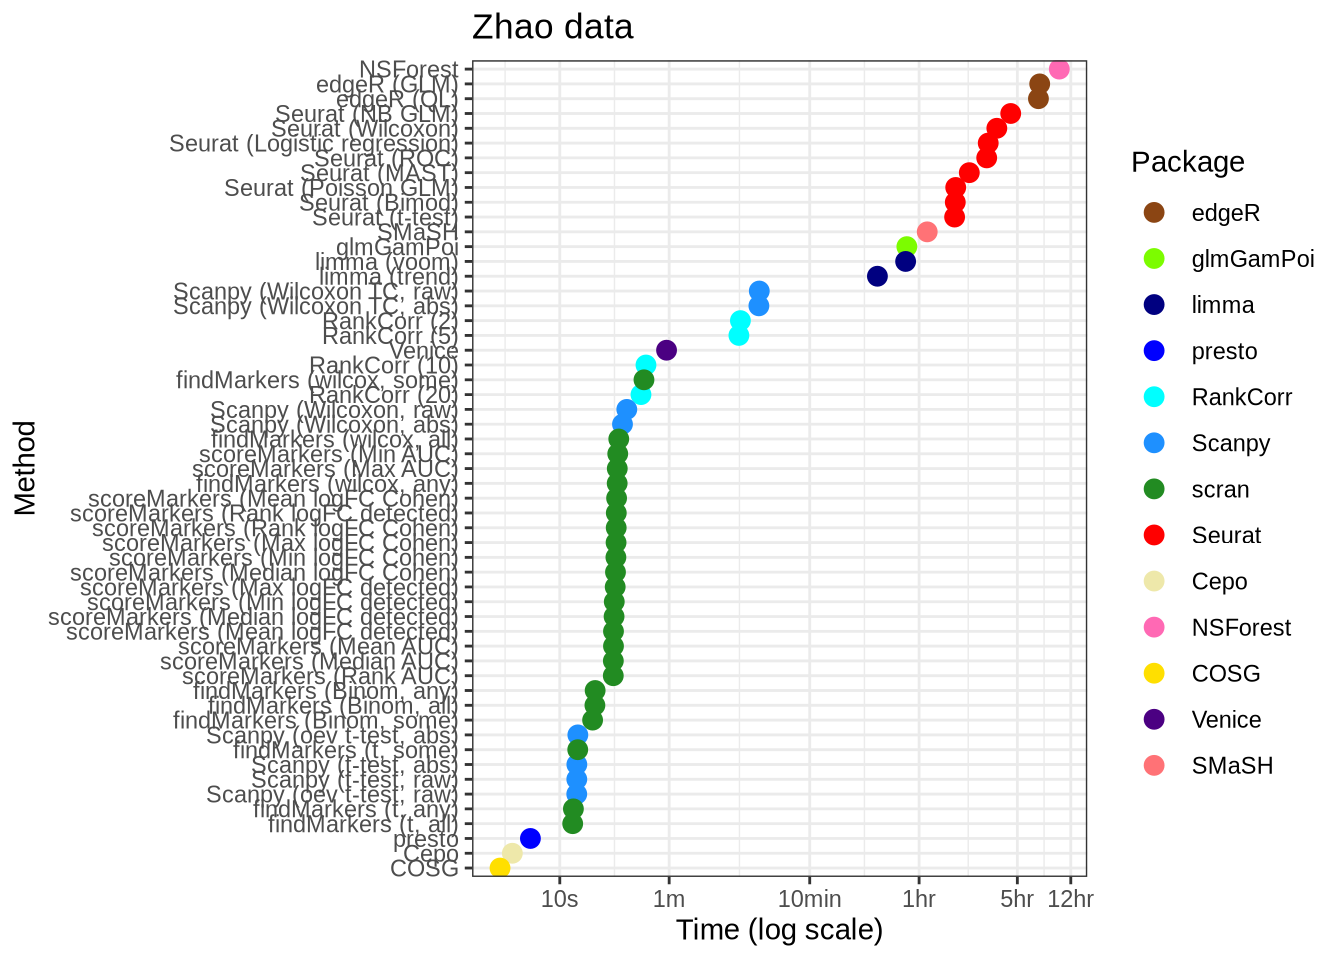
saveRDS(zhao_time, here::here("figures", "raw", "zhao-time.rds"))Overall
overall_time <- real_data_data %>%
  filter(!(pars %in% c("lm_two_sample", "logfc_abs", "logfc_raw", "random"))) %>%
  mutate(ms = time * 1000) %>%
  mutate(log_time = log(ms, base = 10)) %>%
  mutate(
    plot_method = method_lookup[method],
    plot_pars = pars_lookup[pars],
    plot_data_id = dataset_lookup[data_id]
  ) %>%
  mutate(plot_pars = fct_reorder(factor(plot_pars), time)) %>%
  ggplot(aes(x = plot_data_id, y = plot_pars)) +
  geom_tile(aes(fill = log_time), colour = "black") +
  scale_fill_distiller(
    breaks = log(c(1000, 10000, 60000, 600000, 3600000, 21600000), base = 10),
    labels = c("1s", "10s", "1m", "10min", "1hr", "6hr"),
    palette = "RdYlBu") +
  theme_bw() +
  labs(
    title = "Time across datasets",
    x = "Dataset",
    y = "Method",
    fill = "Time",
  ) +
  theme(
    panel.grid.major = element_blank(),
    panel.grid.minor = element_blank(),
    panel.border = element_blank(),
    axis.ticks.y = element_blank(),
    axis.text.x = element_text(angle = 45, vjust = 1, hjust = 1)
  )
overall_time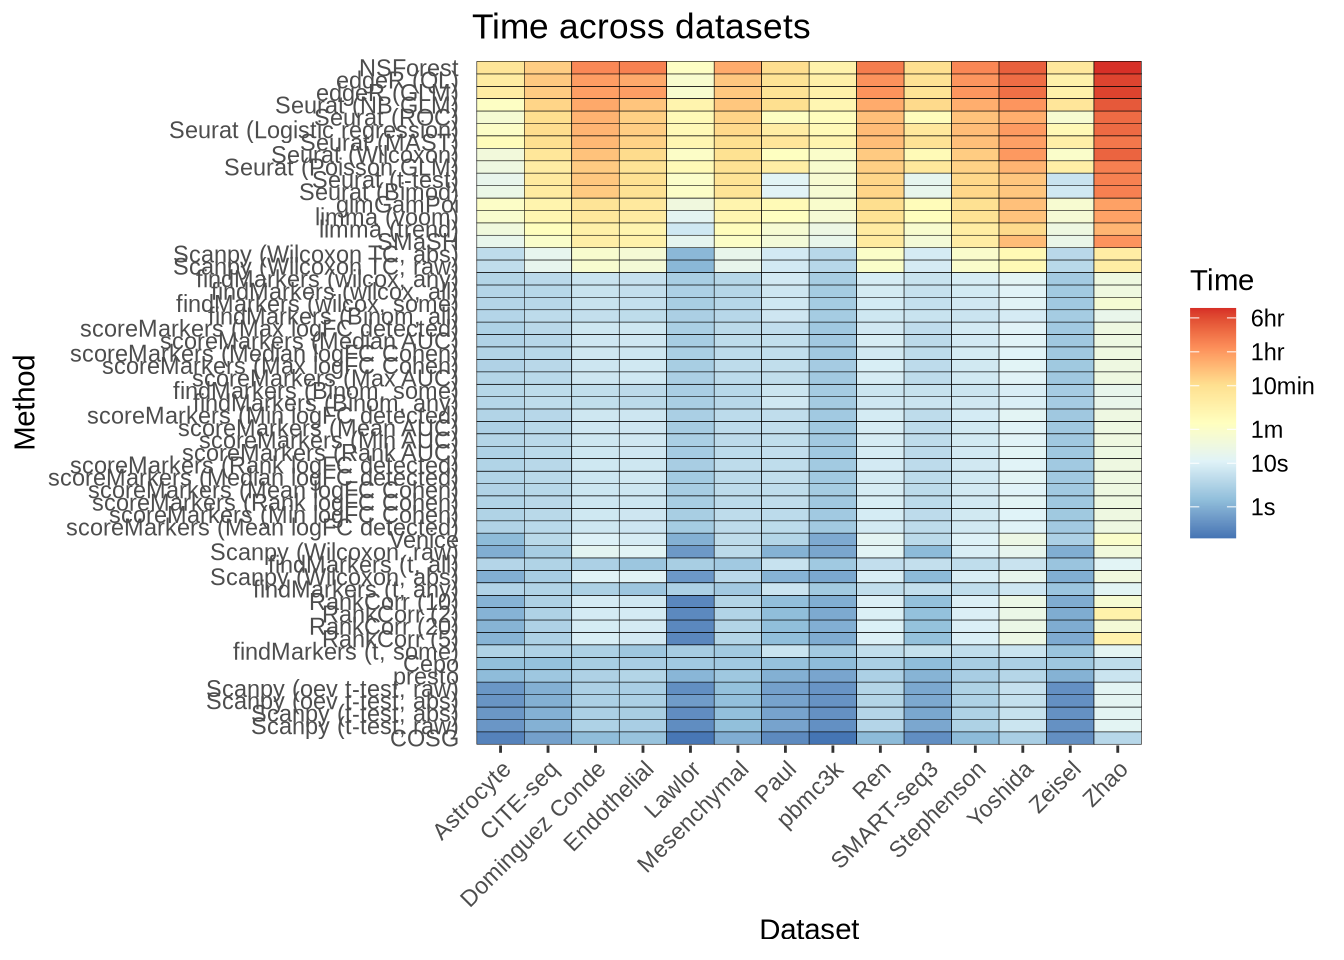
saveRDS(overall_time, here::here("figures", "raw", "overall-time.rds"))Specific values
real_data_data %>%
 # Remove methods we implemented.
 filter(!(pars %in% c("lm_two_sample", "logfc_abs", "logfc_raw", "random"))) %>%
 filter(data_id %in% c("citeseq", "zhao")) %>%
 mutate(
   min = time / 60,
   hour = min / 60
 ) %>%
 select(data_id, time, pars, min, hour) %>%
 filter(pars %in% c("edger_ql", "presto", "seurat_t",
                    "seurat_wilcox", "scanpy_t_rankby_abs",
                    "scran_t_any", "scanpy_t")) %>%
 print(n = 40)
# A tibble: 10 × 5
data_id time pars min hour
<chr> <dbl> <chr> <dbl> <dbl>
1 citeseq 1114. edger_ql 18.6 0.310
2 citeseq 2.00 presto 0.0333 0.000555
3 citeseq 0.999 scanpy_t_rankby_abs 0.0167 0.000278
4 citeseq 333. seurat_t 5.56 0.0926
5 citeseq 401. seurat_wilcox 6.69 0.112
6 zhao 25429. edger_ql 424. 7.06
7 zhao 6.18 presto 0.103 0.00172
8 zhao 13.2 scanpy_t_rankby_abs 0.220 0.00367
9 zhao 6441. seurat_t 107. 1.79
10 zhao 12862. seurat_wilcox 214. 3.57
devtools::session_info()─ Session info ──────────────────────────────────────────────────────────────
hash: person walking: dark skin tone, mage: light skin tone, backhand index pointing right: medium skin tone
setting value
version R version 4.1.2 (2021-11-01)
os Red Hat Enterprise Linux 9.2 (Plow)
system x86_64, linux-gnu
ui X11
language (EN)
collate en_AU.UTF-8
ctype en_AU.UTF-8
tz Australia/Melbourne
date 2024-01-01
pandoc 2.18 @ /apps/easybuild-2022/easybuild/software/MPI/GCC/11.3.0/OpenMPI/4.1.4/RStudio-Server/2022.07.2+576-Java-11-R-4.1.2/bin/pandoc/ (via rmarkdown)
─ Packages ───────────────────────────────────────────────────────────────────
package * version date (UTC) lib source
assertthat 0.2.1 2019-03-21 [2] CRAN (R 4.1.2)
bslib 0.3.1 2021-10-06 [1] CRAN (R 4.1.0)
cachem 1.0.6 2021-08-19 [1] CRAN (R 4.1.0)
callr 3.7.0 2021-04-20 [2] CRAN (R 4.1.2)
cli 3.6.1 2023-03-23 [1] CRAN (R 4.1.0)
colorspace 2.1-0 2023-01-23 [1] CRAN (R 4.1.0)
crayon 1.5.1 2022-03-26 [1] CRAN (R 4.1.0)
DBI 1.1.2 2021-12-20 [1] CRAN (R 4.1.0)
desc 1.4.0 2021-09-28 [2] CRAN (R 4.1.2)
devtools 2.4.2 2021-06-07 [2] CRAN (R 4.1.2)
digest 0.6.29 2021-12-01 [1] CRAN (R 4.1.0)
dplyr * 1.0.9 2022-04-28 [1] CRAN (R 4.1.0)
ellipsis 0.3.2 2021-04-29 [2] CRAN (R 4.1.2)
evaluate 0.14 2019-05-28 [2] CRAN (R 4.1.2)
fansi 1.0.4 2023-01-22 [1] CRAN (R 4.1.0)
farver 2.1.1 2022-07-06 [1] CRAN (R 4.1.0)
fastmap 1.1.0 2021-01-25 [2] CRAN (R 4.1.2)
forcats * 0.5.1 2021-01-27 [2] CRAN (R 4.1.2)
fs 1.5.2 2021-12-08 [1] CRAN (R 4.1.0)
generics 0.1.3 2022-07-05 [1] CRAN (R 4.1.0)
ggplot2 * 3.3.6 2022-05-03 [1] CRAN (R 4.1.0)
ggrepel * 0.9.1 2021-01-15 [2] CRAN (R 4.1.2)
git2r 0.28.0 2021-01-10 [2] CRAN (R 4.1.2)
glue 1.6.0 2021-12-17 [1] CRAN (R 4.1.0)
gtable 0.3.0 2019-03-25 [2] CRAN (R 4.1.2)
here 1.0.1 2020-12-13 [1] CRAN (R 4.1.0)
highr 0.9 2021-04-16 [2] CRAN (R 4.1.2)
htmltools 0.5.2 2021-08-25 [1] CRAN (R 4.1.0)
httpuv 1.6.5 2022-01-05 [1] CRAN (R 4.1.0)
jquerylib 0.1.4 2021-04-26 [2] CRAN (R 4.1.2)
jsonlite 1.8.0 2022-02-22 [1] CRAN (R 4.1.0)
knitr 1.36 2021-09-29 [1] CRAN (R 4.1.0)
labeling 0.4.2 2020-10-20 [2] CRAN (R 4.1.2)
later 1.3.0 2021-08-18 [1] CRAN (R 4.1.0)
lattice 0.20-45 2021-09-22 [2] CRAN (R 4.1.2)
lifecycle 1.0.1 2021-09-24 [1] CRAN (R 4.1.0)
magrittr 2.0.3 2022-03-30 [1] CRAN (R 4.1.0)
Matrix 1.3-4 2021-06-01 [2] CRAN (R 4.1.2)
memoise 2.0.1 2021-11-26 [1] CRAN (R 4.1.0)
mgcv 1.8-38 2021-10-06 [2] CRAN (R 4.1.2)
munsell 0.5.0 2018-06-12 [2] CRAN (R 4.1.2)
nlme 3.1-153 2021-09-07 [2] CRAN (R 4.1.2)
patchwork * 1.1.1 2020-12-17 [2] CRAN (R 4.1.2)
pillar 1.7.0 2022-02-01 [1] CRAN (R 4.1.0)
pkgbuild 1.2.0 2020-12-15 [2] CRAN (R 4.1.2)
pkgconfig 2.0.3 2019-09-22 [2] CRAN (R 4.1.2)
pkgload 1.2.3 2021-10-13 [2] CRAN (R 4.1.2)
prettyunits 1.1.1 2020-01-24 [2] CRAN (R 4.1.2)
processx 3.5.2 2021-04-30 [2] CRAN (R 4.1.2)
promises 1.2.0.1 2021-02-11 [2] CRAN (R 4.1.2)
ps 1.7.1 2022-06-18 [1] CRAN (R 4.1.0)
purrr * 0.3.4 2020-04-17 [2] CRAN (R 4.1.2)
R6 2.5.1 2021-08-19 [1] CRAN (R 4.1.0)
RColorBrewer 1.1-3 2022-04-03 [1] CRAN (R 4.1.0)
Rcpp 1.0.8.3 2022-03-17 [1] CRAN (R 4.1.0)
remotes 2.4.2 2021-11-30 [1] CRAN (R 4.1.0)
rlang 1.0.3 2022-06-27 [1] CRAN (R 4.1.0)
rmarkdown 2.14 2022-04-25 [1] CRAN (R 4.1.0)
rprojroot 2.0.3 2022-04-02 [1] CRAN (R 4.1.0)
rstudioapi 0.14 2022-08-22 [1] CRAN (R 4.1.0)
sass 0.4.1 2022-03-23 [1] CRAN (R 4.1.0)
scales 1.2.1 2022-08-20 [1] CRAN (R 4.1.0)
sessioninfo 1.2.0 2021-10-31 [2] CRAN (R 4.1.2)
stringi 1.7.6 2021-11-29 [1] CRAN (R 4.1.0)
stringr * 1.4.0 2019-02-10 [2] CRAN (R 4.1.2)
testthat 3.1.0 2021-10-04 [2] CRAN (R 4.1.2)
tibble * 3.1.7 2022-05-03 [1] CRAN (R 4.1.0)
tidyr * 1.2.0 2022-02-01 [1] CRAN (R 4.1.0)
tidyselect 1.1.2 2022-02-21 [1] CRAN (R 4.1.0)
usethis 2.1.3 2021-10-27 [2] CRAN (R 4.1.2)
utf8 1.2.3 2023-01-31 [1] CRAN (R 4.1.0)
vctrs 0.4.1 2022-04-13 [1] CRAN (R 4.1.0)
whisker 0.4 2019-08-28 [2] CRAN (R 4.1.2)
withr 2.5.0 2022-03-03 [1] CRAN (R 4.1.0)
workflowr 1.7.0 2021-12-21 [1] CRAN (R 4.1.0)
xfun 0.31 2022-05-10 [1] CRAN (R 4.1.0)
yaml 2.3.5 2022-02-21 [1] CRAN (R 4.1.0)
[1] /home/jpullin/R/x86_64-pc-linux-gnu-library/4.1
[2] /apps/easybuild-2022/easybuild/software/MPI/GCC/11.3.0/OpenMPI/4.1.4/R/4.1.2/lib64/R/library
──────────────────────────────────────────────────────────────────────────────