TPR
Last updated: 2024-01-01
Checks: 7 0
Knit directory:
mage_2020_marker-gene-benchmarking/
This reproducible R Markdown analysis was created with workflowr (version 1.7.0). The Checks tab describes the reproducibility checks that were applied when the results were created. The Past versions tab lists the development history.
Great! Since the R Markdown file has been committed to the Git repository, you know the exact version of the code that produced these results.
Great job! The global environment was empty. Objects defined in the global environment can affect the analysis in your R Markdown file in unknown ways. For reproduciblity it’s best to always run the code in an empty environment.
The command set.seed(20190102) was run prior to running
the code in the R Markdown file. Setting a seed ensures that any results
that rely on randomness, e.g. subsampling or permutations, are
reproducible.
Great job! Recording the operating system, R version, and package versions is critical for reproducibility.
Nice! There were no cached chunks for this analysis, so you can be confident that you successfully produced the results during this run.
Great job! Using relative paths to the files within your workflowr project makes it easier to run your code on other machines.
Great! You are using Git for version control. Tracking code development and connecting the code version to the results is critical for reproducibility.
The results in this page were generated with repository version 2632193. See the Past versions tab to see a history of the changes made to the R Markdown and HTML files.
Note that you need to be careful to ensure that all relevant files for
the analysis have been committed to Git prior to generating the results
(you can use wflow_publish or
wflow_git_commit). workflowr only checks the R Markdown
file, but you know if there are other scripts or data files that it
depends on. Below is the status of the Git repository when the results
were generated:
Ignored files:
    Ignored:    .Renviron
    Ignored:    .Rhistory
    Ignored:    .Rproj.user/
    Ignored:    .snakemake/
    Ignored:    NSForest/.Rhistory
    Ignored:    NSForest/NS-Forest_v3_Extended_Binary_Markers_Supplmental.csv
    Ignored:    NSForest/NS-Forest_v3_Full_Results.csv
    Ignored:    NSForest/NSForest3_medianValues.csv
    Ignored:    NSForest/NSForest_v3_Final_Result.csv
    Ignored:    NSForest/__pycache__/
    Ignored:    NSForest/data/
    Ignored:    RankCorr/picturedRocks/__pycache__/
    Ignored:    benchmarks/
    Ignored:    config/
    Ignored:    data/cellmarker/
    Ignored:    data/downloaded_data/
    Ignored:    data/expert_annotations/
    Ignored:    data/expert_mgs/
    Ignored:    data/raw_data/
    Ignored:    data/real_data/
    Ignored:    data/sim_data/
    Ignored:    data/sim_mgs/
    Ignored:    data/special_real_data/
    Ignored:    figures/
    Ignored:    logs/
    Ignored:    results/
    Ignored:    weights/

Unstaged changes:
    Deleted:    analysis/expert-mgs-direction.Rmd
    Modified:   smash-fork
Note that any generated files, e.g. HTML, png, CSS, etc., are not included in this status report because it is ok for generated content to have uncommitted changes.
These are the previous versions of the repository in which changes were
made to the R Markdown (analysis/tpr.Rmd) and HTML
(public/tpr.html) files. If you’ve configured a remote Git
repository (see ?wflow_git_remote), click on the hyperlinks
in the table below to view the files as they were in that past version.
| File | Version | Author | Date | Message |
|---|---|---|---|---|
| Rmd | 9487c1e | Jeffrey Pullin | 2023-06-17 | Add draft of dataset characteristic section analysis |
| Rmd | d3539cb | Jeffrey Pullin | 2023-06-10 | Add ‘blood’ datasets |
| html | fcecf65 | Jeffrey Pullin | 2022-09-09 | Build site. |
| Rmd | 0c2eafc | Jeffrey Pullin | 2022-09-09 | Update website |
| html | af96b34 | Jeffrey Pullin | 2022-08-30 | Build site. |
| html | 2b49665 | Jeffrey Pullin | 2022-08-29 | Build site. |
| html | 97c1be8 | Jeffrey Pullin | 2022-05-04 | Build site. |
| Rmd | 87f0b60 | Jeffrey Pullin | 2022-05-04 | Tweak simulation analysis |
| html | b5045c1 | Jeffrey Pullin | 2022-05-02 | Build site. |
| Rmd | 048156f | Jeffrey Pullin | 2022-05-02 | Tweak analysis outputs |
| html | 048156f | Jeffrey Pullin | 2022-05-02 | Tweak analysis outputs |
| html | 8b989e1 | Jeffrey Pullin | 2022-05-02 | Build site. |
| html | 0548273 | Jeffrey Pullin | 2022-05-02 | Build site. |
| Rmd | 50bca7c | Jeffrey Pullin | 2022-05-02 | workflowr::wflow_publish(all = TRUE, republish = TRUE) |
| html | 50bca7c | Jeffrey Pullin | 2022-05-02 | workflowr::wflow_publish(all = TRUE, republish = TRUE) |
| html | 5cc008f | Jeffrey Pullin | 2022-02-09 | Build site. |
| Rmd | d1aca16 | Jeffrey Pullin | 2022-02-09 | Refresh website |
| html | d1aca16 | Jeffrey Pullin | 2022-02-09 | Refresh website |
| Rmd | 262f46d | Jeffrey Pullin | 2022-02-08 | Update simulation-based TPR analysis |
| Rmd | aca9ad2 | Jeffrey Pullin | 2021-11-29 | Various changes made in the last days before thesis submission |
| Rmd | 98c856a | Jeffrey Pullin | 2021-09-28 | Update analyses |
| Rmd | e3d9f9e | Jeffrey Pullin | 2021-09-22 | Polish tpr analysis |
| Rmd | 27e8a89 | Jeffrey Pullin | 2021-09-21 | Extend tpr analysis |
| Rmd | 17f2a0f | Jeffrey Pullin | 2021-08-07 | Add new plots and analysis for lab meeting 5/8/2021 |
| Rmd | 33c015d | Jeffrey Pullin | 2021-08-04 | Fix off by error in rankcorr and run higher lambda values |
| Rmd | 3fa1beb | Jeffrey Pullin | 2021-08-04 | Update analysis code to new marker gene format |
| Rmd | 92d3bf0 | Jeffrey Pullin | 2021-08-02 | Add code to create plots for ECSSC talk |
| Rmd | 15c9978 | Jeffrey Pullin | 2021-07-25 | Update analysis for new simulations |
| Rmd | e4bd7a9 | Jeffrey Pullin | 2021-07-22 | Misc WIP changes to simulations and code |
| Rmd | 74443b4 | Jeffrey Pullin | 2021-07-13 | Update endothelial data processing and simulation outputs |
| Rmd | acc6dd9 | Jeffrey Pullin | 2021-05-31 | Large update |
| html | 61ee246 | Jeffrey Pullin | 2021-04-13 | Build site. |
| Rmd | b5b2a88 | Jeffrey Pullin | 2021-04-13 | Add new results |
| Rmd | 07b49fa | Jeffrey Pullin | 2021-04-08 | Finish rewriting TPR plots to use new framework |
| Rmd | cd9837a | Jeffrey Pullin | 2021-04-08 | Refactor how marker genes are extracted from methods |
| Rmd | be29ac9 | Jeffrey Pullin | 2021-04-06 | Rename tpr-fdr to tpr only |
library(tibble)
library(dplyr)
library(ggplot2)
library(tidyr)
library(SingleCellExperiment)
library(scater)
library(forcats)
library(purrr)
library(patchwork)

source(here::here("code", "top-genes.R"))
source(here::here("code", "analysis-utils.R"))
source(here::here("code", "plot-utils.R"))
Aim
To investigate the TPR performance of the different methods on simulated datasets.
metrics_data <- retrive_simulation_parameters() %>%
  filter(sim_label == "standard") %>%
  rowwise() %>%
  mutate(
    mgs_raw = list(readRDS(full_filename)$result),
    mgs = list(split(mgs_raw, mgs_raw$cluster))
  ) %>%
  ungroup() %>%
  unnest_longer(
    col = mgs,
    values_to = "mgs",
    indices_to = "cluster"
  ) %>%
  select(-mgs_raw) %>%
  mutate(umg_path = here::here(
    "data", "sim_mgs", paste0("mg-", sim_name, "-", data_id, ".rds"))
  ) %>%
  rowwise() %>%
  mutate(true_mgs = list(readRDS(umg_path))) %>%
  mutate(cluster_2 = paste0("group_", substr(cluster, 6, 6))) %>%
  mutate(true_mgs = list(true_mgs[[cluster_2]])) %>%
  dplyr::rename(sel_mgs = mgs) %>%
  ungroup()
plot_metric <- function(data,
data_id,
n_true = 20,
n_sel = 20,
direction = "up",
metric = "recall") {
plot_dataset <- dataset_lookup[data_id]
plot_data <- data %>%
filter(data_id == !!data_id) %>%
filter(sim_label == "standard") %>%
expand_grid(n_true = n_true, n_sel = n_sel) %>%
rowwise() %>%
dplyr::filter(!is.null(sel_mgs)) %>%
mutate(
true_mgs = list(get_top_true_mgs(
true_mgs,
n = n_true,
direction = direction,
sort_by_score = "mean_score")
),
sel_mgs = list(get_top_sel_mgs(
sel_mgs,
n = n_sel,
direction = direction)
),
recall = calculate_recall(sel_mgs$gene, true_mgs$gene),
precision = calculate_precision(sel_mgs$gene, true_mgs$gene),
raw_f1_score = (2 * recall * precision) / (recall + precision)
) %>%
mutate(f1_score = if_else(is.nan(raw_f1_score), 0, raw_f1_score)) %>%
ungroup() %>%
mutate(plot_method = method_lookup[method]) %>%
mutate(plot_pars = pars_lookup[pars]) %>%
mutate(plot_pars = fct_reorder(
factor(plot_pars),
!!sym(metric),
.fun = median
)) %>%
select(plot_method, plot_pars, recall, precision, f1_score)
# We remove this so it doesn't get trapped in the ggplot object, hugely
# inflating its size.
rm(data)
ggplot(plot_data, aes(x = plot_pars, y = !!sym(metric), fill = plot_method)) +
geom_boxplot() +
coord_flip(ylim = c(0, 1)) +
scale_y_continuous(breaks = seq(0, 1, by = 0.2)) +
package_fill +
labs(
y = metric_lookup[metric],
x = "Method",
colour = "Package",
title = paste0(plot_dataset, " dataset based simulations"),
) +
theme_bw()
}
plot_metric_overall <- function(data,
n_true = 20,
n_sel = 20,
direction = "up",
metric = "recall") {
plot_metric <- metric_lookup[metric]
plot_data <- data %>%
mutate(n_true = n_true, n_sel = n_sel, direction = direction) %>%
rowwise() %>%
dplyr::filter(!is.null(sel_mgs)) %>%
mutate(
true_mgs = list(get_top_true_mgs(
true_mgs,
n = n_true,
direction = direction,
sort_by_score = "mean_score")
),
sel_mgs = list(get_top_sel_mgs(
sel_mgs,
n = n_sel,
direction = direction)
),
recall = calculate_recall(sel_mgs$gene, true_mgs$gene),
precision = calculate_precision(sel_mgs$gene, true_mgs$gene),
f1_score = (2 * recall * precision) / (recall + precision)
) %>%
mutate(f1_score = if_else(recall == 0 & precision == 0, 0, f1_score)) %>%
ungroup() %>%
group_by(pars, data_id, method) %>%
summarise(!!sym(metric) := median(!!sym(metric)), .groups = "drop") %>%
mutate(
plot_method = method_lookup[method],
plot_pars = pars_lookup[pars],
plot_data_id = dataset_lookup[data_id]
) %>%
mutate(plot_pars = fct_reorder(factor(plot_pars), !!sym(metric)))
rm(data)
ggplot(plot_data, aes(x = plot_data_id, y = plot_pars)) +
geom_tile(aes(fill = !!sym(metric)), colour = "black") +
scale_fill_distiller(palette = "RdYlBu", limits = c(0, 1)) +
theme_bw() +
labs(
title = paste0(plot_metric, " across simulations"),
x = "Dataset",
y = "Method",
fill = plot_metric,
) +
theme(
panel.grid.major = element_blank(),
panel.grid.minor = element_blank(),
panel.border = element_blank(),
axis.ticks.y = element_blank(),
axis.text.x = element_text(angle = 45, vjust = 1, hjust = 1)
)
}Results
pbmc3k data
plot_metric(metrics_data, "pbmc3k", n_true = 5, n_sel = 5, metric = "recall")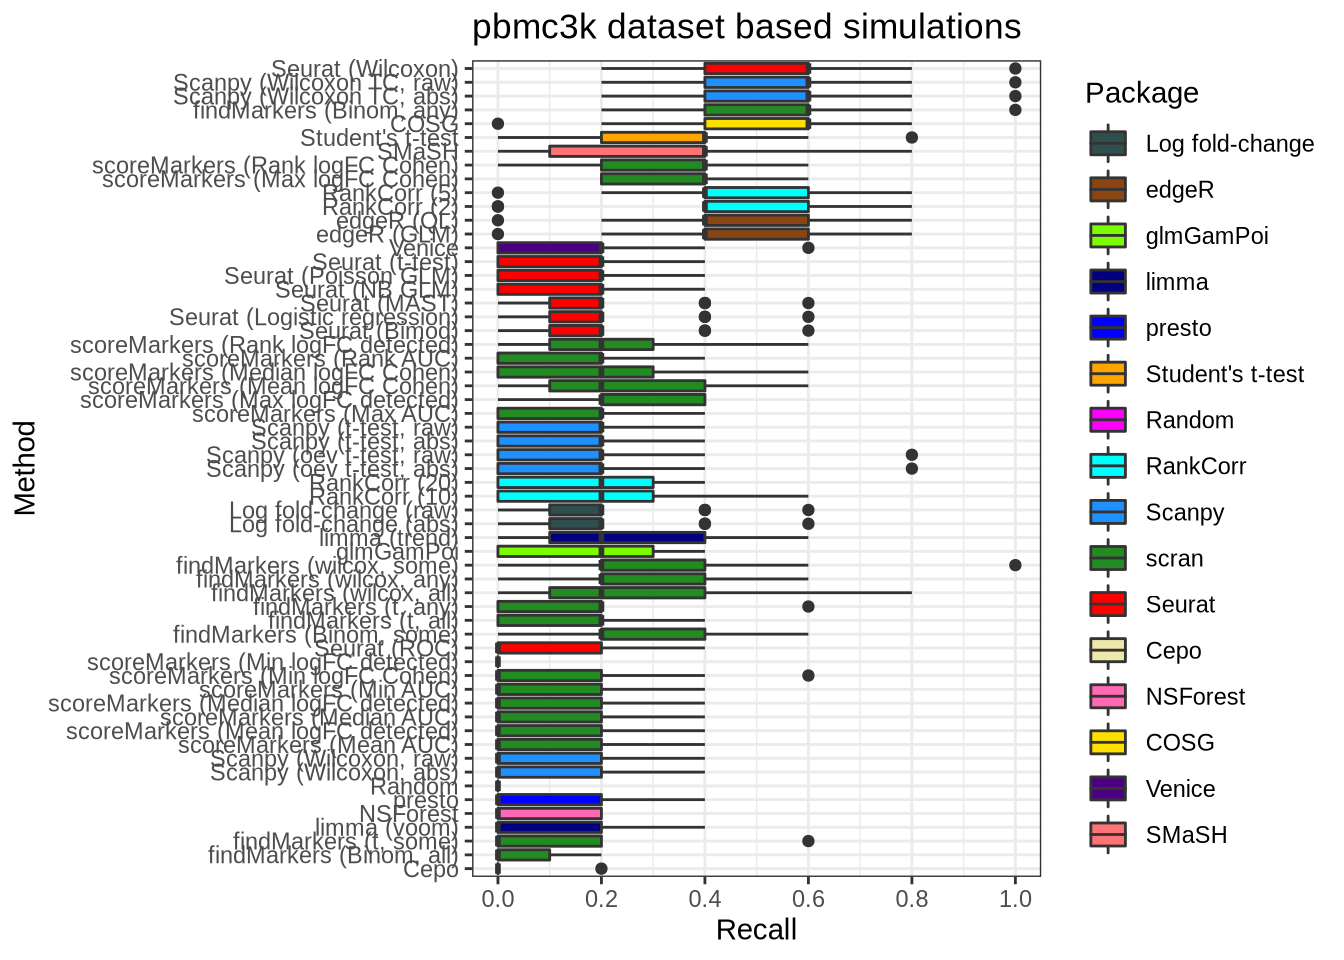
plot_metric(metrics_data, "pbmc3k", n_true = 5, n_sel = 5, metric = "precision")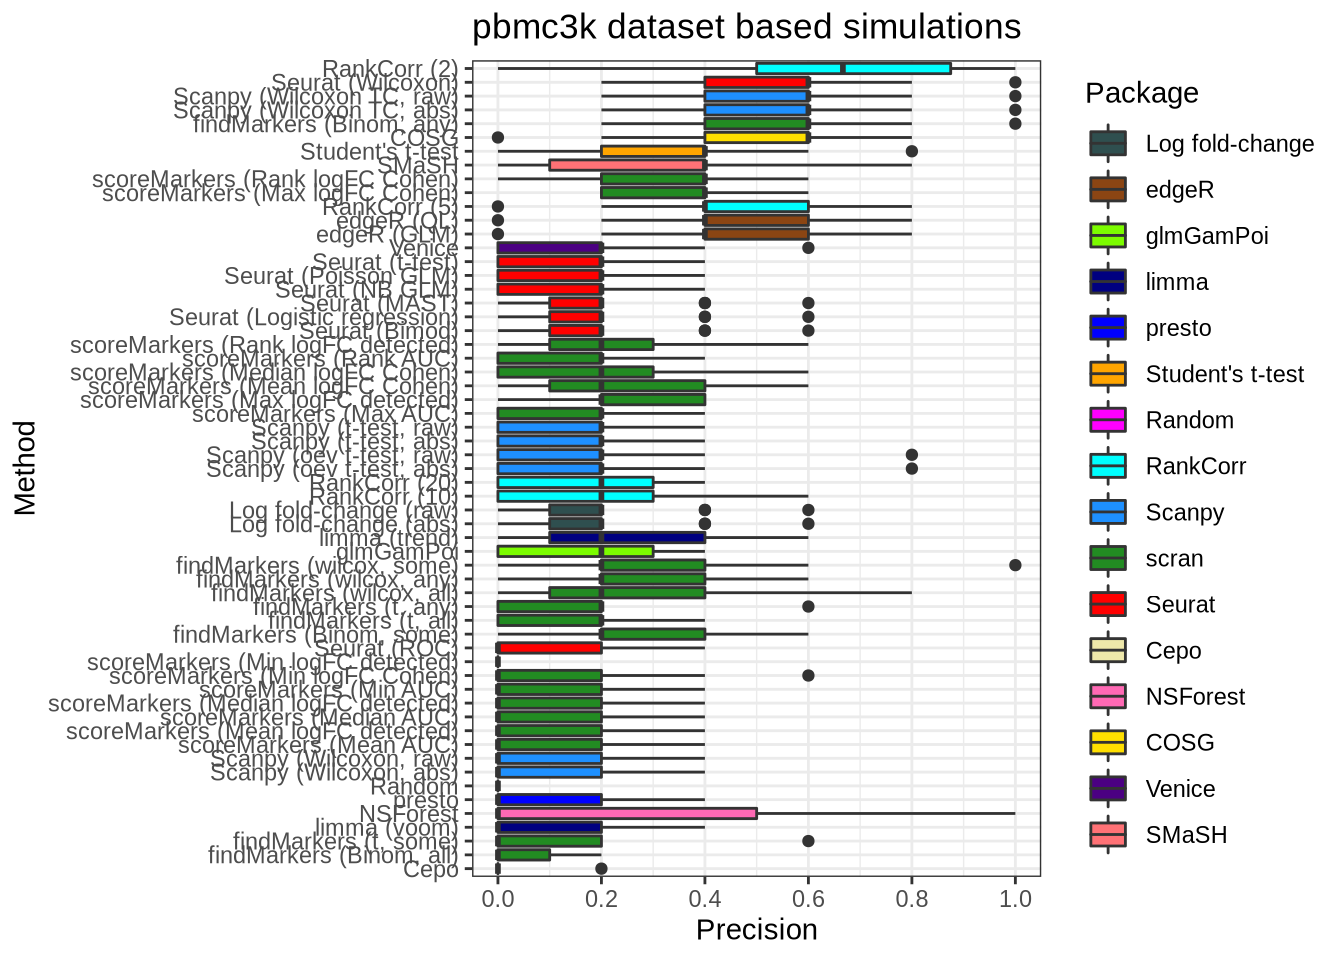
plot_metric(metrics_data, "pbmc3k", n_true = 20, n_sel = 20, metric = "recall")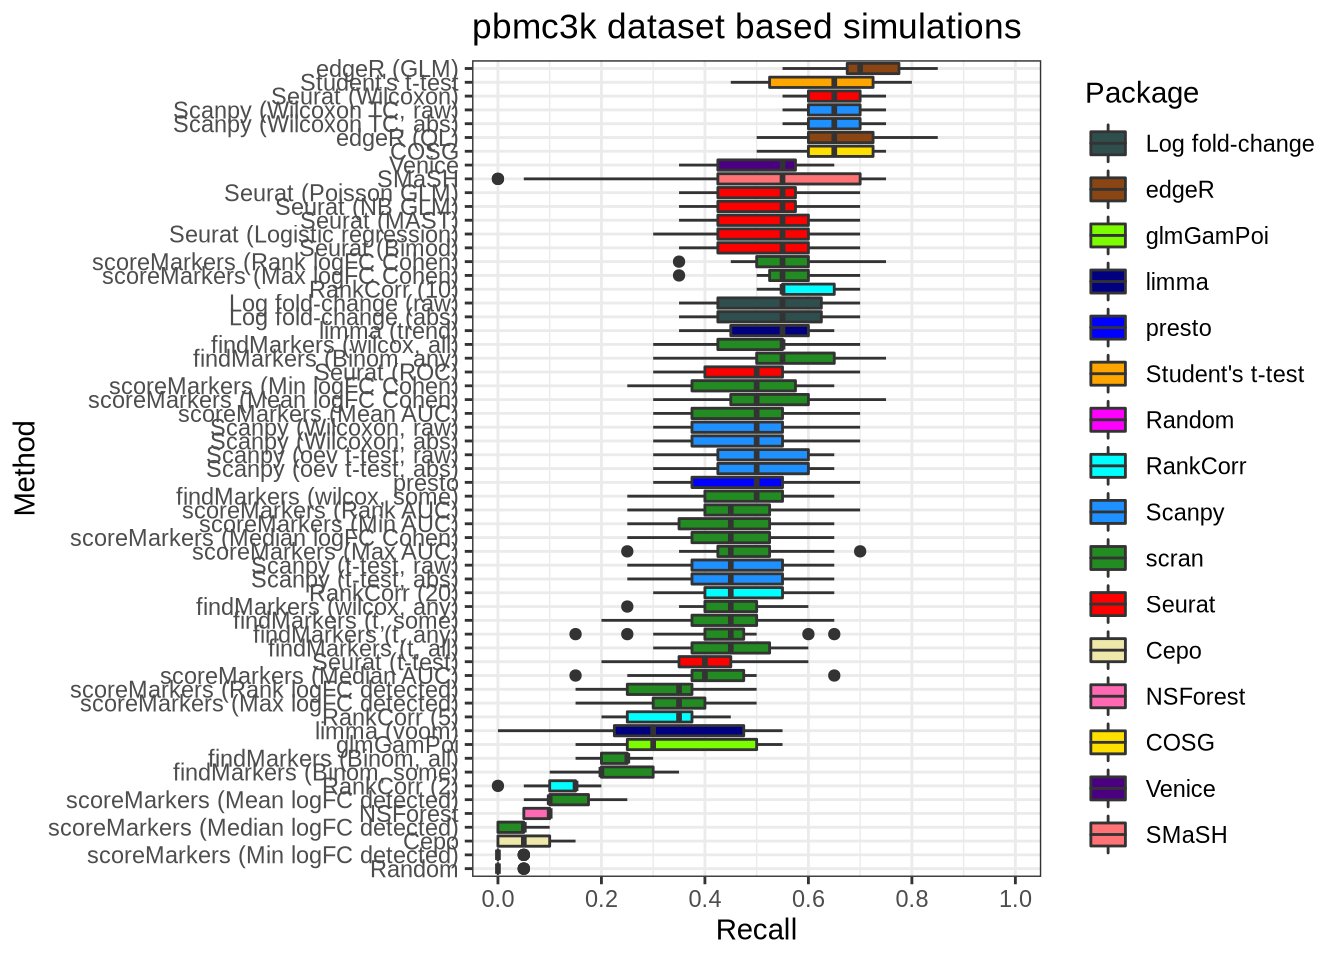
plot_metric(metrics_data, "pbmc3k", n_true = 20, n_sel = 20, metric = "precision")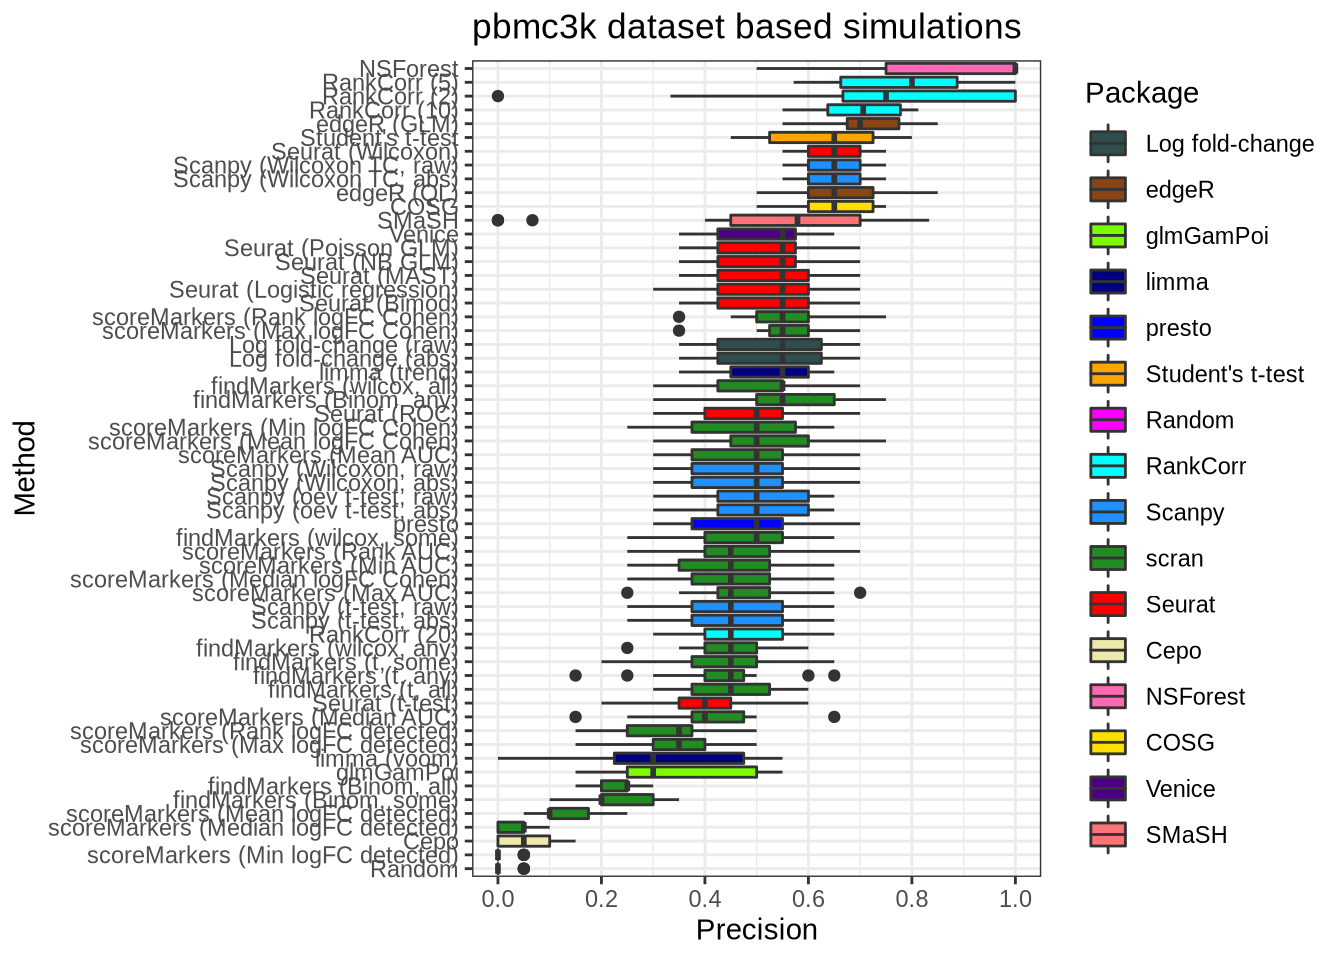
plot_metric(metrics_data, "pbmc3k", n_true = 40, n_sel = 40, metric = "recall")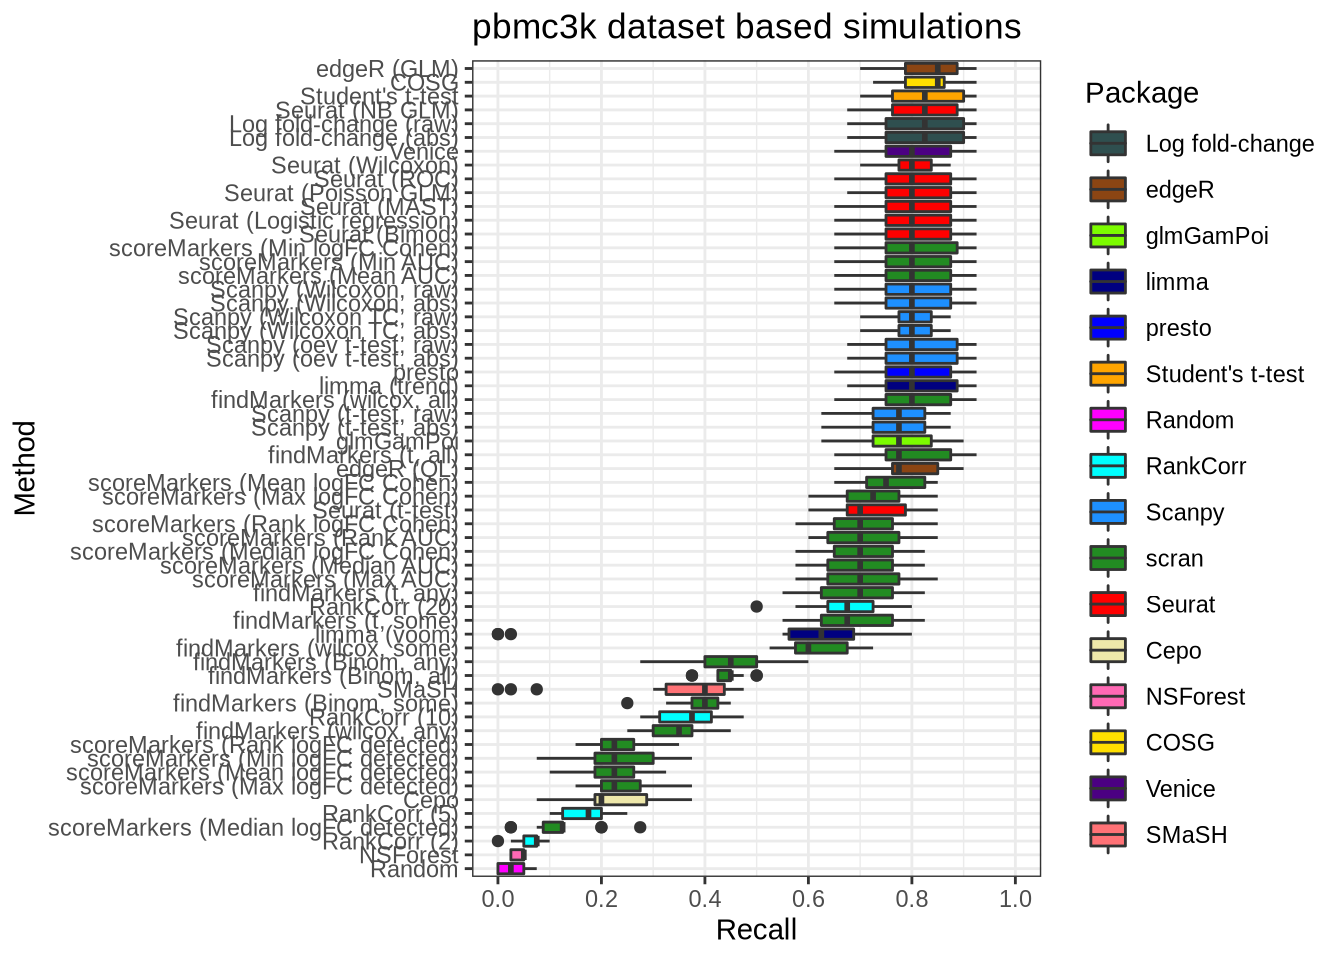
plot_metric(metrics_data, "pbmc3k", n_true = 40, n_sel = 40, metric = "precision")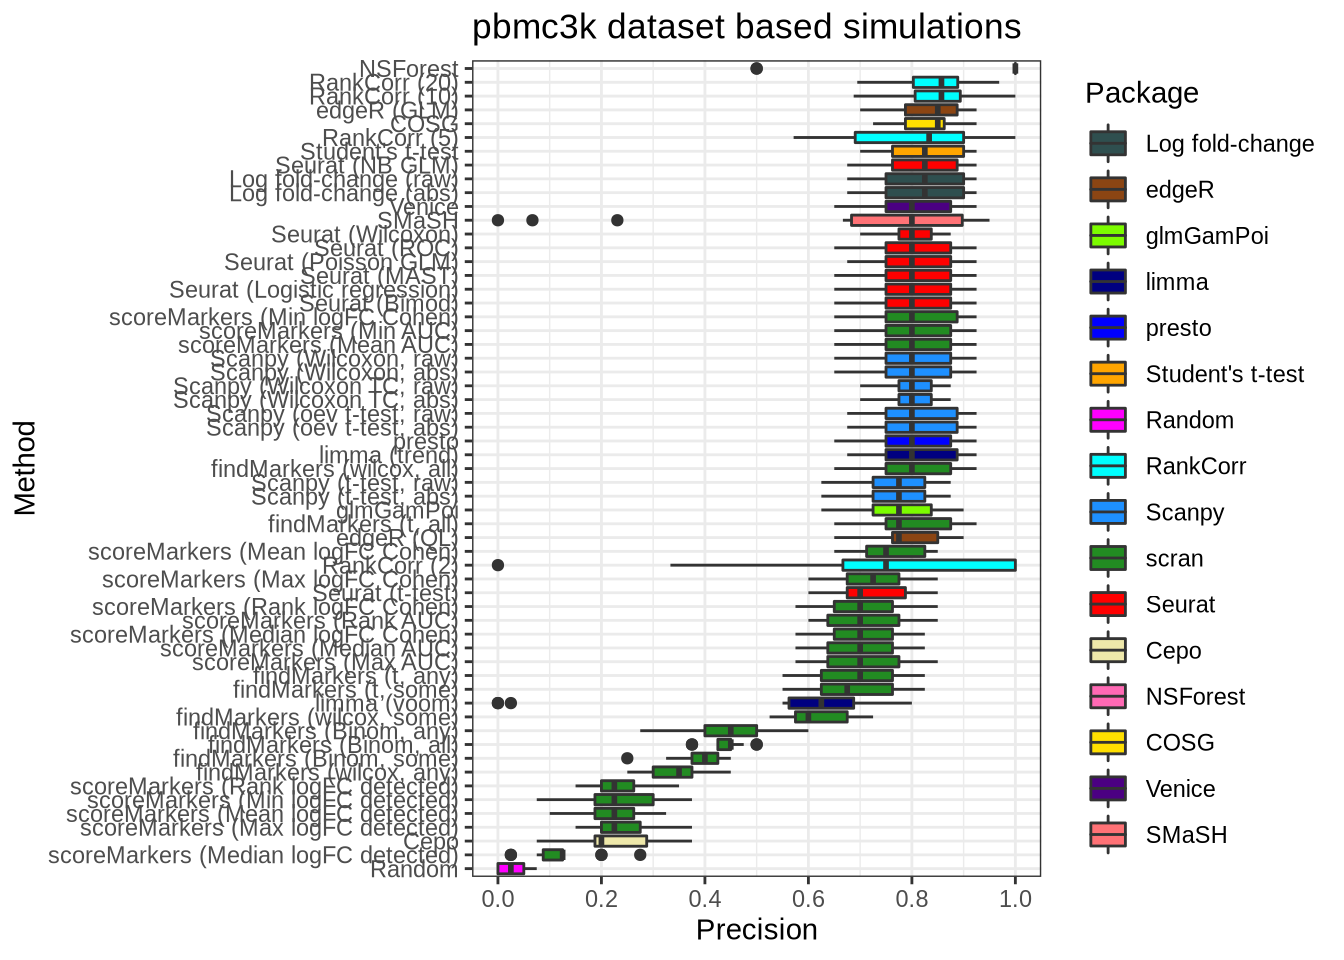
Lawlor data
plot_metric(metrics_data, "lawlor", n_true = 5, n_sel = 5, metric = "recall")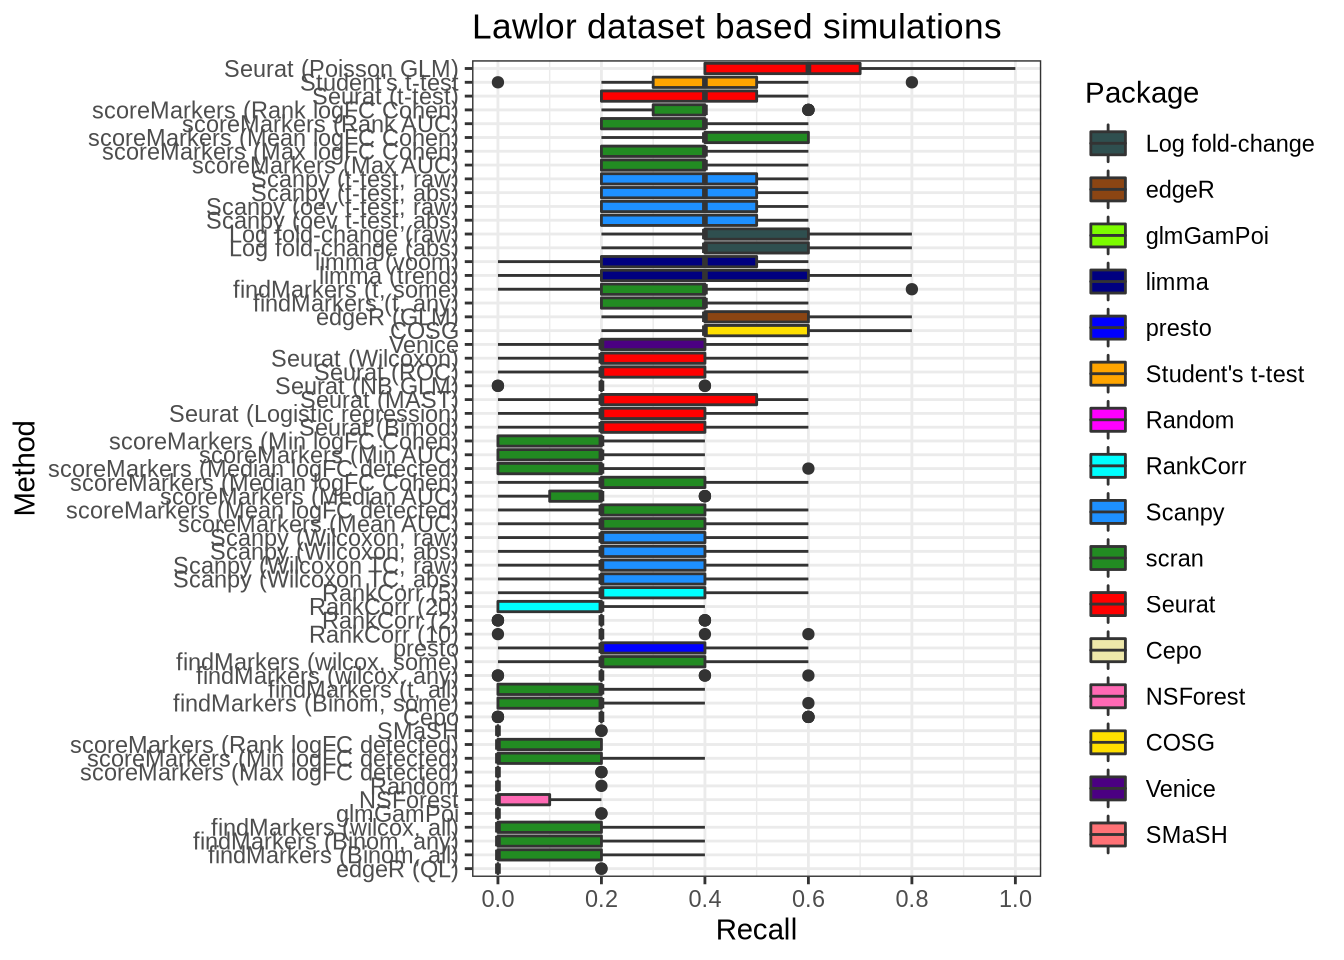
plot_metric(metrics_data, "lawlor", n_true = 5, n_sel = 5, metric = "precision")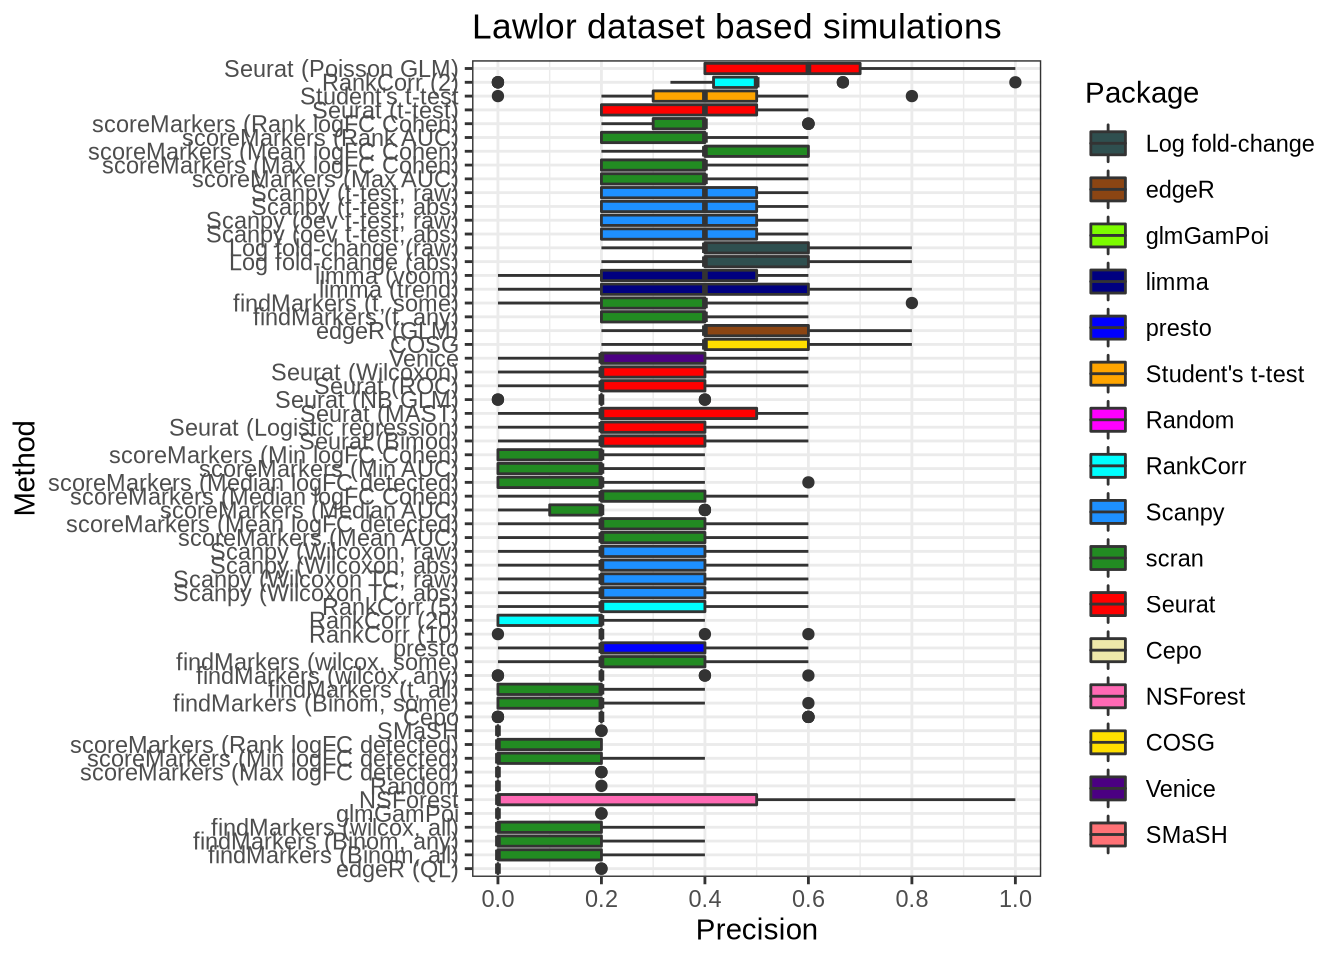
plot_metric(metrics_data, "lawlor", n_true = 20, n_sel = 20, metric = "recall")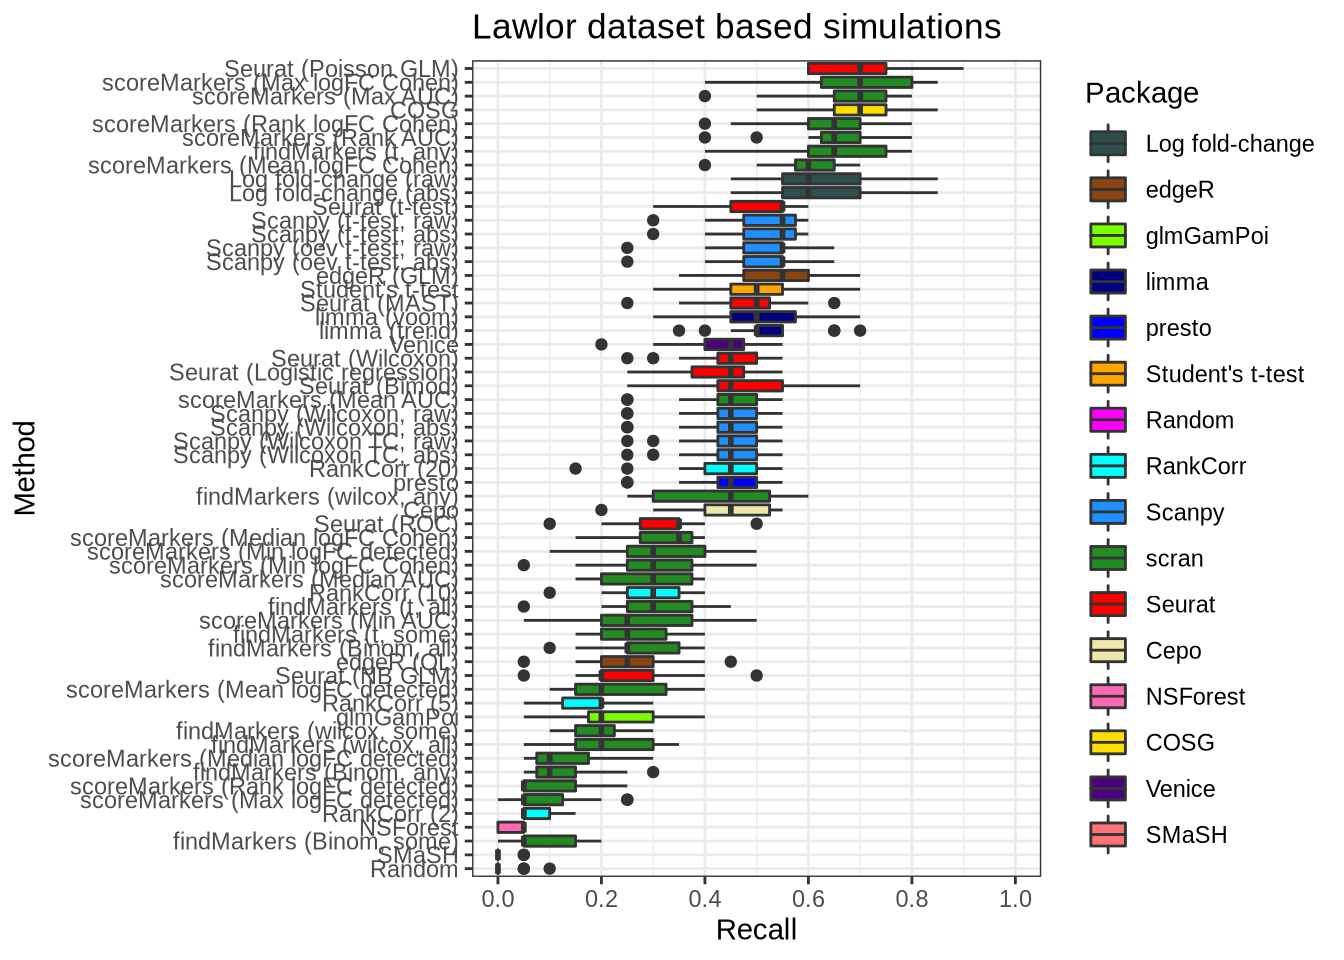
plot_metric(metrics_data, "lawlor", n_true = 20, n_sel = 20, metric = "precision")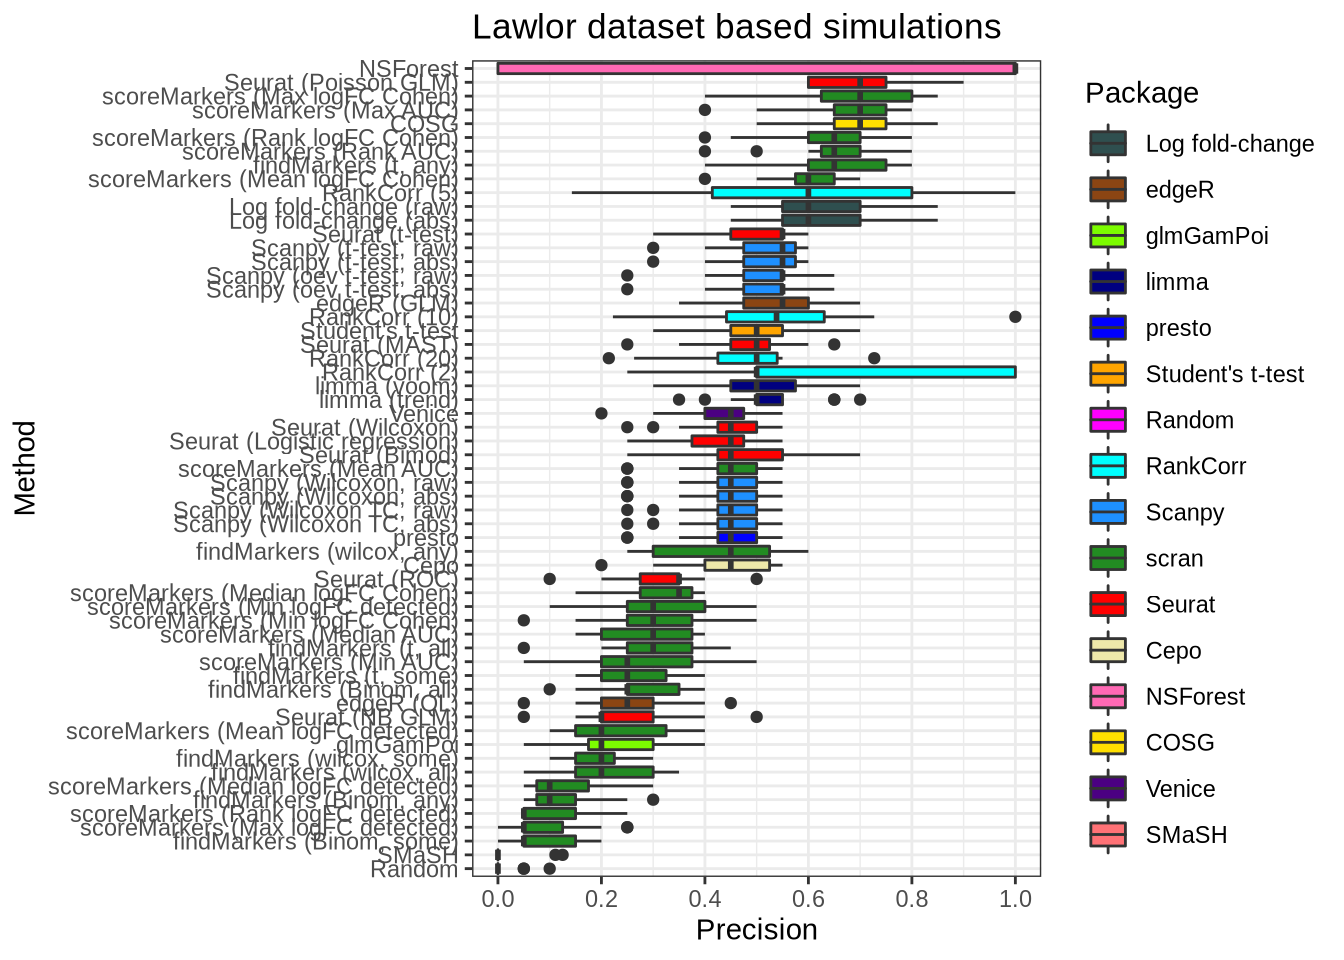
plot_metric(metrics_data, "lawlor", n_true = 40, n_sel = 40, metric = "recall")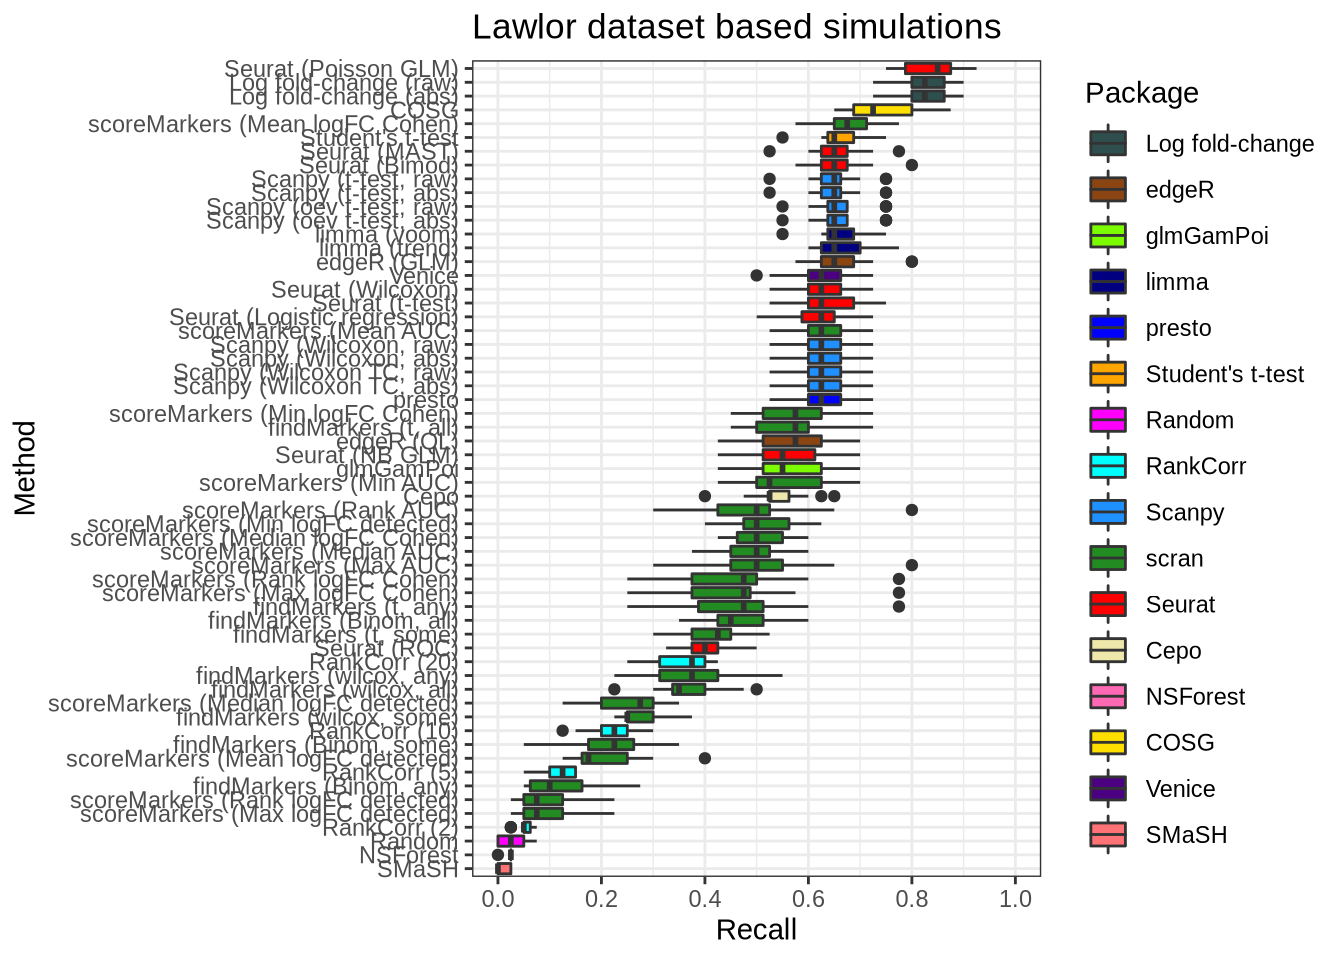
plot_metric(metrics_data, "lawlor", n_true = 40, n_sel = 40, metric = "precision")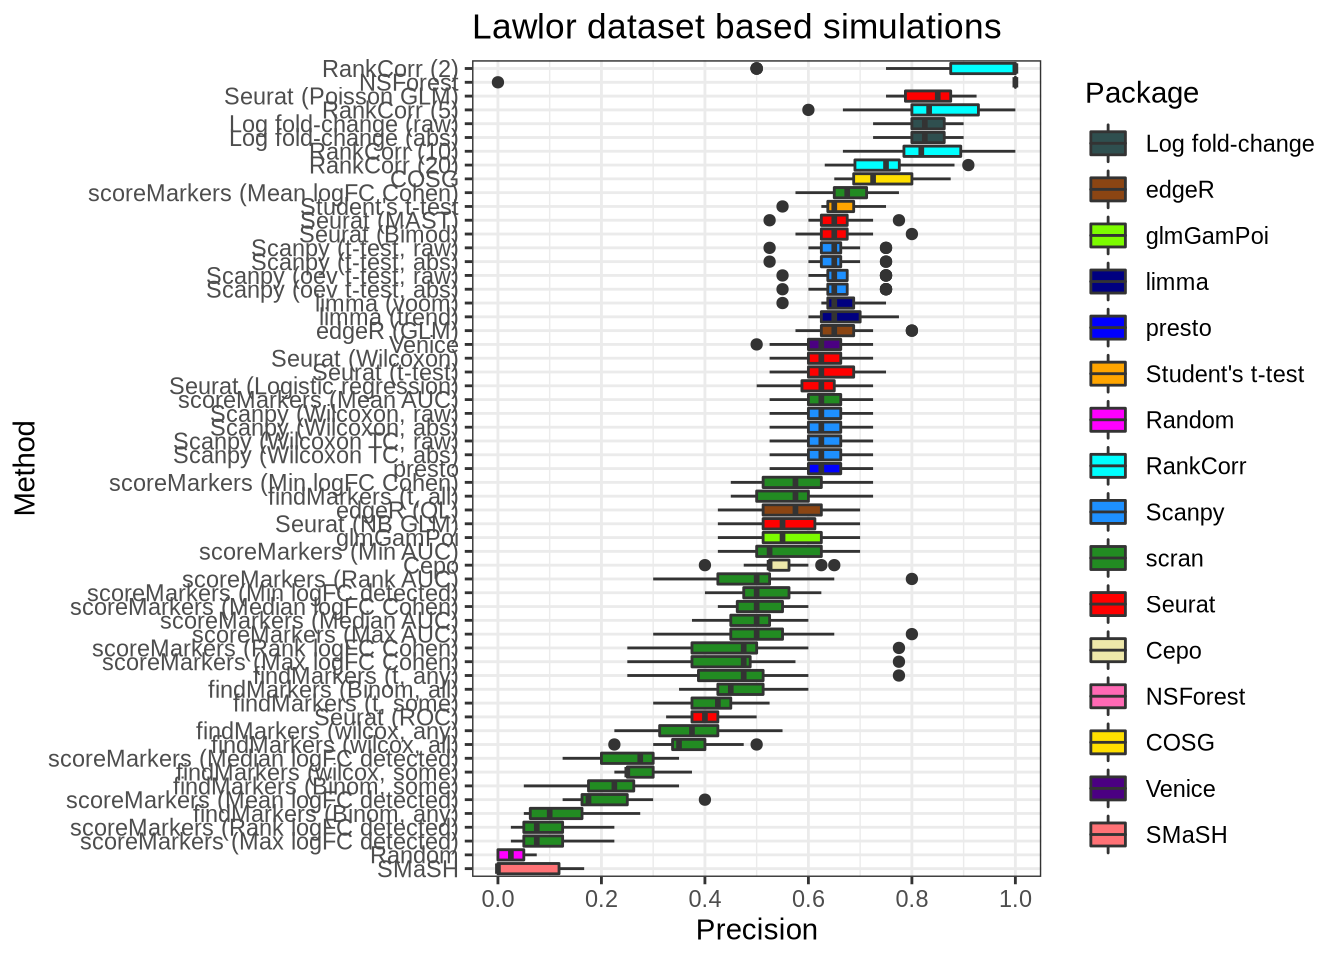
Zeisel data
plot_metric(metrics_data, "zeisel", n_true = 5, n_sel = 5, metric = "recall")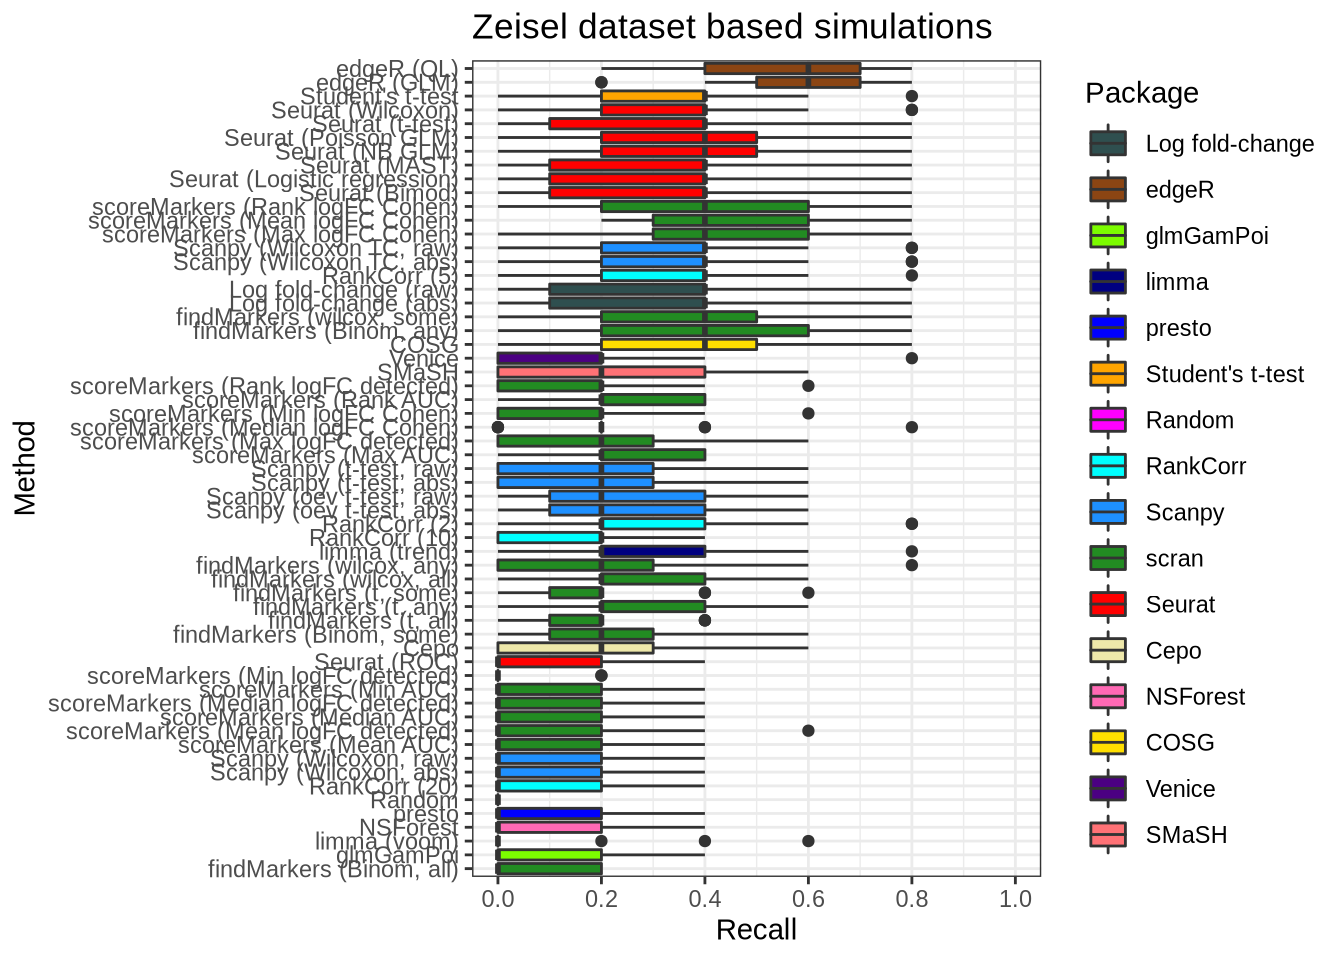
plot_metric(metrics_data, "zeisel", n_true = 5, n_sel = 5, metric = "precision")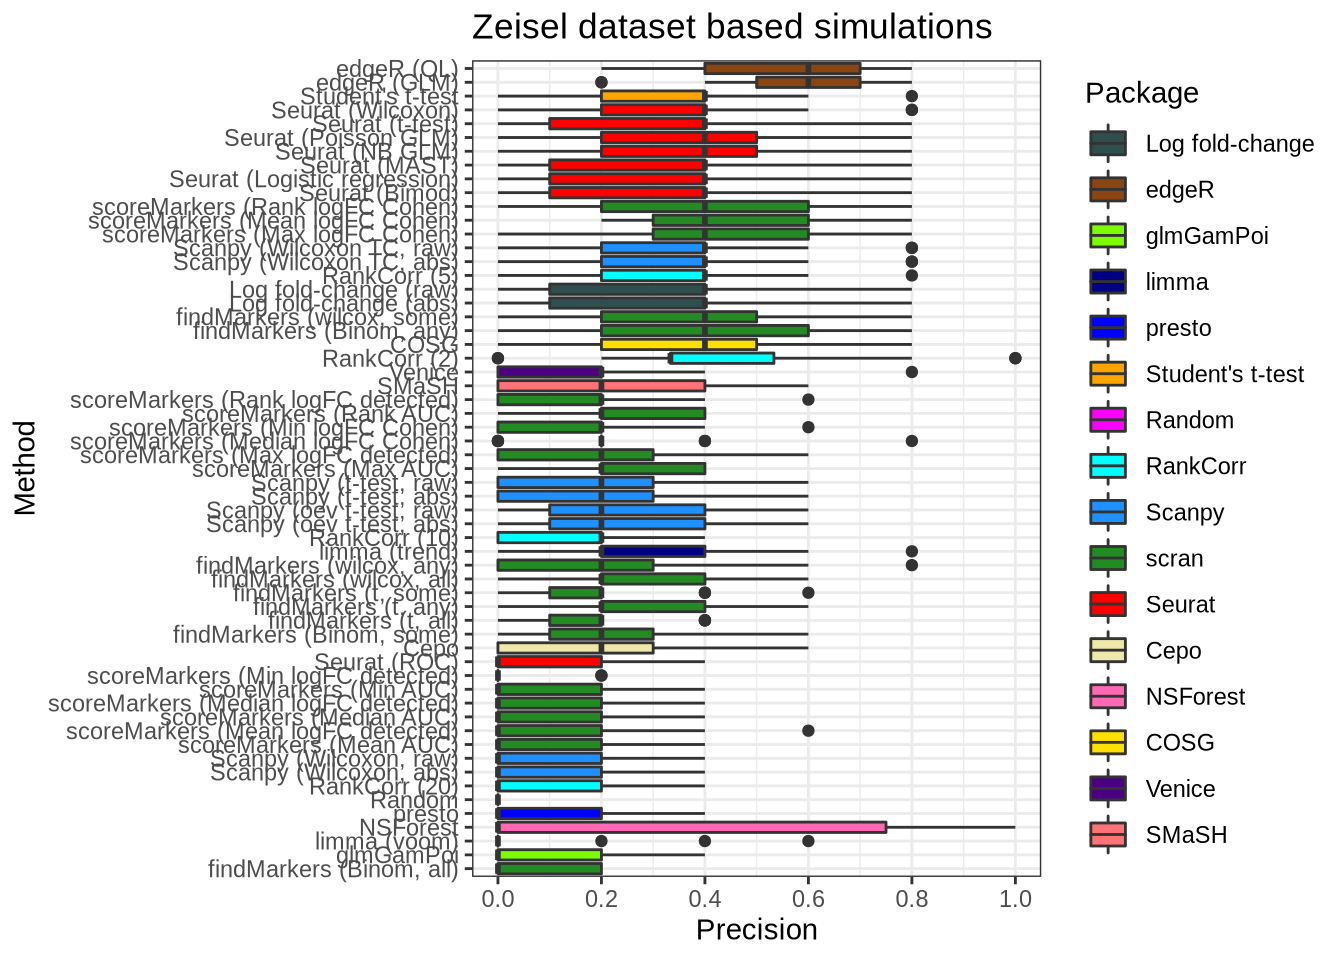
zeisel_recall <- plot_metric(metrics_data, "zeisel", n_true = 20, n_sel = 20,
                             metric = "recall") +
  ggtitle("Recall")
zeisel_precision <- plot_metric(metrics_data, "zeisel", n_true = 20, n_sel = 20,
                                metric = "precision") +
  ggtitle("Precision") +
  theme(axis.title.y = element_blank())
zeisel_f1_score <- plot_metric(metrics_data, "zeisel", n_true = 20, n_sel = 20,
                               metric = "f1_score") +
  ggtitle("F1 score") +
  theme(axis.title.y = element_blank())

zeisel_sim_all_metrics <- zeisel_recall + zeisel_precision + zeisel_f1_score +
  plot_layout(guides = "collect") +
  plot_annotation(tag_levels = "a") &
  theme(plot.tag = element_text(size = 18))

ggsave(
  here::here("figures", "final", "zeisel-sim-all-metrics.pdf"),
  zeisel_sim_all_metrics,
  width = 16,
  height = 8,
  units = "in"
)
Paul data
plot_metric(metrics_data, "paul", n_true = 5, n_sel = 5, metric = "recall")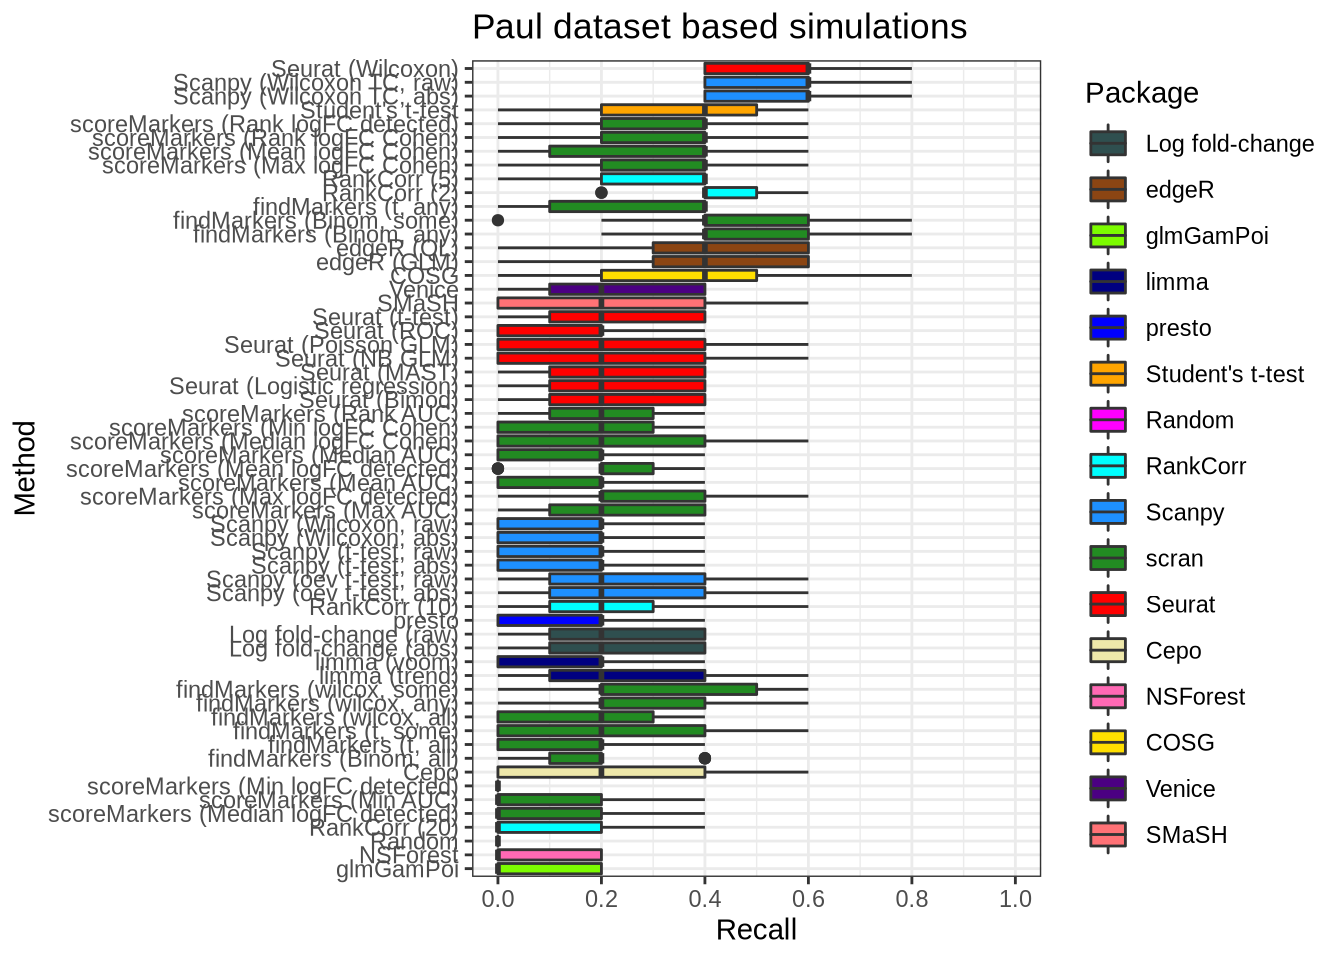
plot_metric(metrics_data, "paul", n_true = 20, n_sel = 20, metric = "recall")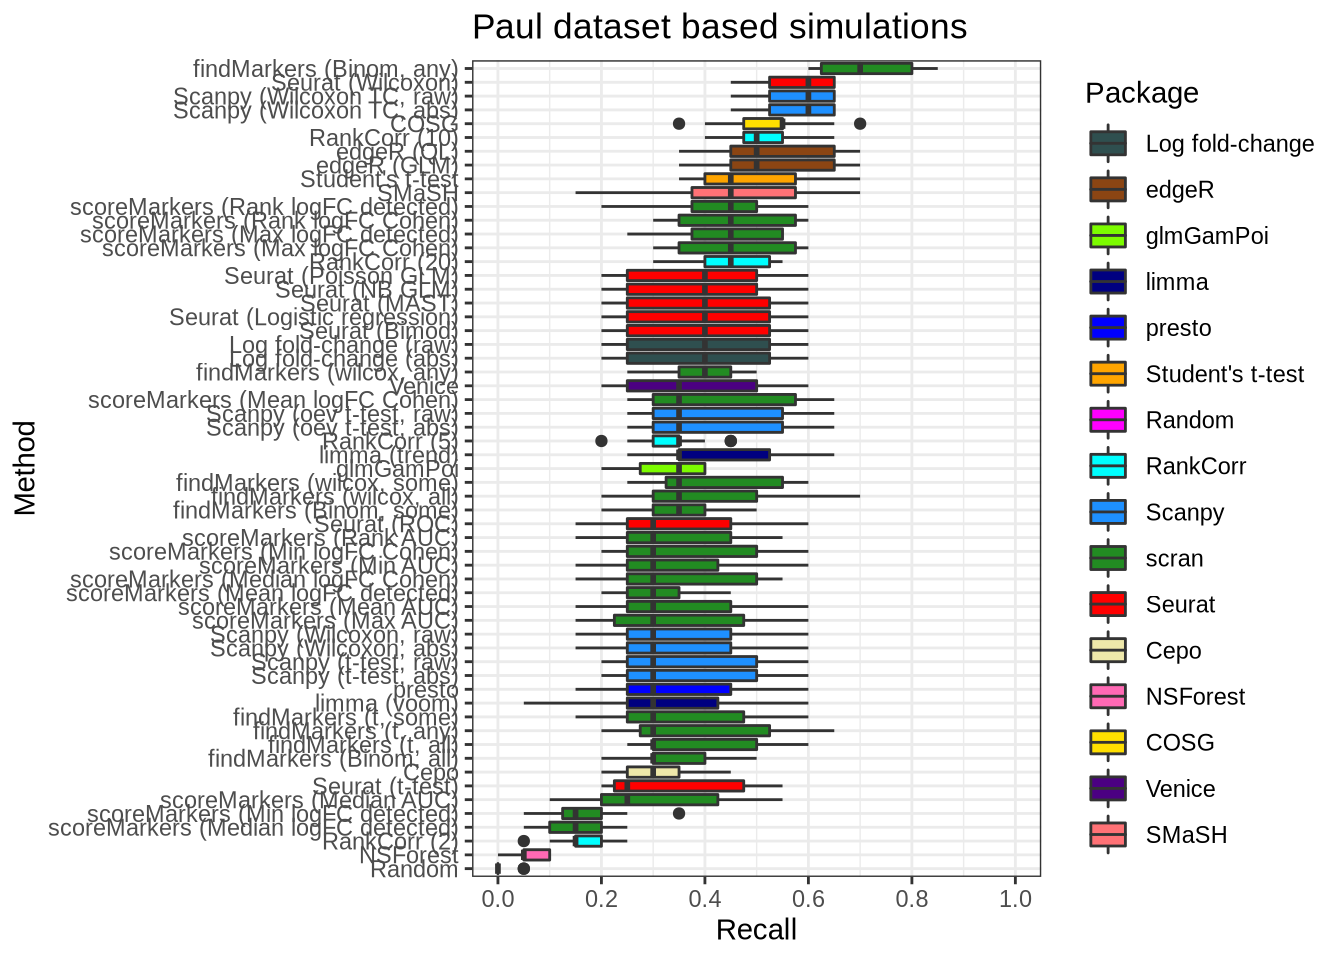
plot_metric(metrics_data, "paul", n_true = 40, n_sel = 40, metric = "recall")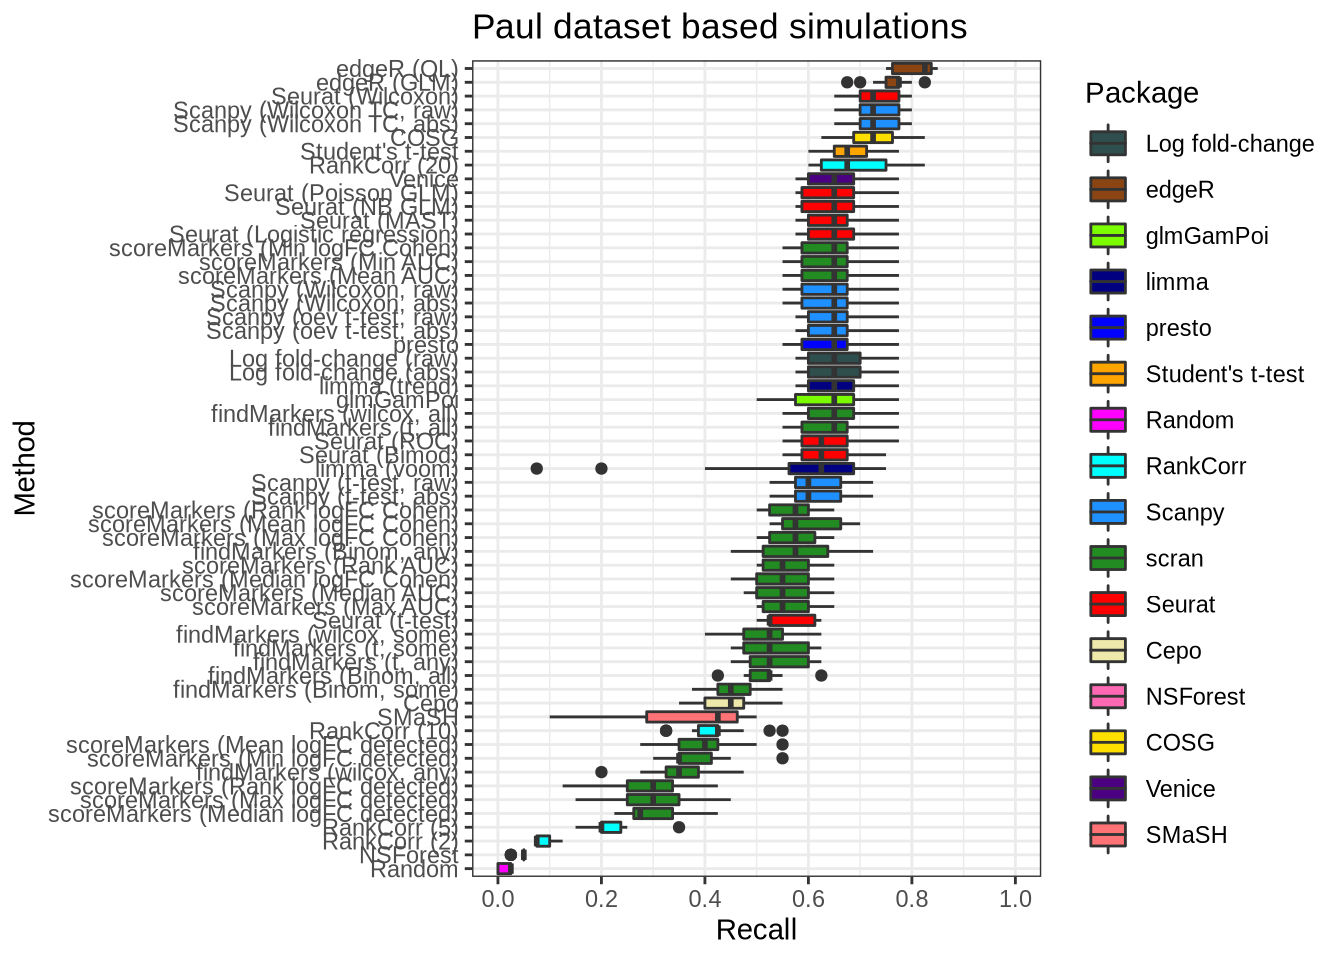
Endothelial data
plot_metric(metrics_data, "endothelial", n_true = 5, n_sel = 5, metric = "recall")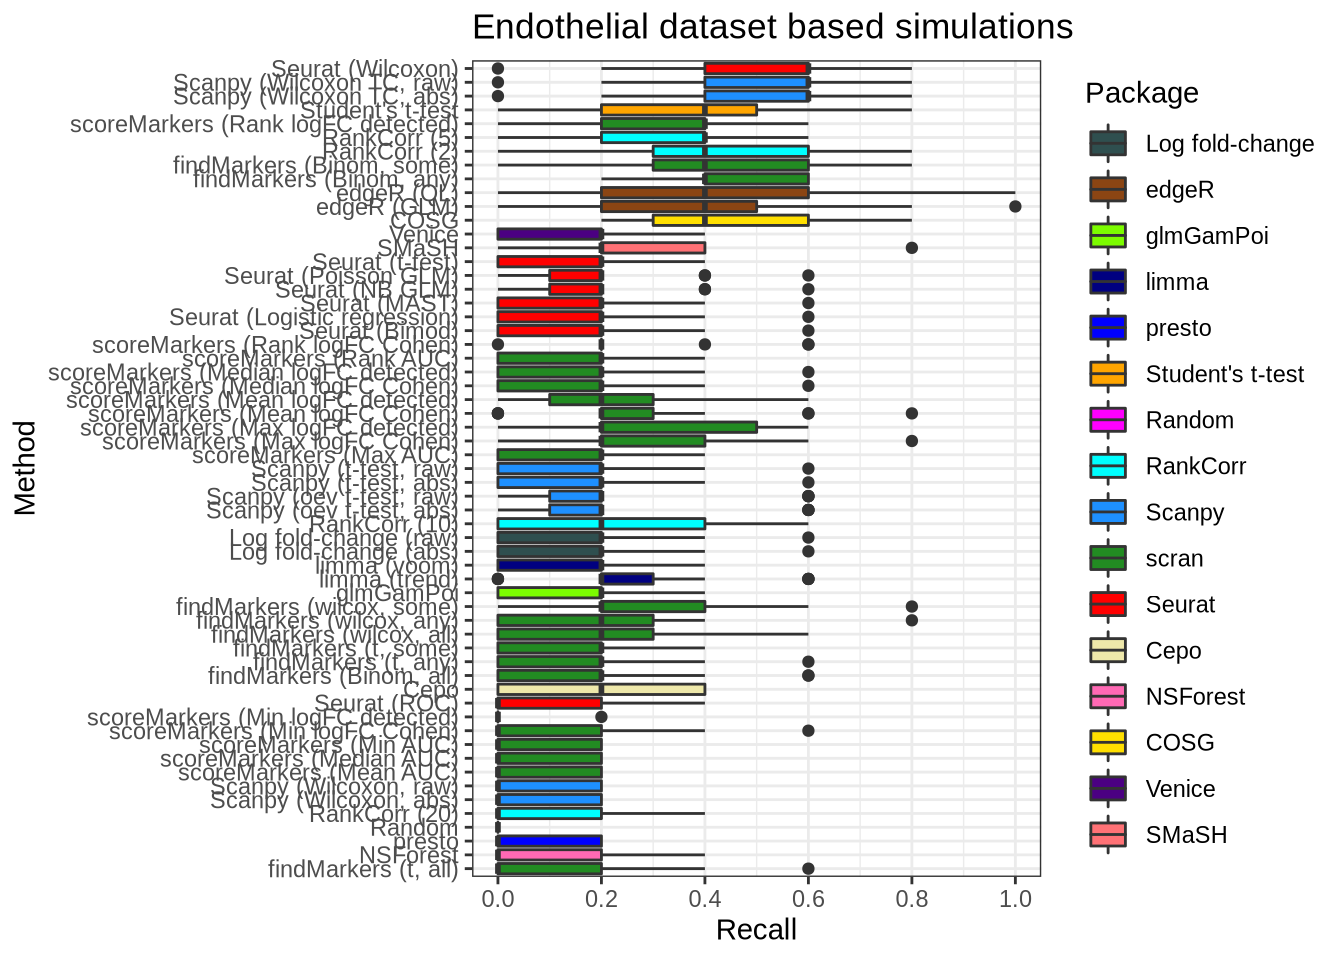
plot_metric(metrics_data, "endothelial", n_true = 5, n_sel = 5, metric = "precision")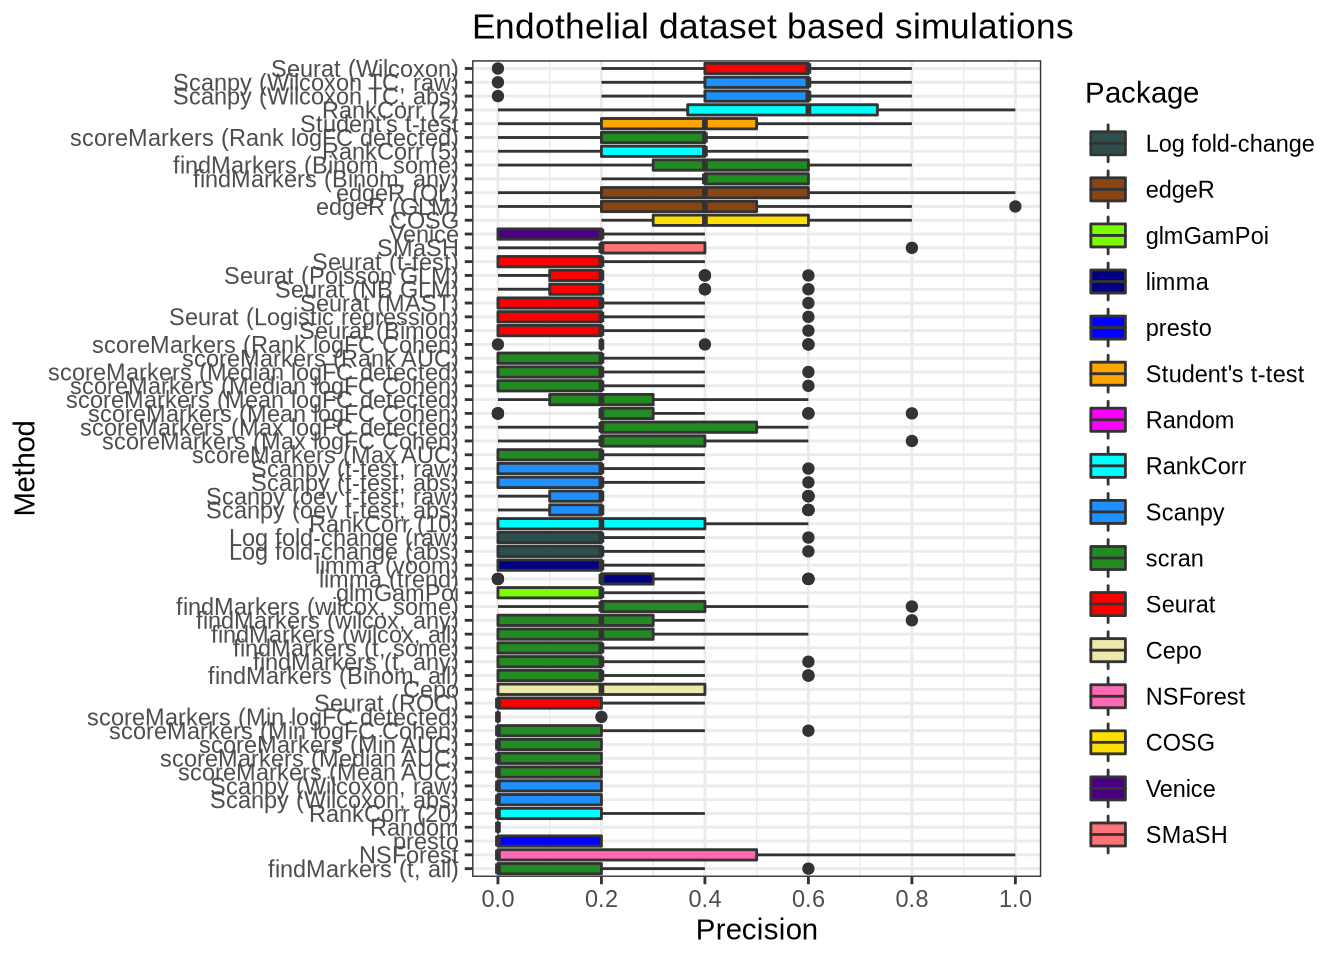
plot_metric(metrics_data, "endothelial", n_true = 20, n_sel = 20, metric = "recall")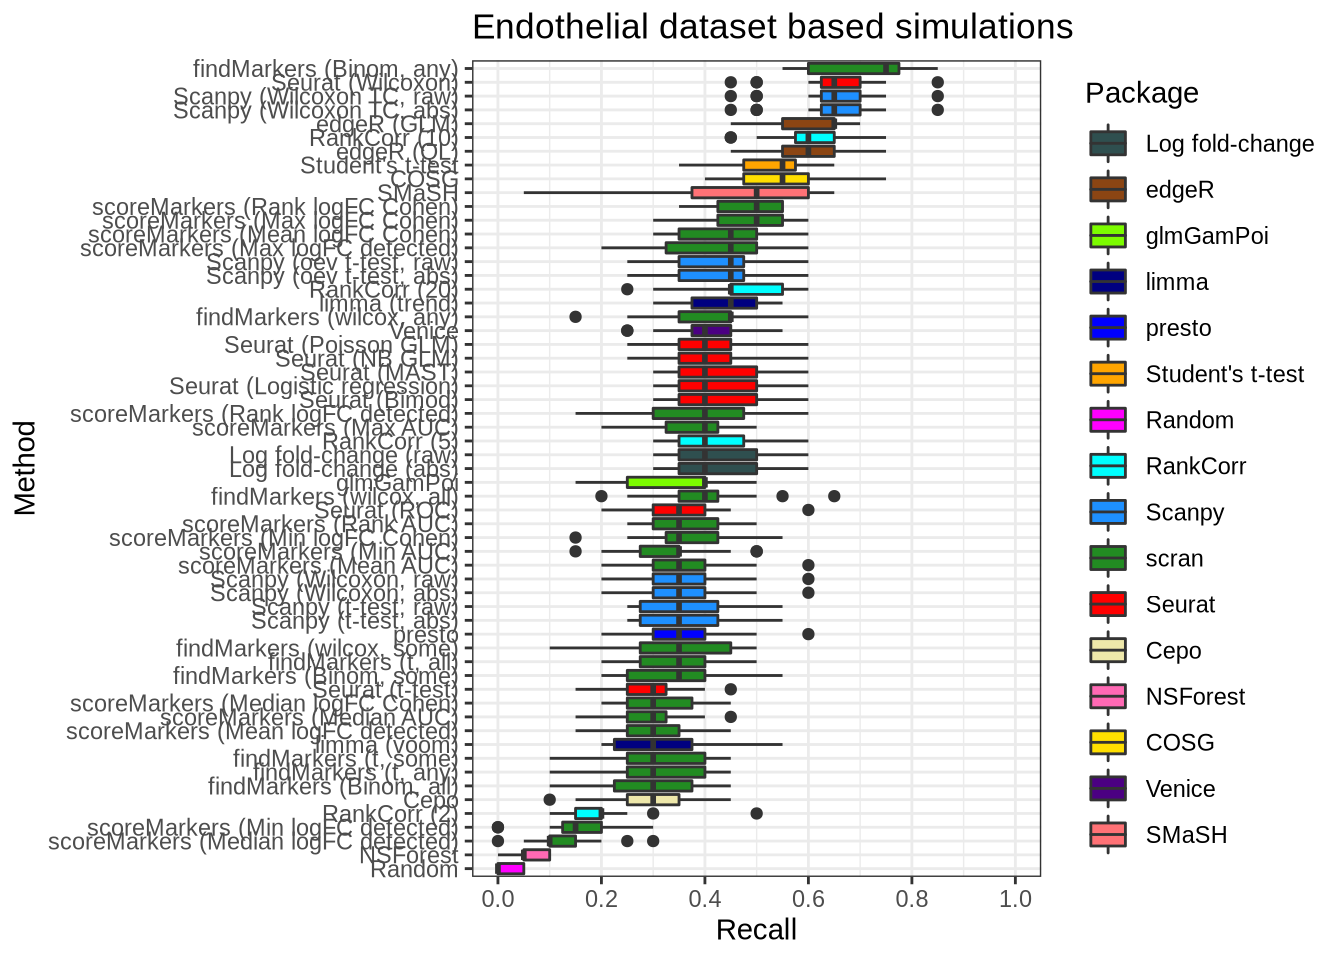
plot_metric(metrics_data, "endothelial", n_true = 20, n_sel = 20, metric = "precision")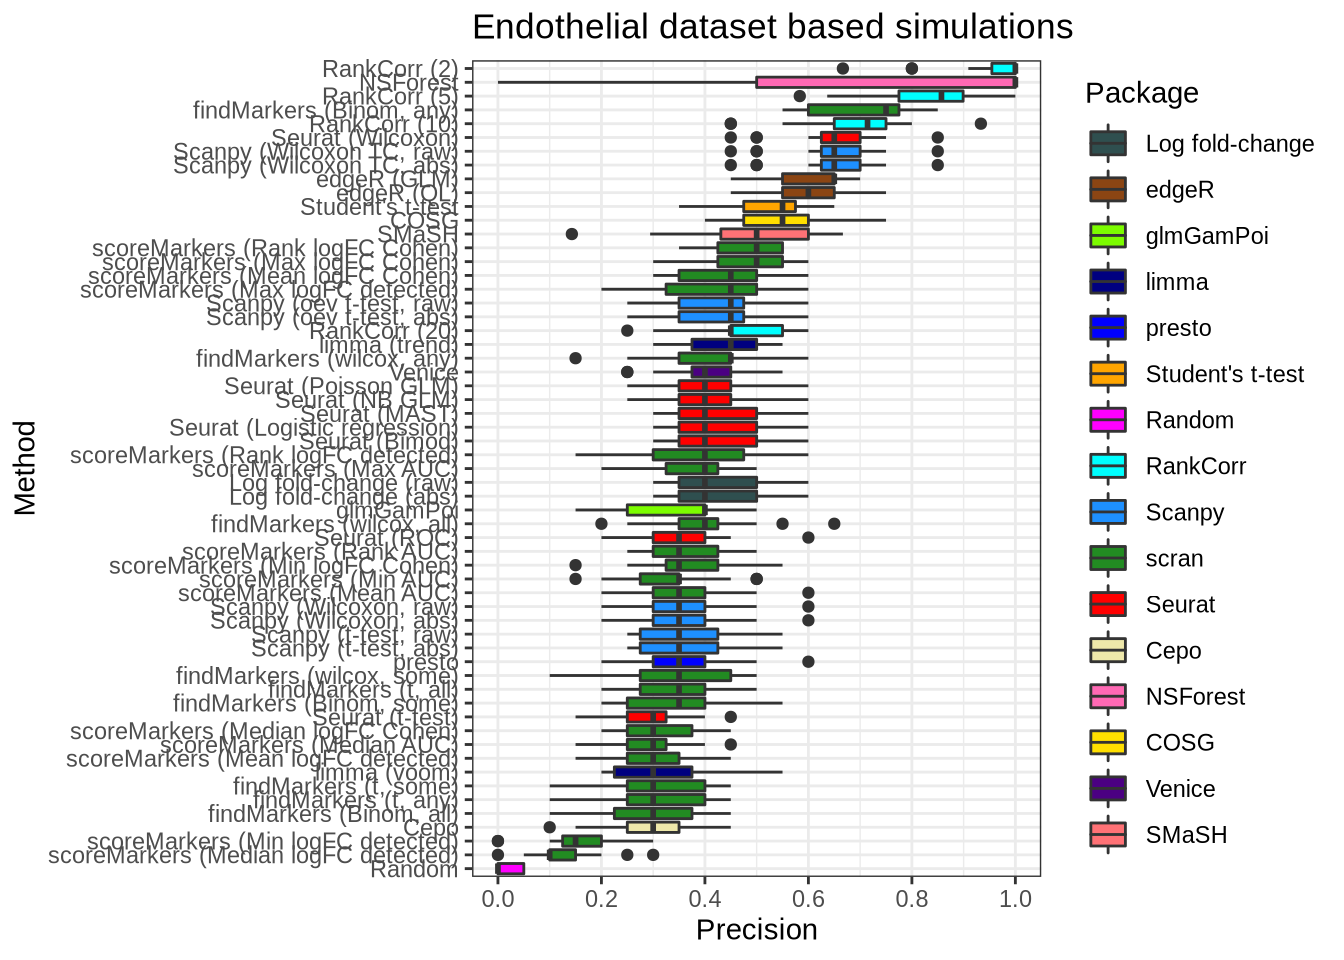
SMART-seq3 data
plot_metric(metrics_data, "ss3_pbmc", n_true = 5, n_sel = 5, metric = "recall")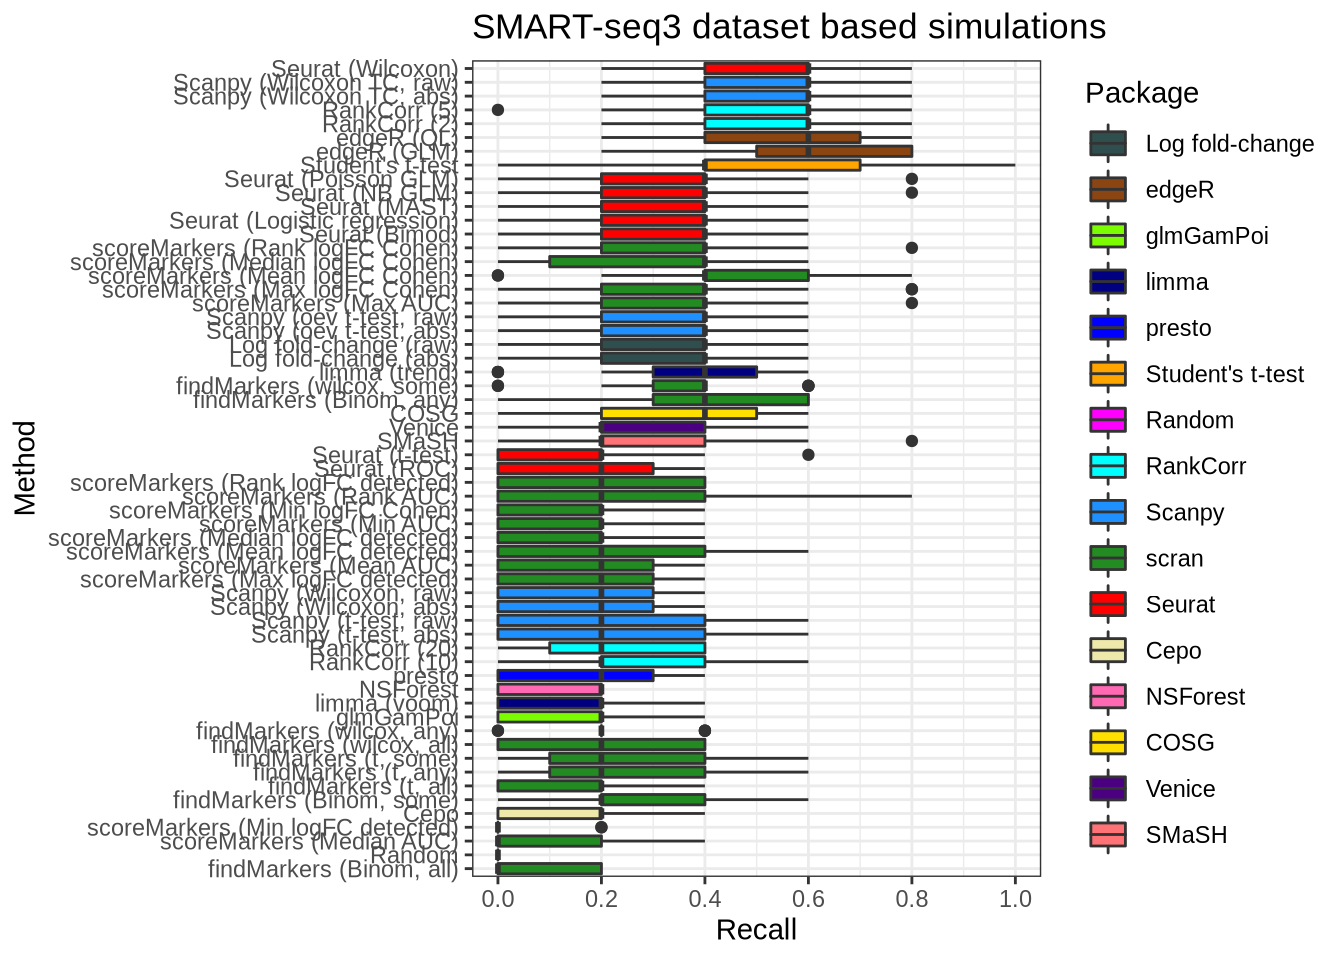
plot_metric(metrics_data, "ss3_pbmc", n_true = 5, n_sel = 5, metric = "precision")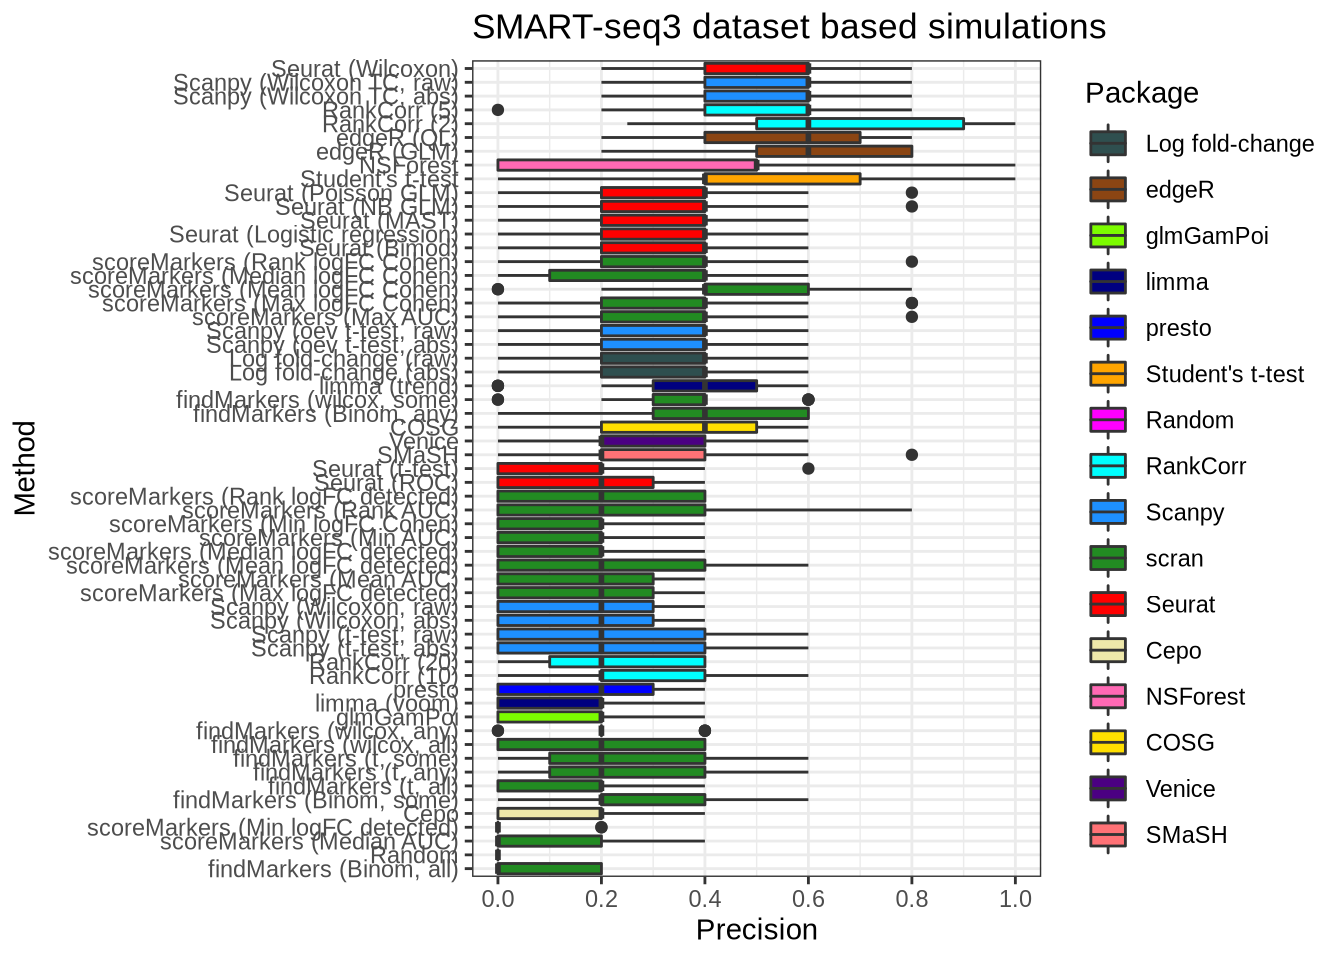
plot_metric(metrics_data, "ss3_pbmc", n_true = 20, n_sel = 20, metric = "recall")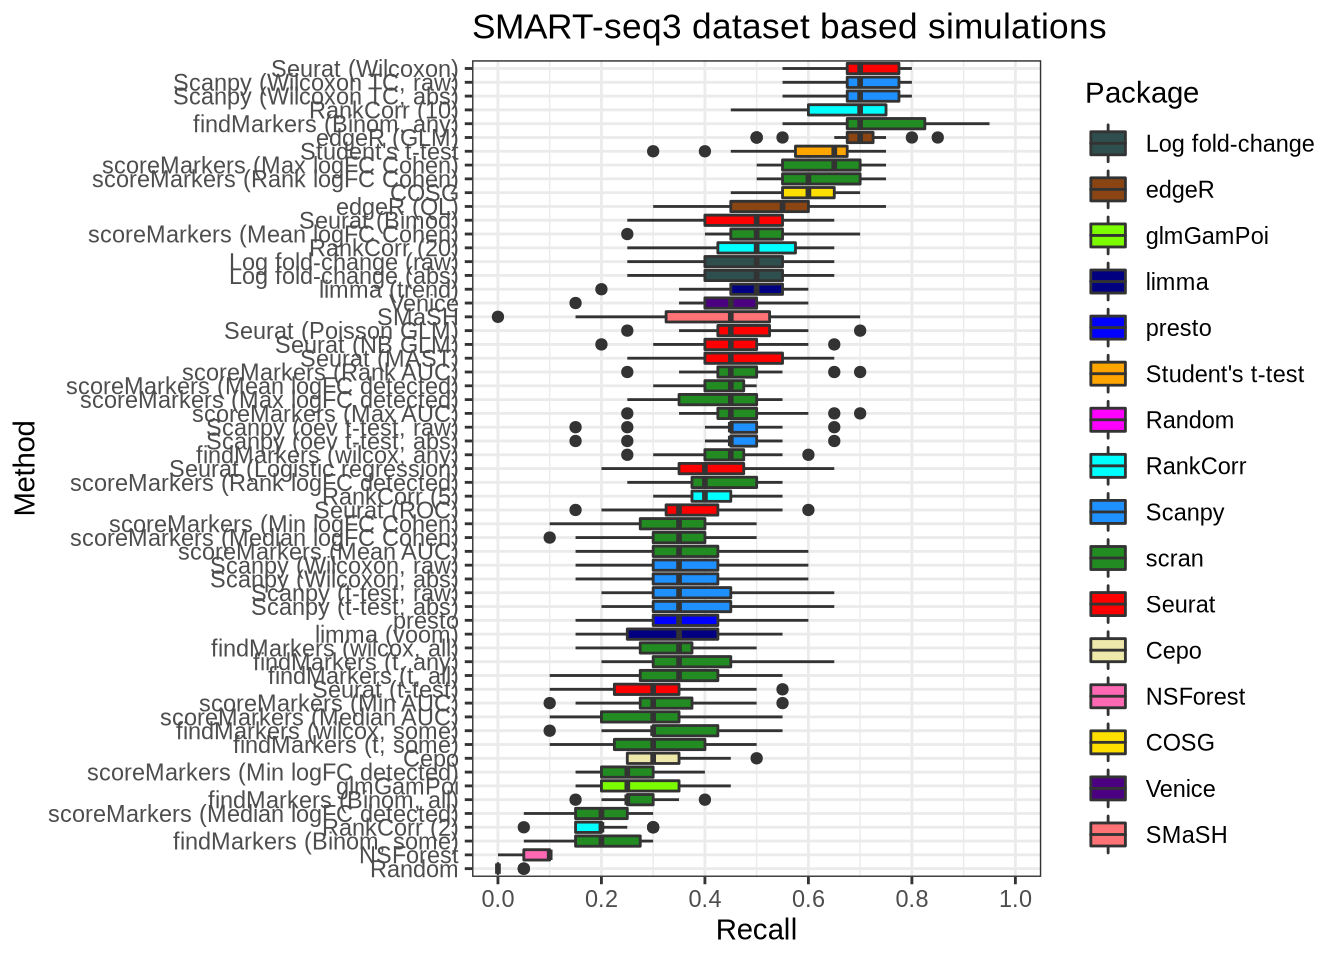
plot_metric(metrics_data, "ss3_pbmc", n_true = 20, n_sel = 20, metric = "precision")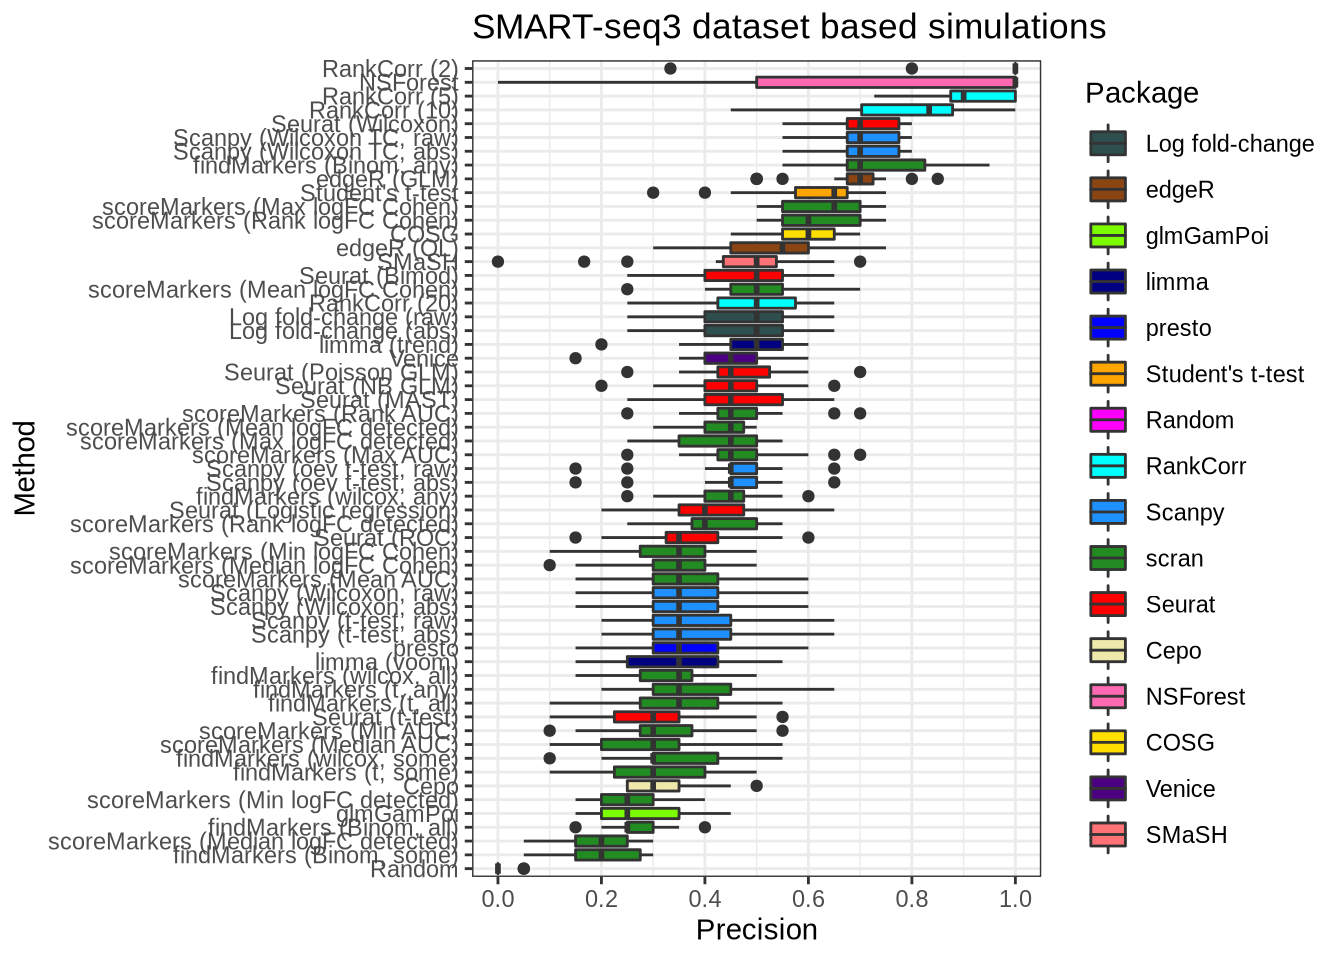
plot_metric(metrics_data, "ss3_pbmc", n_true = 40, n_sel = 40, metric = "recall")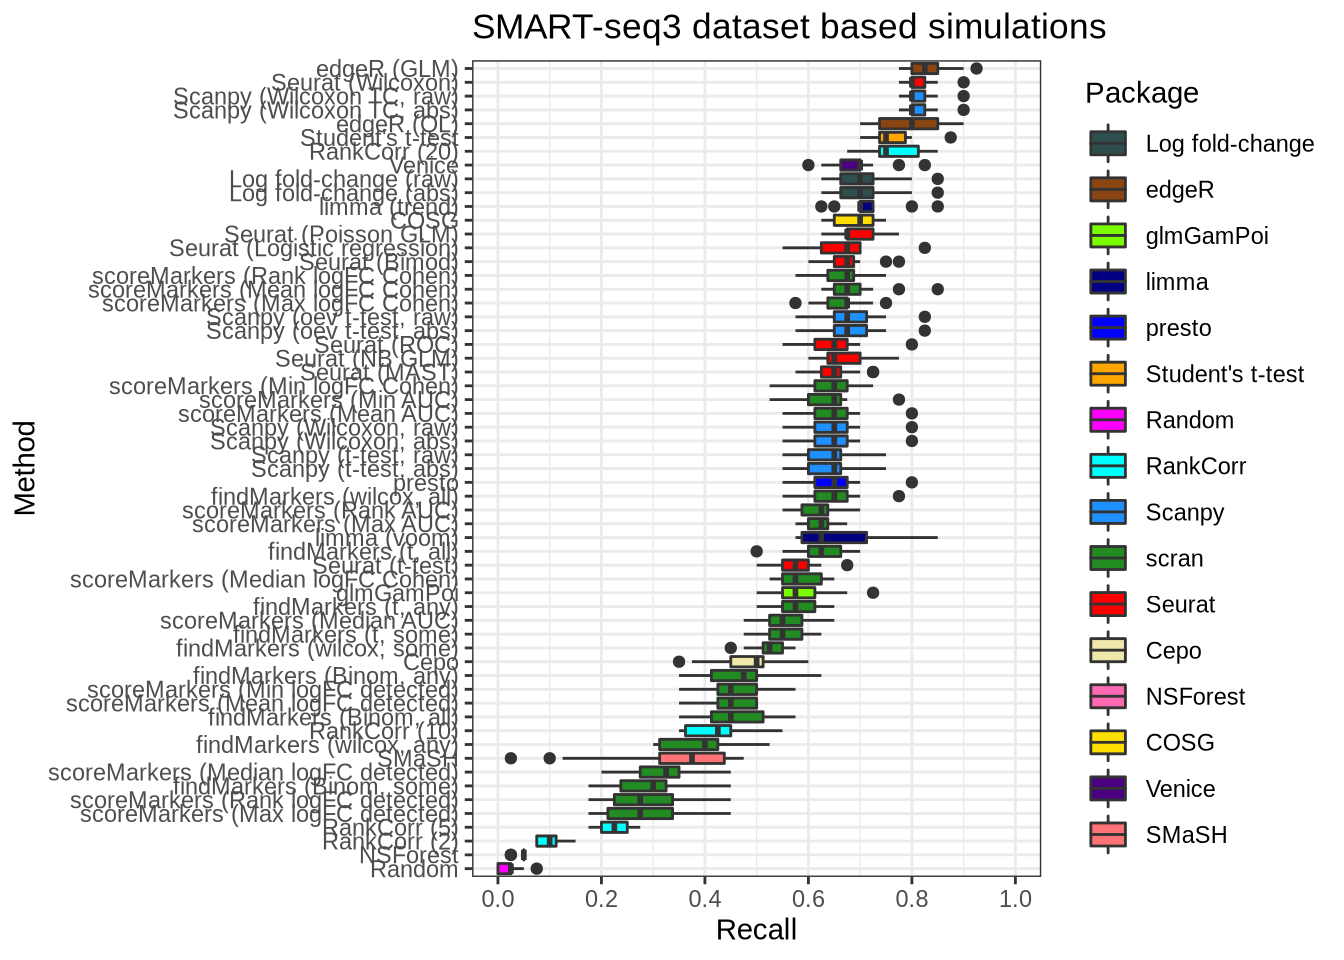
plot_metric(metrics_data, "ss3_pbmc", n_true = 40, n_sel = 40, metric = "precision")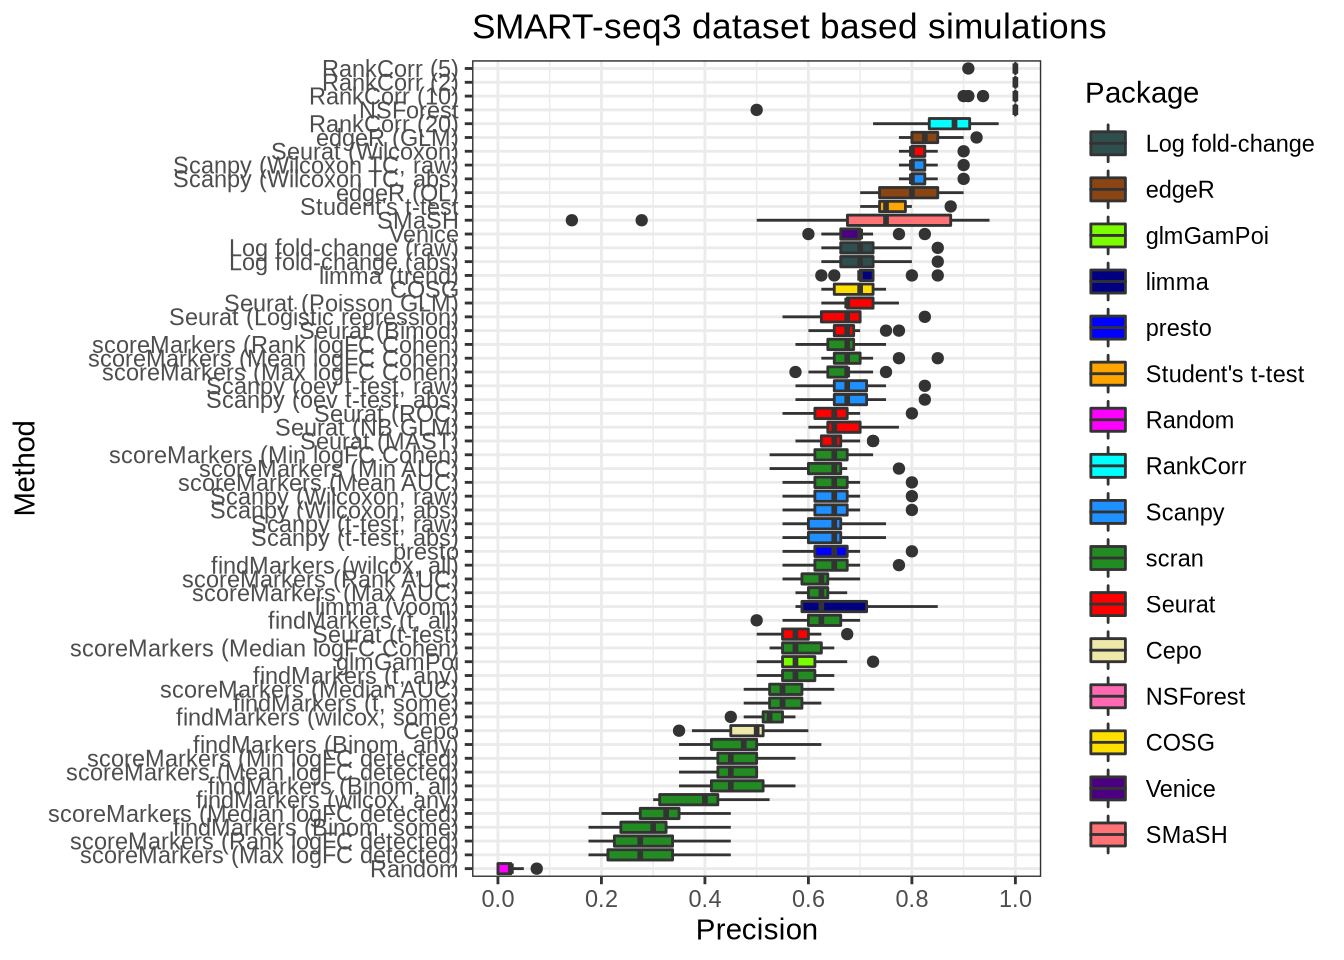
Overall
overall_recall <- plot_metric_overall(metrics_data, n_true = 20, n_sel = 20,
                                      direction = "up", metric = "recall")
overall_recall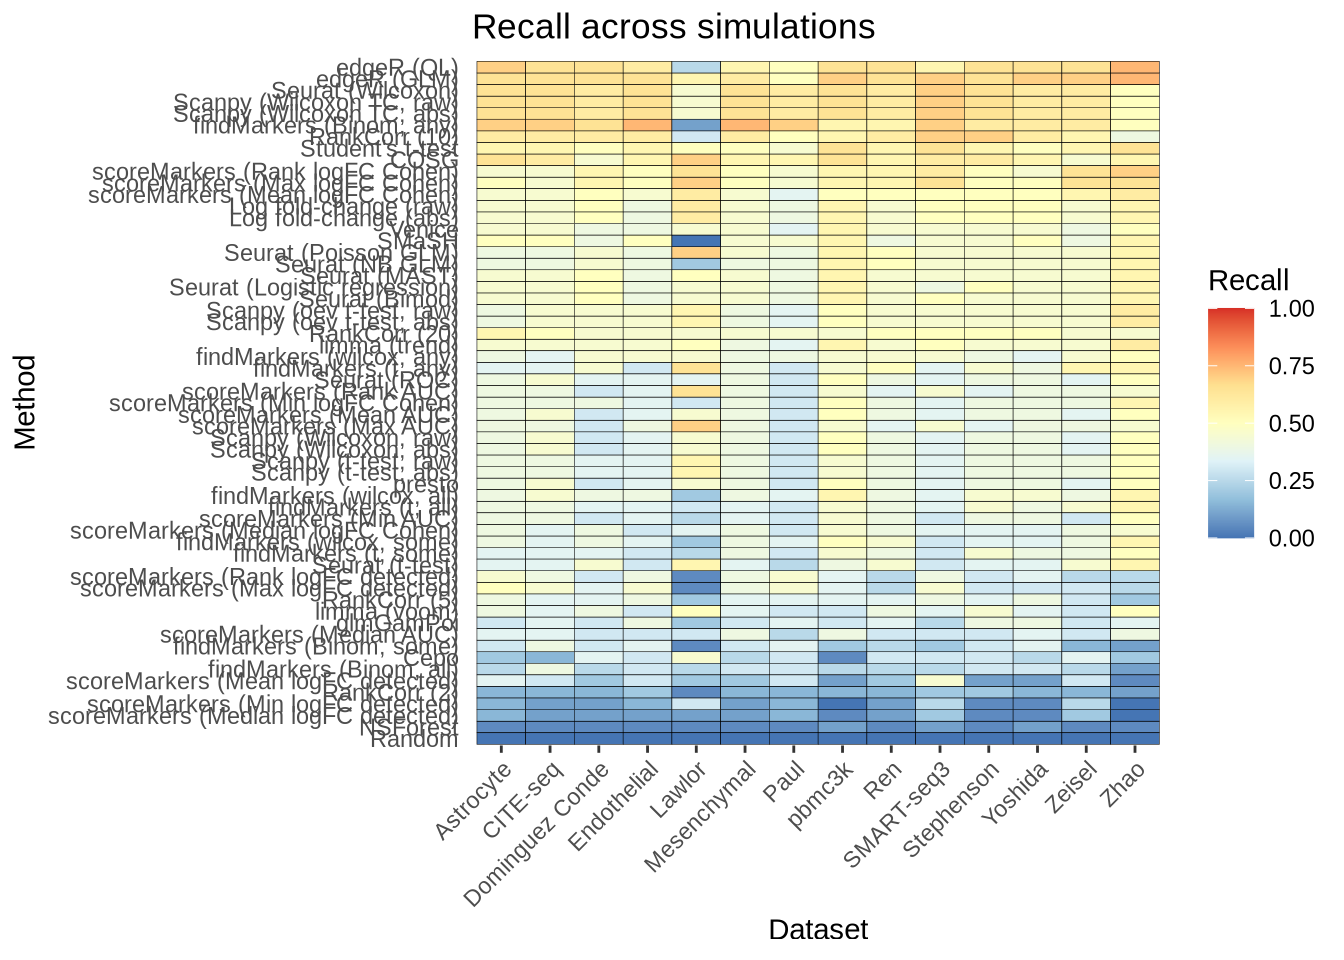
saveRDS(overall_recall, here::here("figures", "raw", "overall-recall.rds"))overall_precision <- plot_metric_overall(metrics_data, n_true = 20, n_sel = 20,
direction = "up", metric = "precision")
overall_precision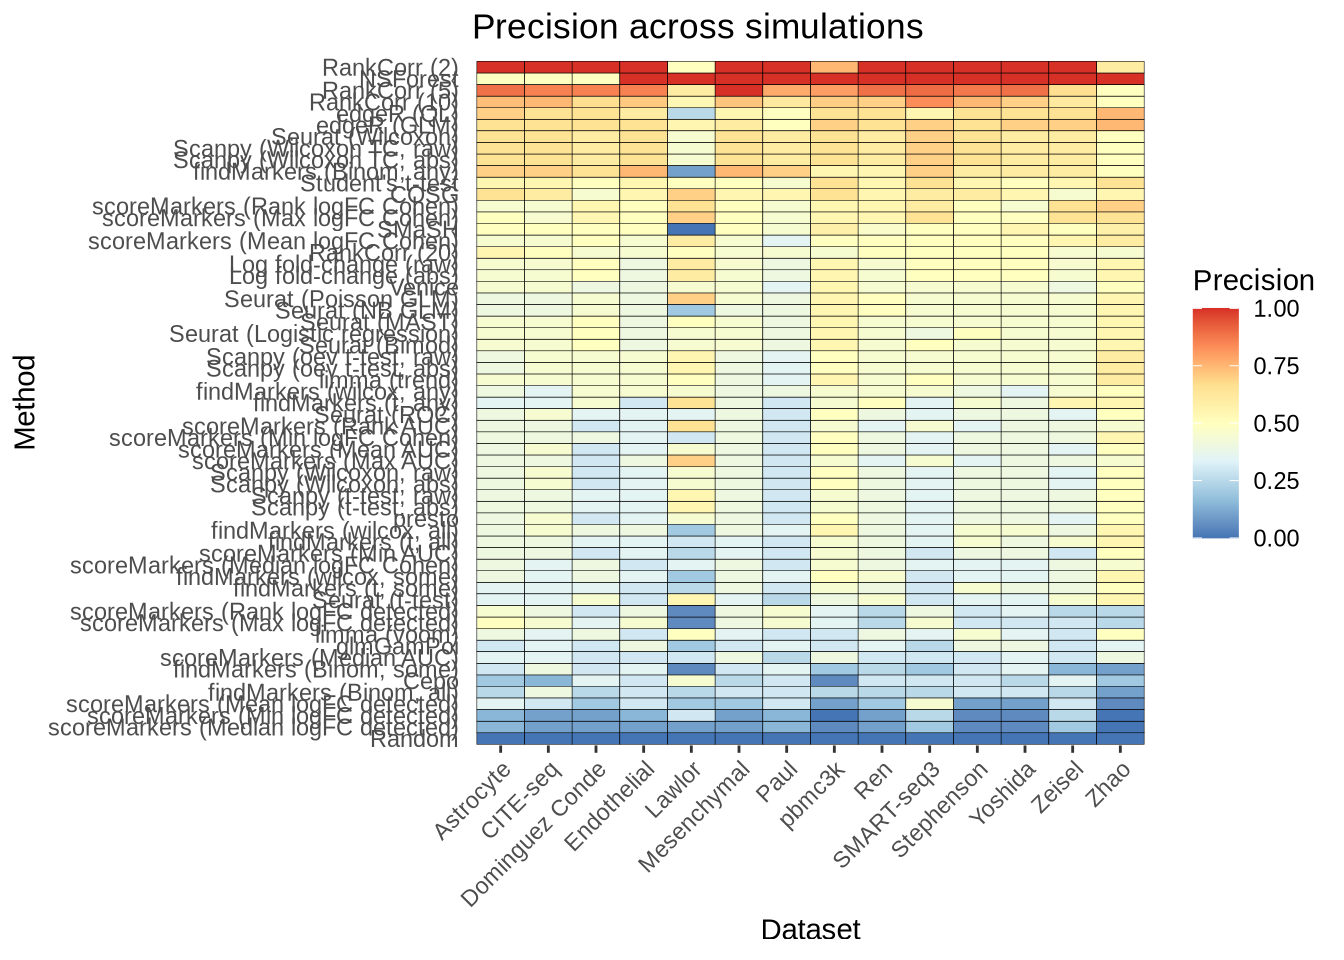
saveRDS(overall_precision, here::here("figures", "raw", "overall-precision.rds"))overall_f1_score <- plot_metric_overall(metrics_data, n_true = 20, n_sel = 20,
direction = "up", metric = "f1_score")
overall_f1_score
saveRDS(overall_f1_score, here::here("figures", "raw", "overall-f1-score.rds"))Different number of genes selected.
n_genes_selected_5 <- plot_metric_overall(metrics_data, n_true = 5, n_sel = 5,
                                          direction = "up",
                                          metric = "f1_score") +
  ggtitle("5 selected genes")
n_genes_selected_5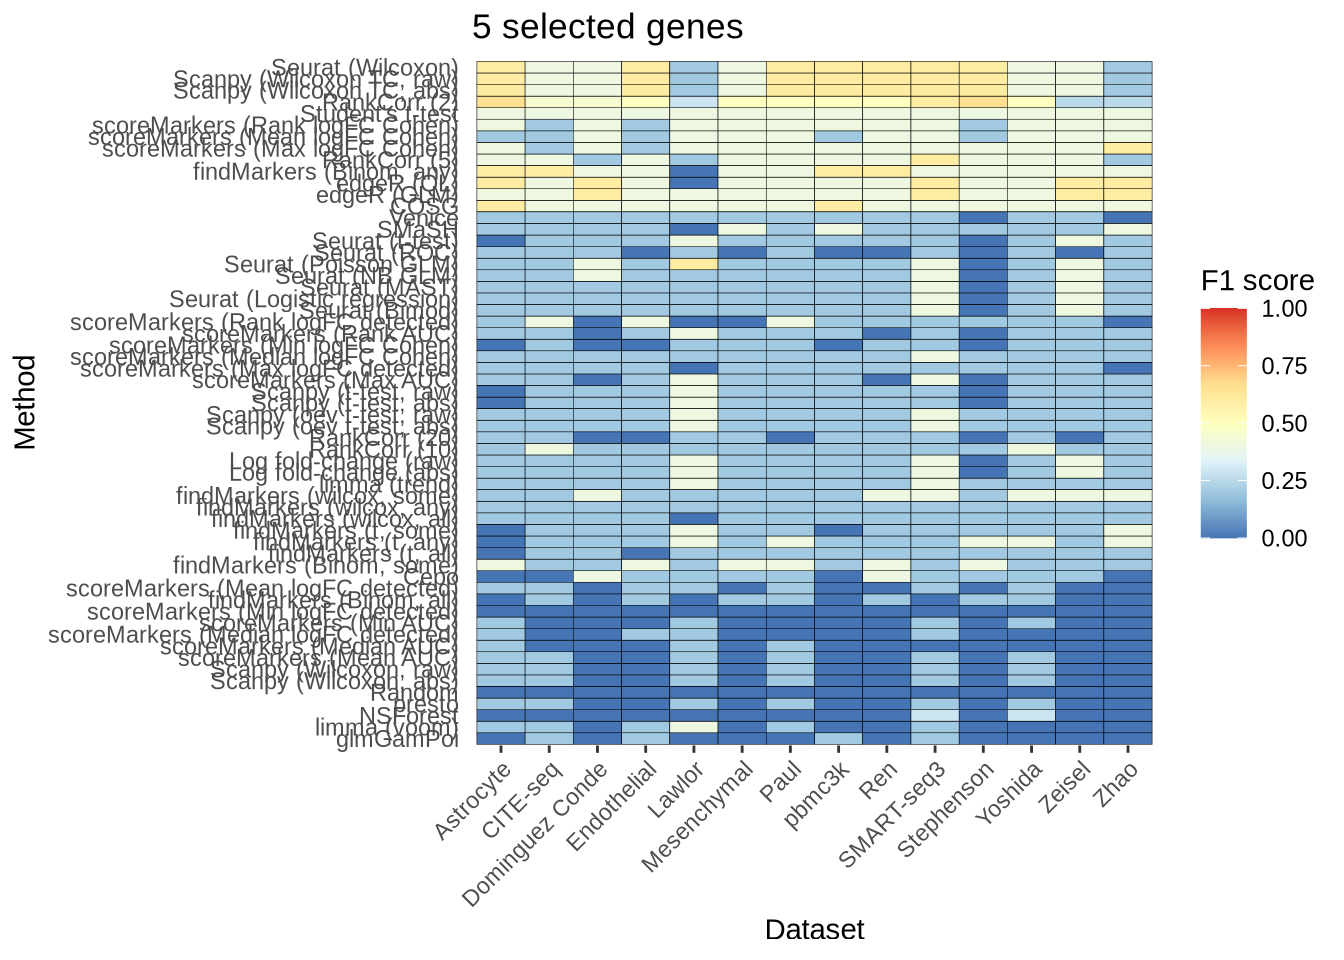
n_genes_selected_10 <- plot_metric_overall(metrics_data, n_true = 10,
                                           n_sel = 10, direction = "up",
                                           metric = "f1_score") +
  ggtitle("10 selected genes")
n_genes_selected_10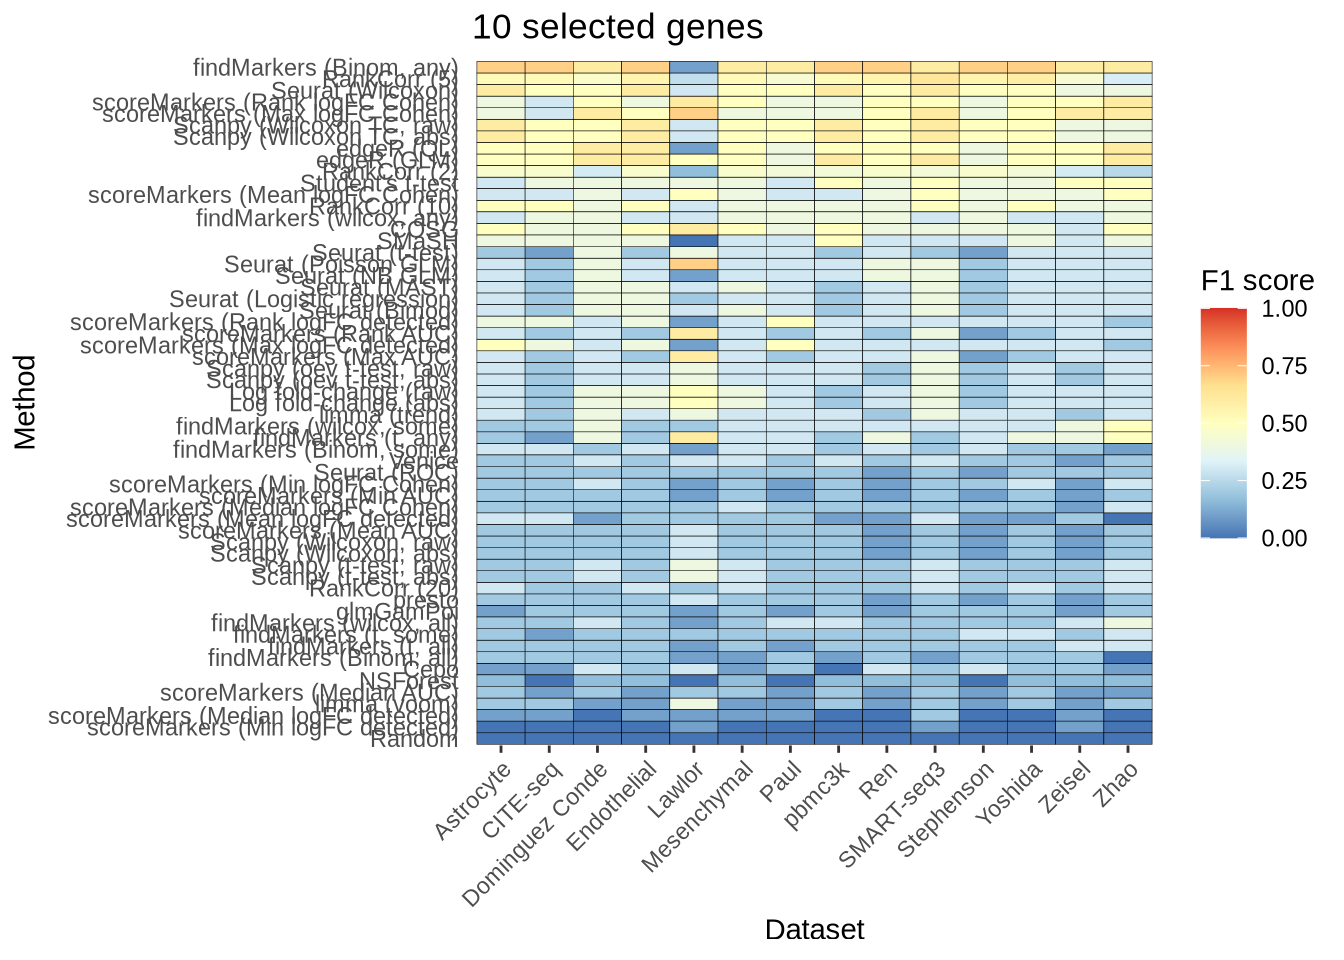
n_genes_selected_20 <- plot_metric_overall(metrics_data, n_true = 20,
                                           n_sel = 20, direction = "up",
                                           metric = "f1_score") +
  ggtitle("20 selected genes")
n_genes_selected_20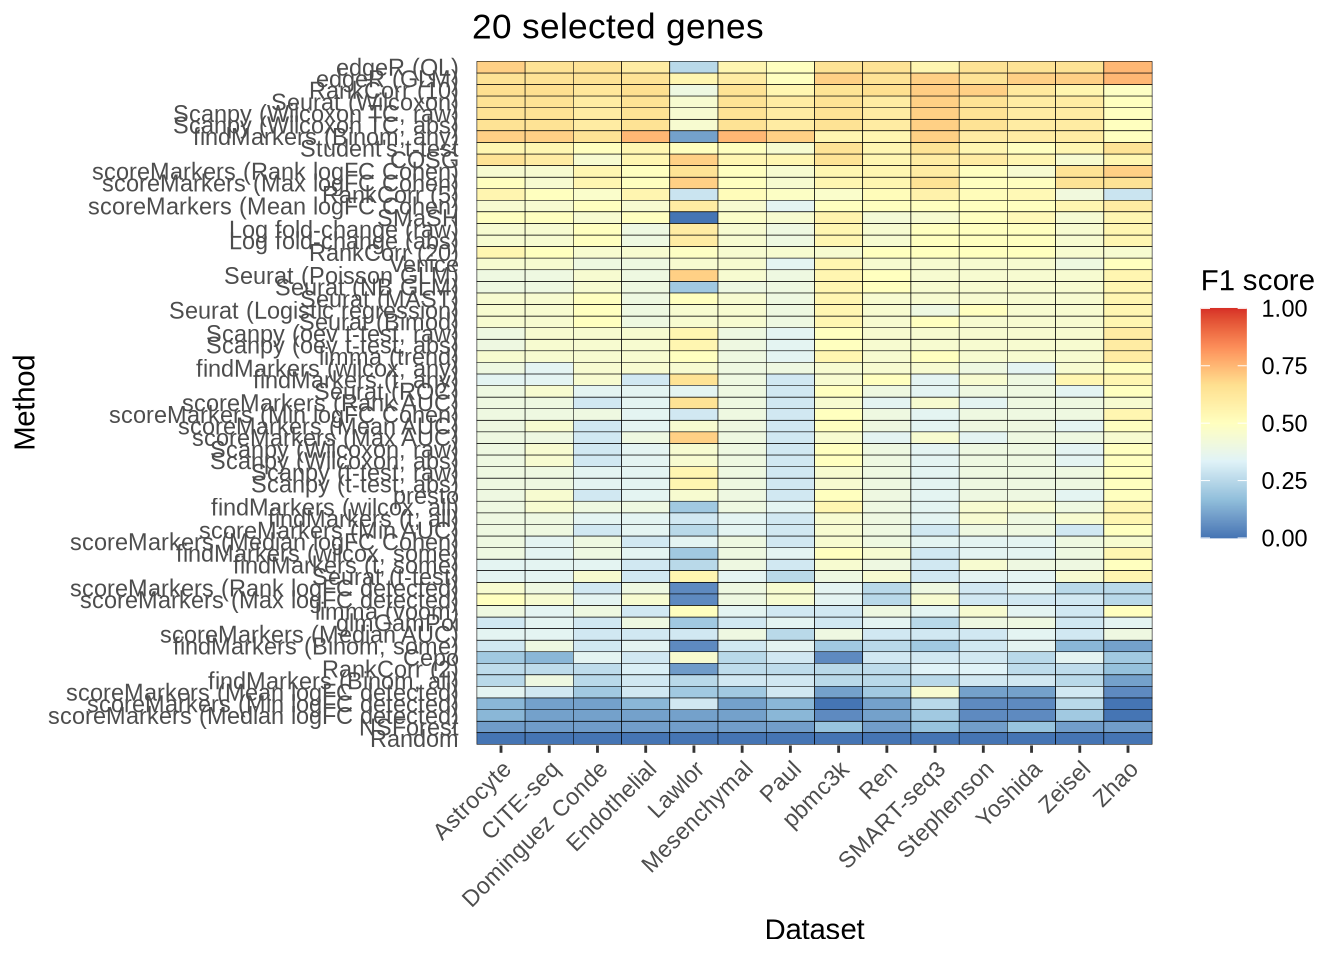
n_genes_selected_40 <- plot_metric_overall(metrics_data, n_true = 40,
                                           n_sel = 40, direction = "up",
                                           metric = "f1_score") +
  ggtitle("40 selected genes")
n_genes_selected_40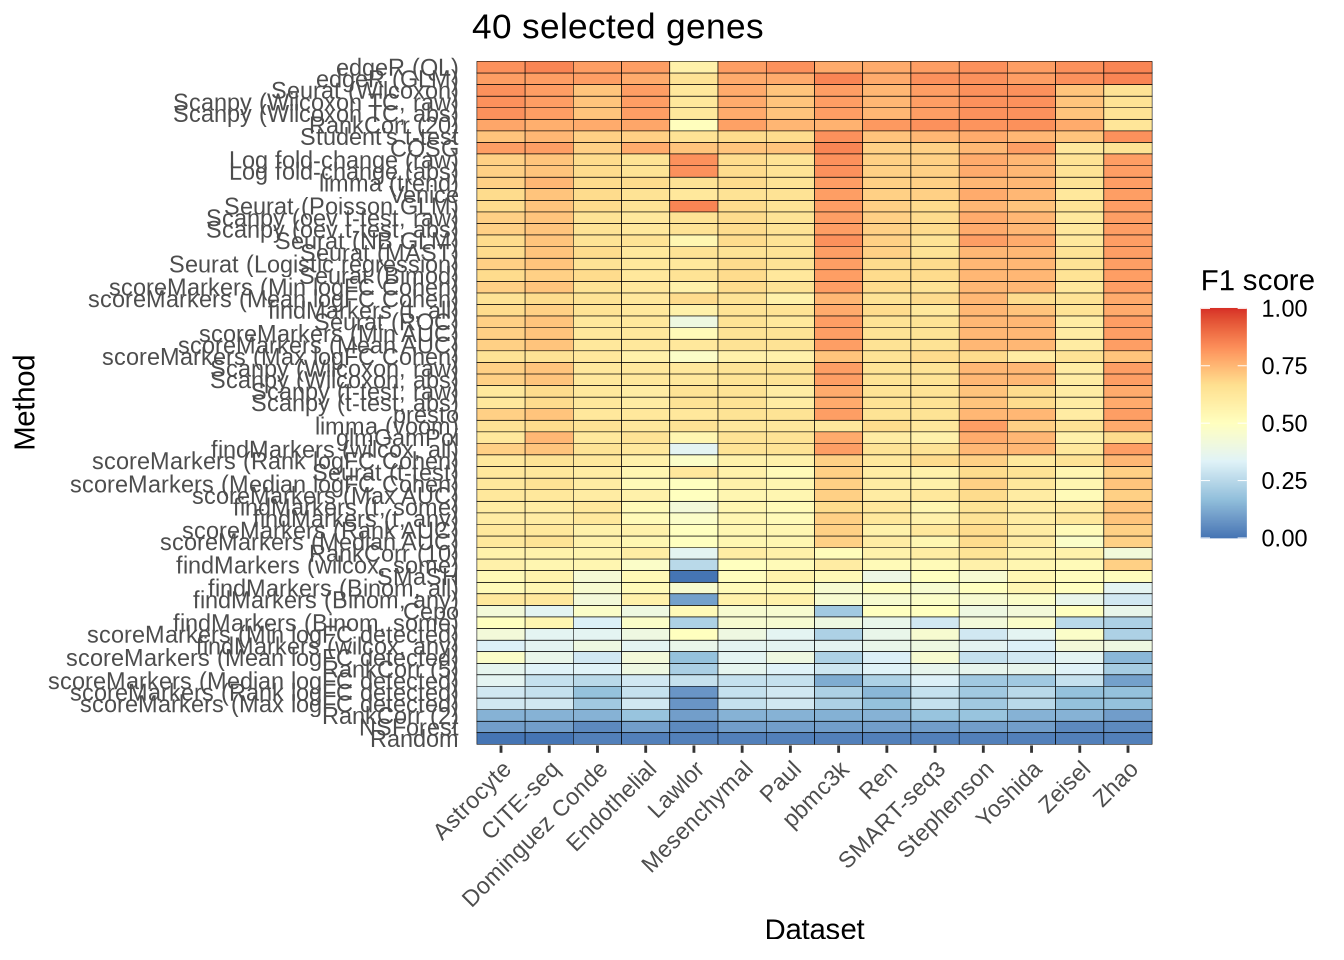
n_genes_selected <- n_genes_selected_5 + n_genes_selected_10 +
  n_genes_selected_20 + n_genes_selected_40 +
  plot_layout(guides = "collect") +
  plot_annotation(tag_levels = "a") &
  theme(plot.tag = element_text(size = 18))

n_genes_selected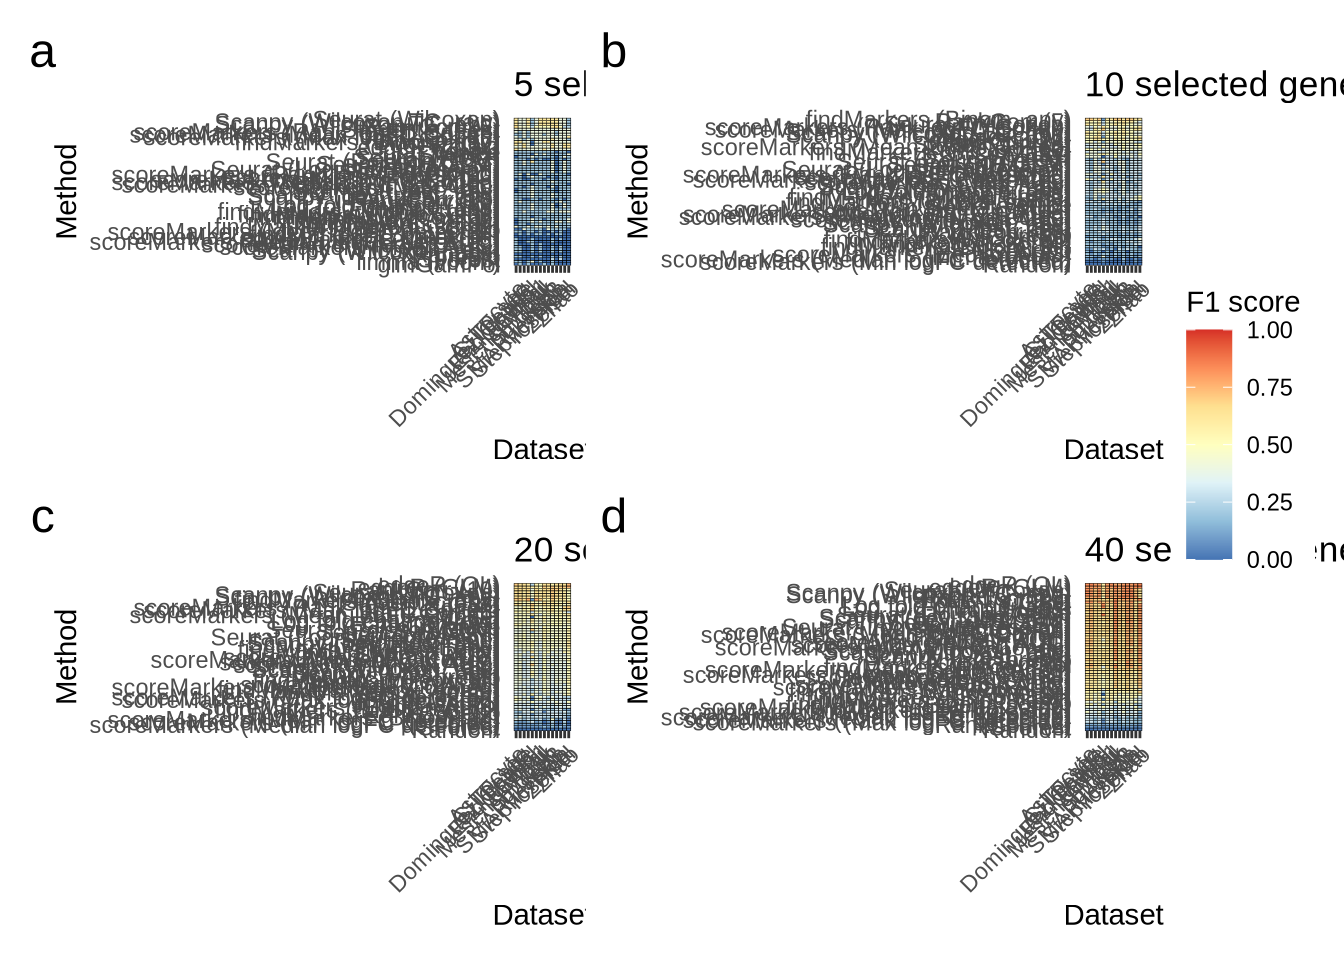
ggsave(
  here::here("figures", "final", "n-genes-results.pdf"),
  n_genes_selected,
  width = 14,
  height = 16,
  units = "in"
)
devtools::session_info()─ Session info ──────────────────────────────────────────────────────────────
hash: leg, rat, flag: Tuvalu
setting value
version R version 4.1.2 (2021-11-01)
os Red Hat Enterprise Linux 9.2 (Plow)
system x86_64, linux-gnu
ui X11
language (EN)
collate en_AU.UTF-8
ctype en_AU.UTF-8
tz Australia/Melbourne
date 2024-01-01
pandoc 2.18 @ /apps/easybuild-2022/easybuild/software/MPI/GCC/11.3.0/OpenMPI/4.1.4/RStudio-Server/2022.07.2+576-Java-11-R-4.1.2/bin/pandoc/ (via rmarkdown)
─ Packages ───────────────────────────────────────────────────────────────────
package * version date (UTC) lib source
assertthat 0.2.1 2019-03-21 [2] CRAN (R 4.1.2)
beachmat 2.10.0 2021-10-26 [1] Bioconductor
beeswarm 0.4.0 2021-06-01 [2] CRAN (R 4.1.2)
Biobase * 2.54.0 2021-10-26 [1] Bioconductor
BiocGenerics * 0.40.0 2021-10-26 [1] Bioconductor
BiocNeighbors 1.12.0 2021-10-26 [1] Bioconductor
BiocParallel 1.28.3 2021-12-09 [1] Bioconductor
BiocSingular 1.10.0 2021-10-26 [1] Bioconductor
bitops 1.0-7 2021-04-24 [2] CRAN (R 4.1.2)
bslib 0.3.1 2021-10-06 [1] CRAN (R 4.1.0)
cachem 1.0.6 2021-08-19 [1] CRAN (R 4.1.0)
callr 3.7.0 2021-04-20 [2] CRAN (R 4.1.2)
cli 3.6.1 2023-03-23 [1] CRAN (R 4.1.0)
colorspace 2.1-0 2023-01-23 [1] CRAN (R 4.1.0)
crayon 1.5.1 2022-03-26 [1] CRAN (R 4.1.0)
DBI 1.1.2 2021-12-20 [1] CRAN (R 4.1.0)
DelayedArray 0.20.0 2021-10-26 [1] Bioconductor
DelayedMatrixStats 1.16.0 2021-10-26 [1] Bioconductor
desc 1.4.0 2021-09-28 [2] CRAN (R 4.1.2)
devtools 2.4.2 2021-06-07 [2] CRAN (R 4.1.2)
digest 0.6.29 2021-12-01 [1] CRAN (R 4.1.0)
dplyr * 1.0.9 2022-04-28 [1] CRAN (R 4.1.0)
ellipsis 0.3.2 2021-04-29 [2] CRAN (R 4.1.2)
evaluate 0.14 2019-05-28 [2] CRAN (R 4.1.2)
fansi 1.0.4 2023-01-22 [1] CRAN (R 4.1.0)
farver 2.1.1 2022-07-06 [1] CRAN (R 4.1.0)
fastmap 1.1.0 2021-01-25 [2] CRAN (R 4.1.2)
forcats * 0.5.1 2021-01-27 [2] CRAN (R 4.1.2)
fs 1.5.2 2021-12-08 [1] CRAN (R 4.1.0)
generics 0.1.3 2022-07-05 [1] CRAN (R 4.1.0)
GenomeInfoDb * 1.30.0 2021-10-26 [1] Bioconductor
GenomeInfoDbData 1.2.7 2021-12-03 [1] Bioconductor
GenomicRanges * 1.46.1 2021-11-18 [1] Bioconductor
ggbeeswarm 0.6.0 2017-08-07 [2] CRAN (R 4.1.2)
ggplot2 * 3.3.6 2022-05-03 [1] CRAN (R 4.1.0)
ggrepel 0.9.1 2021-01-15 [2] CRAN (R 4.1.2)
git2r 0.28.0 2021-01-10 [2] CRAN (R 4.1.2)
glue 1.6.0 2021-12-17 [1] CRAN (R 4.1.0)
gridExtra 2.3 2017-09-09 [2] CRAN (R 4.1.2)
gtable 0.3.0 2019-03-25 [2] CRAN (R 4.1.2)
here 1.0.1 2020-12-13 [1] CRAN (R 4.1.0)
highr 0.9 2021-04-16 [2] CRAN (R 4.1.2)
htmltools 0.5.2 2021-08-25 [1] CRAN (R 4.1.0)
httpuv 1.6.5 2022-01-05 [1] CRAN (R 4.1.0)
IRanges * 2.28.0 2021-10-26 [1] Bioconductor
irlba 2.3.5 2021-12-06 [1] CRAN (R 4.1.0)
jquerylib 0.1.4 2021-04-26 [2] CRAN (R 4.1.2)
jsonlite 1.8.0 2022-02-22 [1] CRAN (R 4.1.0)
knitr 1.36 2021-09-29 [1] CRAN (R 4.1.0)
labeling 0.4.2 2020-10-20 [2] CRAN (R 4.1.2)
later 1.3.0 2021-08-18 [1] CRAN (R 4.1.0)
lattice 0.20-45 2021-09-22 [2] CRAN (R 4.1.2)
lifecycle 1.0.1 2021-09-24 [1] CRAN (R 4.1.0)
magrittr 2.0.3 2022-03-30 [1] CRAN (R 4.1.0)
Matrix 1.3-4 2021-06-01 [2] CRAN (R 4.1.2)
MatrixGenerics * 1.6.0 2021-10-26 [1] Bioconductor
matrixStats * 0.62.0 2022-04-19 [1] CRAN (R 4.1.0)
memoise 2.0.1 2021-11-26 [1] CRAN (R 4.1.0)
munsell 0.5.0 2018-06-12 [2] CRAN (R 4.1.2)
patchwork * 1.1.1 2020-12-17 [2] CRAN (R 4.1.2)
pillar 1.7.0 2022-02-01 [1] CRAN (R 4.1.0)
pkgbuild 1.2.0 2020-12-15 [2] CRAN (R 4.1.2)
pkgconfig 2.0.3 2019-09-22 [2] CRAN (R 4.1.2)
pkgload 1.2.3 2021-10-13 [2] CRAN (R 4.1.2)
prettyunits 1.1.1 2020-01-24 [2] CRAN (R 4.1.2)
processx 3.5.2 2021-04-30 [2] CRAN (R 4.1.2)
promises 1.2.0.1 2021-02-11 [2] CRAN (R 4.1.2)
ps 1.7.1 2022-06-18 [1] CRAN (R 4.1.0)
purrr * 0.3.4 2020-04-17 [2] CRAN (R 4.1.2)
R6 2.5.1 2021-08-19 [1] CRAN (R 4.1.0)
RColorBrewer 1.1-3 2022-04-03 [1] CRAN (R 4.1.0)
Rcpp 1.0.8.3 2022-03-17 [1] CRAN (R 4.1.0)
RCurl 1.98-1.5 2021-09-17 [1] CRAN (R 4.1.0)
remotes 2.4.2 2021-11-30 [1] CRAN (R 4.1.0)
rlang 1.0.3 2022-06-27 [1] CRAN (R 4.1.0)
rmarkdown 2.14 2022-04-25 [1] CRAN (R 4.1.0)
rprojroot 2.0.3 2022-04-02 [1] CRAN (R 4.1.0)
rstudioapi 0.14 2022-08-22 [1] CRAN (R 4.1.0)
rsvd 1.0.5 2021-04-16 [1] CRAN (R 4.1.0)
S4Vectors * 0.32.3 2021-11-21 [1] Bioconductor
sass 0.4.1 2022-03-23 [1] CRAN (R 4.1.0)
ScaledMatrix 1.2.0 2021-10-26 [1] Bioconductor
scales 1.2.1 2022-08-20 [1] CRAN (R 4.1.0)
scater * 1.22.0 2021-10-26 [1] Bioconductor
scuttle * 1.4.0 2021-10-26 [1] Bioconductor
sessioninfo 1.2.0 2021-10-31 [2] CRAN (R 4.1.2)
SingleCellExperiment * 1.16.0 2021-10-26 [1] Bioconductor
sparseMatrixStats 1.6.0 2021-10-26 [1] Bioconductor
stringi 1.7.6 2021-11-29 [1] CRAN (R 4.1.0)
stringr 1.4.0 2019-02-10 [2] CRAN (R 4.1.2)
SummarizedExperiment * 1.24.0 2021-10-26 [1] Bioconductor
testthat 3.1.0 2021-10-04 [2] CRAN (R 4.1.2)
tibble * 3.1.7 2022-05-03 [1] CRAN (R 4.1.0)
tidyr * 1.2.0 2022-02-01 [1] CRAN (R 4.1.0)
tidyselect 1.1.2 2022-02-21 [1] CRAN (R 4.1.0)
usethis 2.1.3 2021-10-27 [2] CRAN (R 4.1.2)
utf8 1.2.3 2023-01-31 [1] CRAN (R 4.1.0)
vctrs 0.4.1 2022-04-13 [1] CRAN (R 4.1.0)
vipor 0.4.5 2017-03-22 [2] CRAN (R 4.1.2)
viridis 0.6.2 2021-10-13 [1] CRAN (R 4.1.0)
viridisLite 0.4.2 2023-05-02 [1] CRAN (R 4.1.0)
whisker 0.4 2019-08-28 [2] CRAN (R 4.1.2)
withr 2.5.0 2022-03-03 [1] CRAN (R 4.1.0)
workflowr 1.7.0 2021-12-21 [1] CRAN (R 4.1.0)
xfun 0.31 2022-05-10 [1] CRAN (R 4.1.0)
XVector 0.34.0 2021-10-26 [1] Bioconductor
yaml 2.3.5 2022-02-21 [1] CRAN (R 4.1.0)
zlibbioc 1.40.0 2021-10-26 [1] Bioconductor
[1] /home/jpullin/R/x86_64-pc-linux-gnu-library/4.1
[2] /apps/easybuild-2022/easybuild/software/MPI/GCC/11.3.0/OpenMPI/4.1.4/R/4.1.2/lib64/R/library
──────────────────────────────────────────────────────────────────────────────